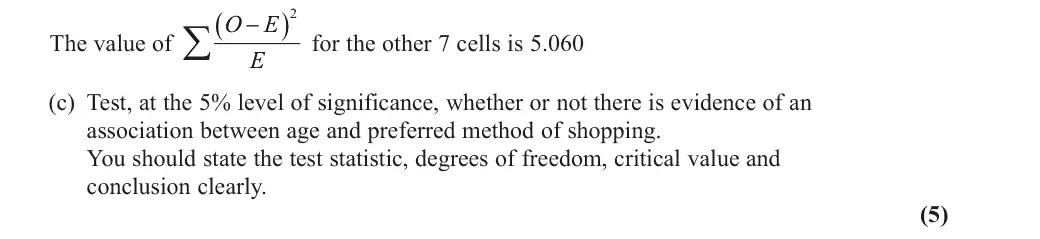
Σ(O − E)²/E and the χ² percentage-points table are given. Degrees of freedom are not.
Since 2018
69 question parts, 190 marks, 2 with a difficulty rating from the examiner's report
Notes, worked examples and practice for this topic are being written by our tutors. The past-paper questions below are ready now: work each one on paper, then open the mark scheme and the examiner's comment.
Tap a question to zoom it. Mark scheme and examiner's comment open under each question.
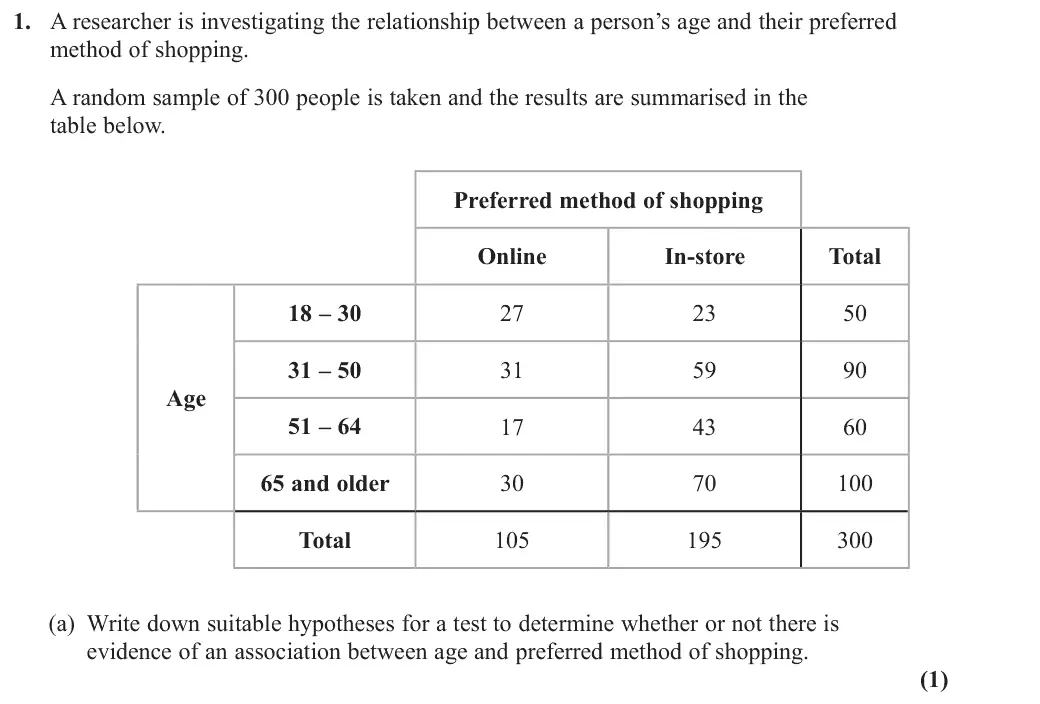
June 2025 · AS Paper 2 (Further Statistics 1) · Q1(a)1 mark
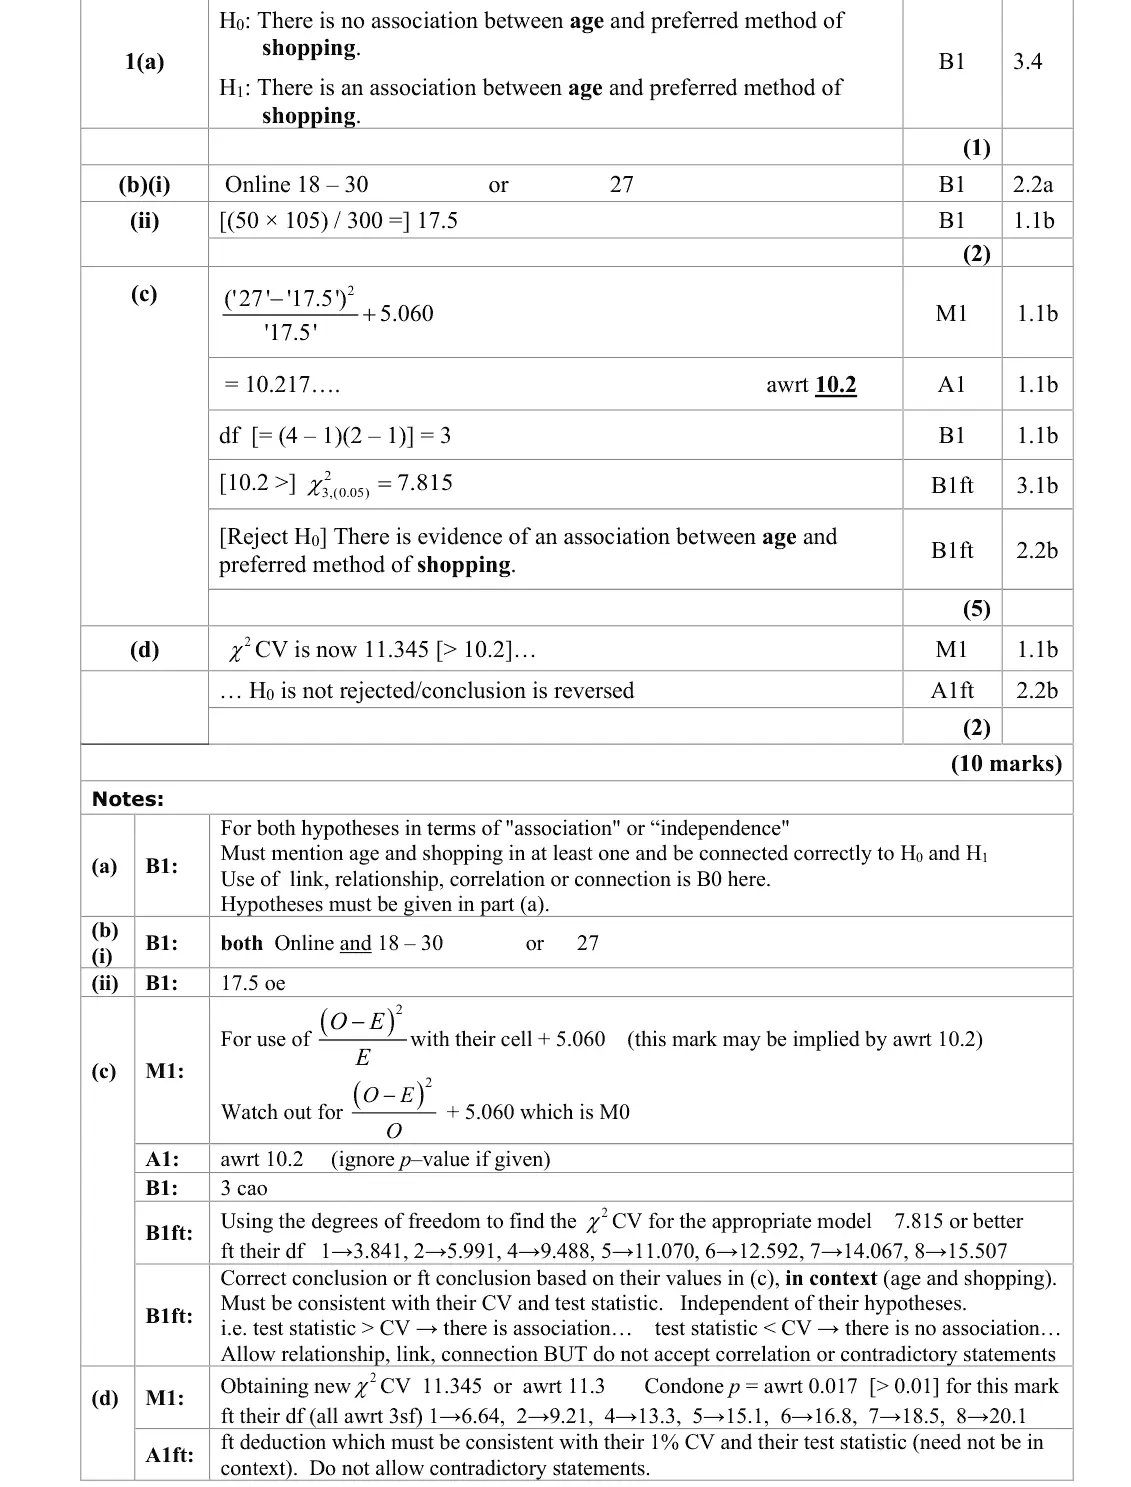
Mark scheme (whole question; this part is marked with the orange bar)
Examiner's comment
(a) Most were able to set up appropriate hypotheses using the required context of ‘age’ and ‘shopping’. On some occasions, these were given the wrong way round. Others used vague or incorrect language such as ‘relationship’ or ‘correlation’.
Key points from the mark scheme and examiner's report
H₀: no association between age and preferred method of shopping, H₁: association
"relationship" or "correlation" scores B0
some had them the wrong way round
June 2025 · AS Paper 2 (Further Statistics 1) · Q1(b)2 marks
Mark scheme (whole question; this part is marked with the orange bar)
Examiner's comment
(b)(i)(ii) Nearly all students were able to clearly identify the cell with the smallest expected frequency. And virtually all who did went on to correctly calculate the value of 17.5.
Key points from the mark scheme and examiner's report
smallest E is in the cell with the smallest row and column totals: online, 18 – 30
E = 50 × 105/300 = 17.5
June 2025 · AS Paper 2 (Further Statistics 1) · Q1(c)5 marks
Mark scheme (whole question; this part is marked with the orange bar)
Examiner's comment
(c) Of those realising that the given value was only part of the test statistic, most accurately calculated the value of the test statistic. The calculation of the degrees of freedom was generally correct but there were some slips in using the tables to identify the correct value of the critical value. Some, however, did not give their answer to the required accuracy (which must match or exceed the accuracy of the table values). It was pleasing to see that most conclusions to the hypothesis test were given in context.
Key points from the mark scheme and examiner's report
the given 5.060 is only part of the statistic: add (27 − 17.5)²/17.5 to get χ² = 10.2 (dividing by O scores M0)
ν = (4 − 1)(2 − 1) = 3, CV 7.815
reject H₀: association between age and shopping method
give CV to table accuracy
June 2025 · AS Paper 2 (Further Statistics 1) · Q1(d)2 marks
Mark scheme (whole question; this part is marked with the orange bar)
Examiner's comment
(d) Most identified the new critical value and realised that the conclusion of the test statistic would change. Again, some slips were seen in reading the correct column of the table for the given significance level.
Key points from the mark scheme and examiner's report
χ²₃(1%) = 11.345 > 10.2 so H₀ would not be rejected: the conclusion changes
slips reading the wrong column of the table
June 2025 · AS Paper 2 (Further Statistics 1) · Q4(a)2 marks
Mark scheme (whole question; this part is marked with the orange bar)
Examiner's comment
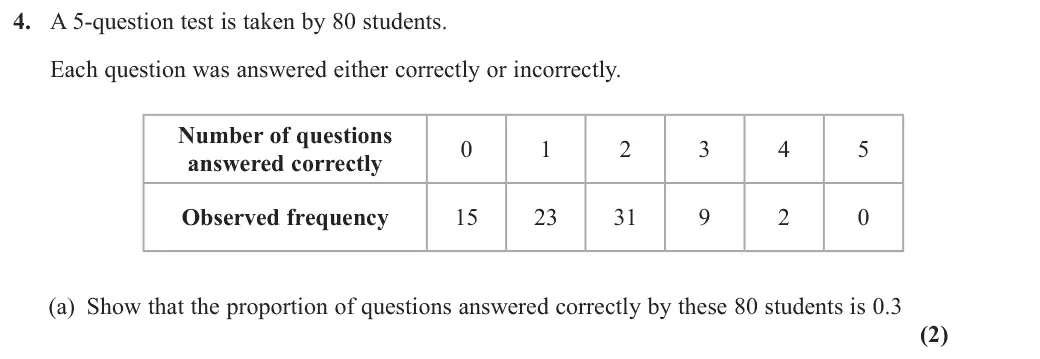
Overall, this question saw a mixed response though it was pleasing to see an improved (a) It appears that most students understand how to calculate a proportion from a frequency table, though it was not uncommon to see this part left blank. Many completed this part in one clear calculation.
Key points from the mark scheme and examiner's report
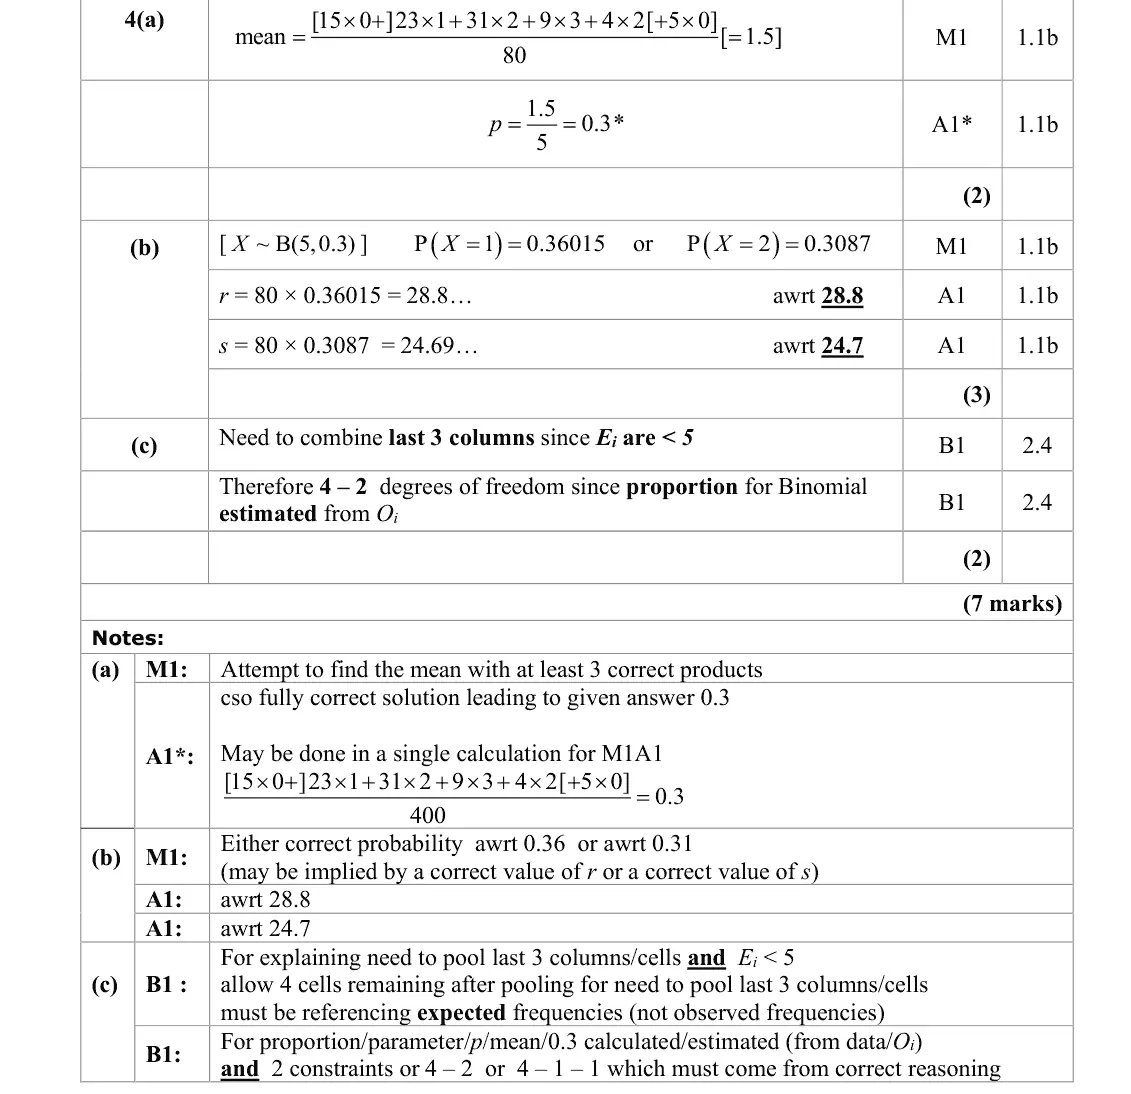
mean = Σfx/80 = 1.5
p = 1.5/5 = 0.3 (or 120/400)
part sometimes left blank
June 2025 · AS Paper 2 (Further Statistics 1) · Q4(b)3 marks
Mark scheme (whole question; this part is marked with the orange bar)
Examiner's comment
Overall, this question saw a mixed response though it was pleasing to see an improved (b) The calculation of r and s was generally well done. Some used a Poisson distribution to calculate these values and scored no marks for their attempt.
Key points from the mark scheme and examiner's report
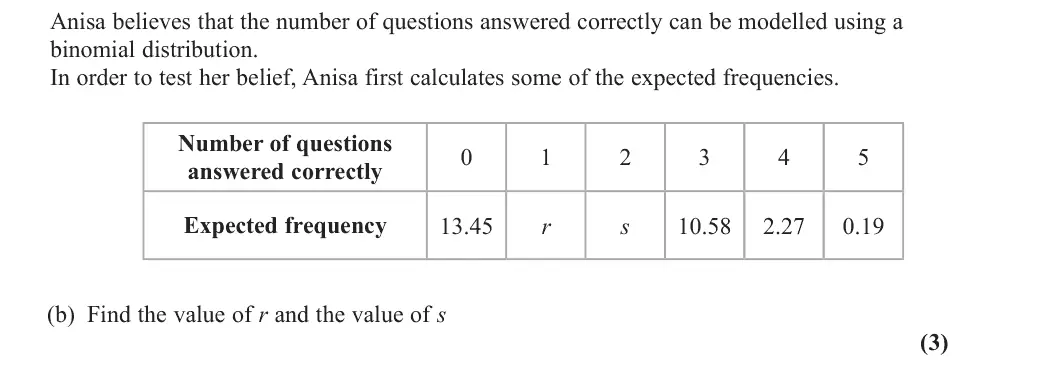
X ~ B(5, 0.3): r = 80P(X = 1) = 28.8, s = 80P(X = 2) = 24.7
Poisson users scored 0
June 2025 · AS Paper 2 (Further Statistics 1) · Q4(c)2 marks
Mark scheme (whole question; this part is marked with the orange bar)
Examiner's comment
Overall, this question saw a mixed response though it was pleasing to see an improved response to part (c) compared to previous series. (c) The attempts at the final part of this paper were promising and many earned at least one mark. The idea that the last three columns needed to be combined was generally well communicated, though, on some occasions, the word ‘expected’ was not mentioned. The idea that there were 2 degrees of freedom was not communicated as effectively. A significant number said it was because they calculated expected values for the distribution rather than the fact that the proportion was estimated using the given data.
Key points from the mark scheme and examiner's report
combine the last 3 columns because EXPECTED frequencies < 5, leaving 4 cells
2 constraints because p was estimated from the data: 4 − 2 = 2
many gave a vague reason for the second constraint
June 2025 · Paper 3B (Further Statistics 1) · Q3(a)2 marks
Mark scheme (whole question; this part is marked with the orange bar)
Examiner's comment
The context for this question posed some challenge to the candidates. However, the bulk of its demands and methods very familiar to them. As such, most candidates scored at least 7 marks out of 12 on this question. Part (a) required candidates to find expected frequencies for a contingency table, almost all candidates were able to do this successfully and score the marks.
Key points from the mark scheme and examiner's report
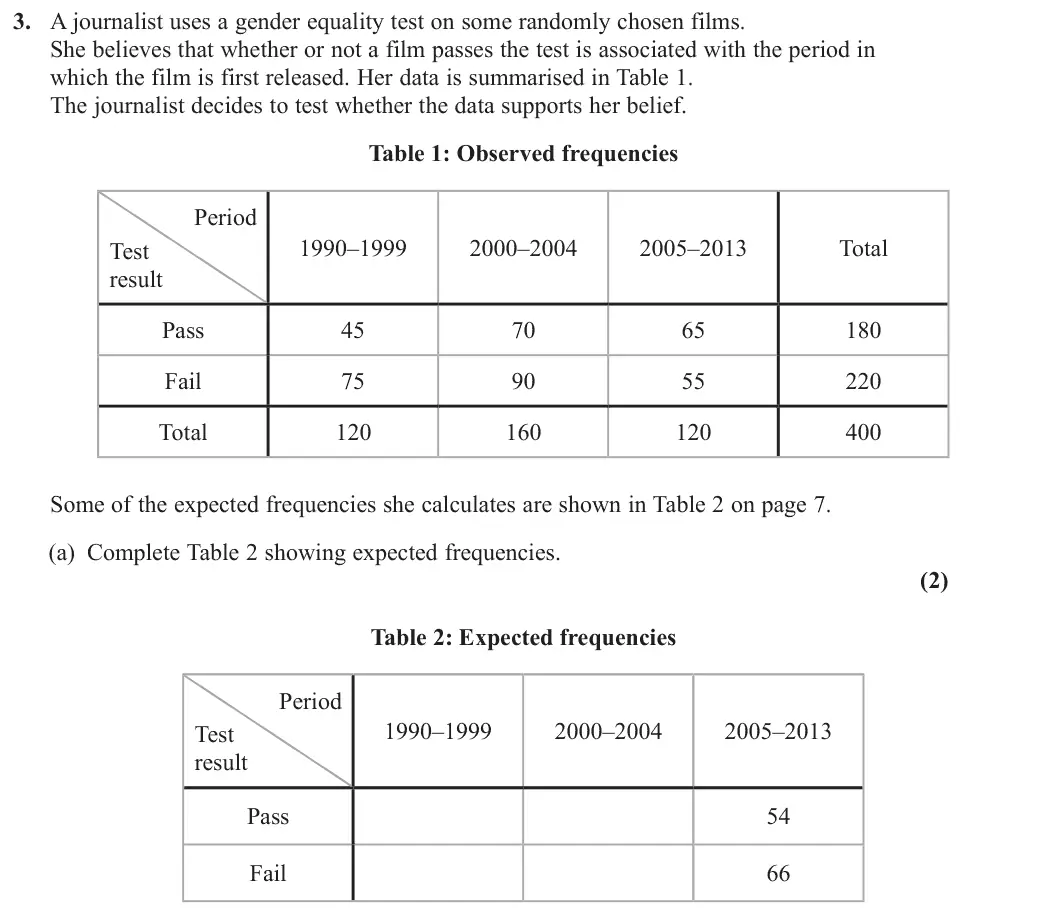
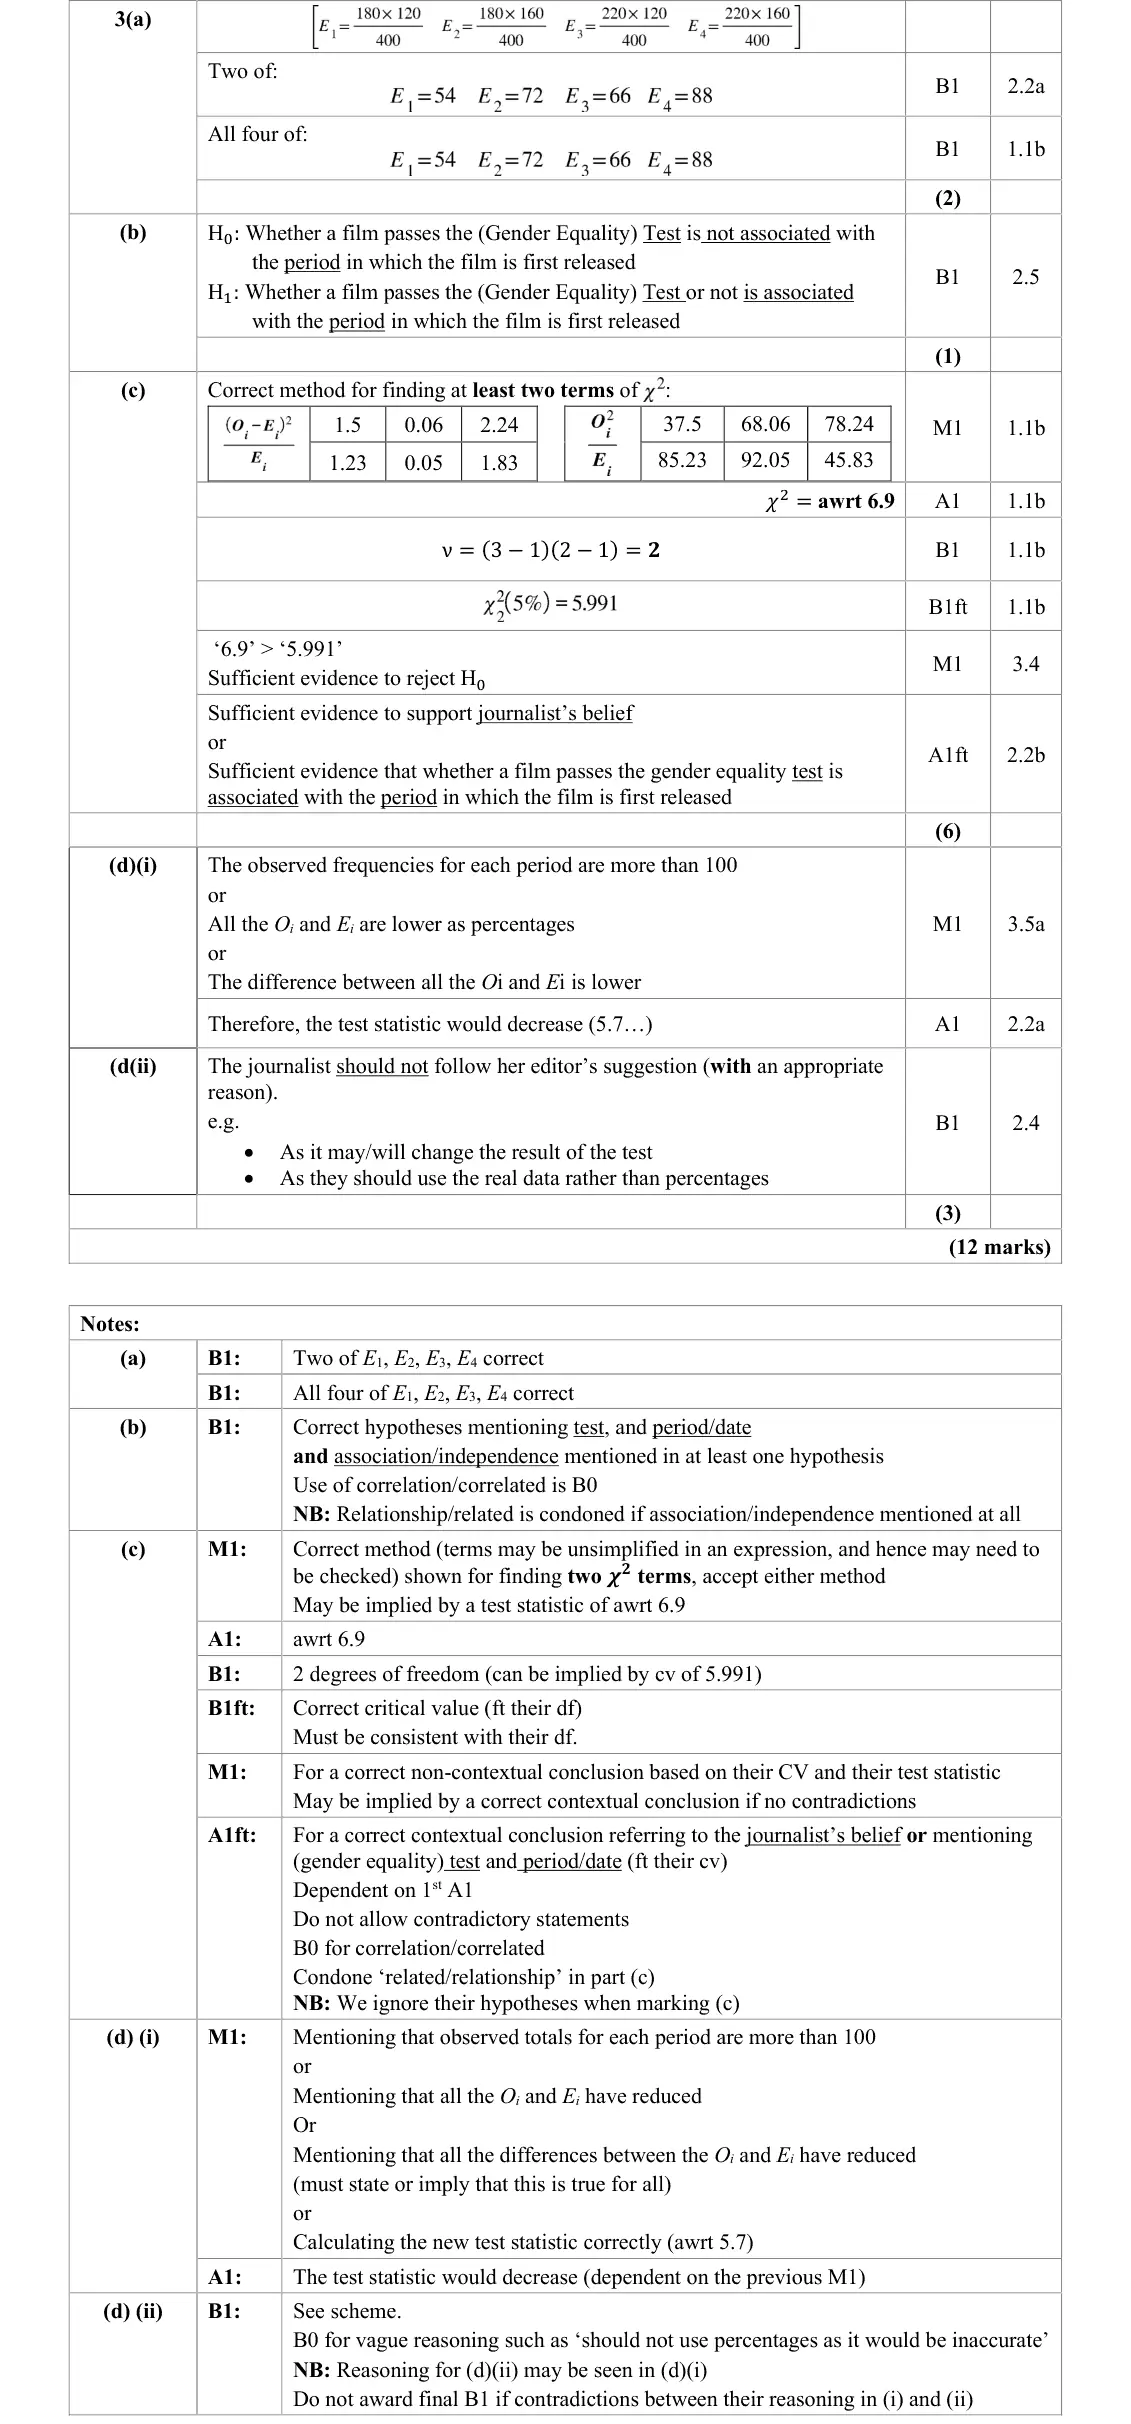
E = row total × column total / 400: 54, 72, 66, 88
June 2025 · Paper 3B (Further Statistics 1) · Q3(b)1 mark
Mark scheme (whole question; this part is marked with the orange bar)
Examiner's comment
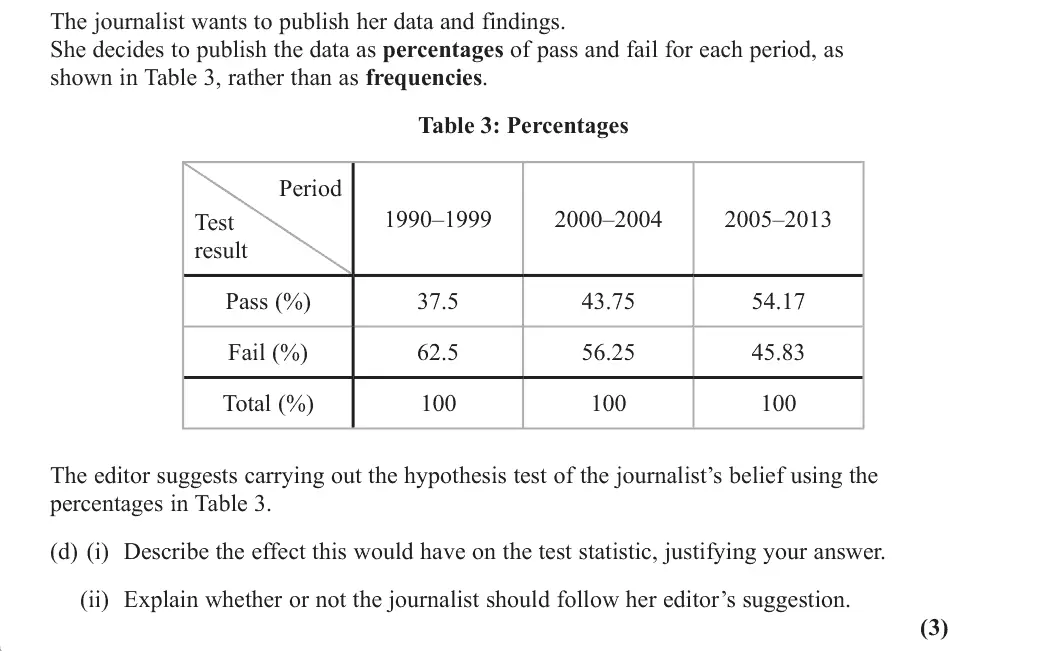
The context for this question posed some challenge to the candidates. However, the bulk of its demands and methods very familiar to them. As such, most candidates scored at least 7 marks out of 12 on this question. Part (b) required candidates to give contextual hypotheses. This is something that features in most papers of this type, and as such, most candidates gained the mark here. However, because the context was perhaps more challenging than usual, some candidates were not able to distil the key elements of the contextual situation into their hypotheses. The key words they needed were ‘period’ and ‘test’. To ensure candidates home in on these keywords, I recommend they read questions carefully, seeing which words are repeated often and used in the data tables – these are often the most important words. A small number of candidates mistakenly attached H0 to association rather than no association. A much smaller number used inappropriate wording such as correlation, relationship or link. Candidates should be advised to use association or independence for questions such as these. Most candidates were adept at calculating the test statistic and gain both marks for this. Those that did not still tended to show sufficient work to gain the method mark. Similarly, most candidates were able to correctly select 2 degrees of freedom and hence the correct critical value, with those that used an incorrect number of degrees of freedom usually gaining a follow-through mark for correctly finding the associated critical value. The mark for a correct non-contextual conclusion (based on their test statistic and critical value) was almost always gained. Showing that most candidates understand the core principles of hypothesis testing.
Key points from the mark scheme and examiner's report
H0: whether a film passes the test is not associated with the period of release
H1: is associated
must mention test and period
"correlation" is B0
June 2025 · Paper 3B (Further Statistics 1) · Q3(c)6 marks
Mark scheme (whole question; this part is marked with the orange bar)
Examiner's comment
The context for this question posed some challenge to the candidates. However, the bulk of its demands and methods very familiar to them. As such, most candidates scored at least 7 marks out of 12 on this question. The final mark for part (c) was quite often successfully gained, despite the requirements being strict. Some candidates could not access this mark as their test statistic was incorrect, others had their hypotheses inverted and concluded in line with these, some did not use sufficient context. However, on the whole candidates were strong on this part. Surprisingly few took the, probably simpler, route of concluding that there is sufficient evidence to support the journalist’s belief. Candidates need to be disciplined in maintaining the full context throughout the question, and not summarising or re-phrasing it. 3 marks of the 12 required context, so it is a key aspect.
Key points from the mark scheme and examiner's report
X² = 6.9
ν = (3 − 1)(2 − 1) = 2, cv 5.991
significant: supports the journalist's belief
keep the full context
June 2025 · Paper 3B (Further Statistics 1) · Q3(d)3 marks
Mark scheme (whole question; this part is marked with the orange bar)
Examiner's comment
The context for this question posed some challenge to the candidates. However, the bulk of its demands and methods very familiar to them. As such, most candidates scored at least 7 marks out of 12 on this question. Part (d) was the most challenging part of the whole paper. It required a deep understanding of both chi- squared testing and the context of the question. For part (d)(i), most candidates were not able to spot how changing the observed frequencies to percentages directly affected the test statistic in this case. There were a few routes the candidates could take, but most did not grasp the point, and some did but could not convey it accurately enough as a statistical argument. The simplest route to gaining marks was to re-calculate the test statistic and hence be able to state that it is lower. A calculator capable of calculating a chi-squared test statistic was particularly useful here. However, this approach was rarely taken. Very few candidates commented on the fact that the observed frequencies were all above 100, and while some recognised that the observed values being reduced would lead to a reduced test statistic, many did not appreciate the relevance of the expected values to this. There were many candidates giving irrelevant answers, many not realising the test statistic would decrease. Part (d)(ii) was a little more successfully done, with those recognising that the test statistic being lower might change the outcome of test being the most typical way to gain this mark. A smaller number were able to gain the mark by stating that it was better to use real data, but most who attempted this approach were too vague, mentioning inaccuracies or reliability. Candidates should be advised to be precise in their language and writing. For example, many stated that the test statistic would be smaller than the critical value, and while this is true, they needed to state that this would therefore change the outcome of the test to gain the mark.
Key points from the mark scheme and examiner's report
(i) each period has more than 100 observations, so percentages reduce every O and E and the statistic falls (to 5.7)
(ii) should not follow the suggestion: it changes the result, use the real frequencies
hardest part of the paper
June 2024 · AS Paper 2 (Further Statistics 1) · Q1(a)1 mark
Mark scheme (whole question; this part is marked with the orange bar)
Examiner's comment
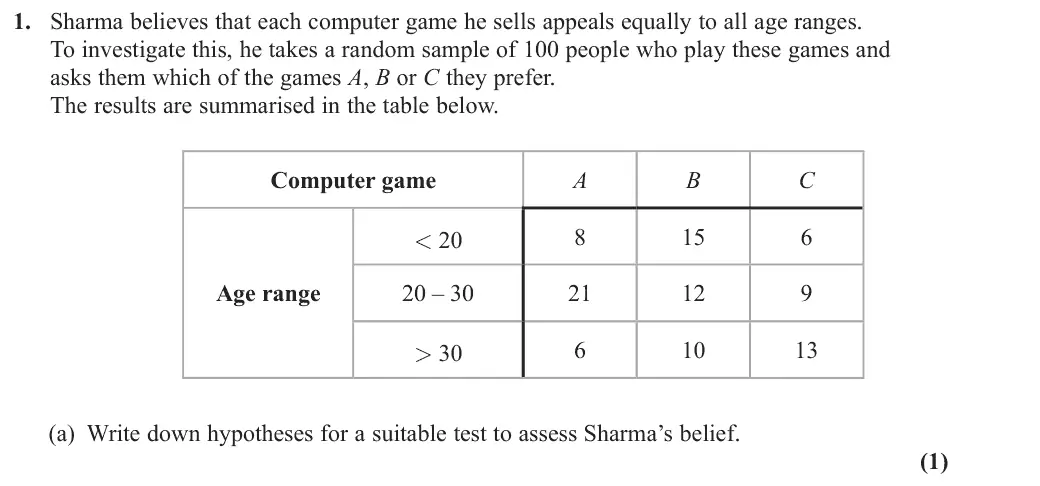
The vast majority of students made good progress in this question and answered the numerical In part (a), a large number of students had difficulty expressing the hypotheses in a correct way for a test of independence, with a simple restating of the question being the most common wrong response. Reference to correlation was also common, whilst a significant minority of responses had the hypotheses the wrong way round. Responses which scored the mark were those which referred to independence or association and were usually expressed in a clear concise way. In earned this than the mark in (a). Some students lost this mark by confusing the test statistic and the critical value and so drawing an incorrect conclusion, because their initial hypotheses were reversed, or because their conclusion contained contradictions. Many misinterpreted that rejecting H0 meant that games were preferred equally by all age groups.
Key points from the mark scheme and examiner's report
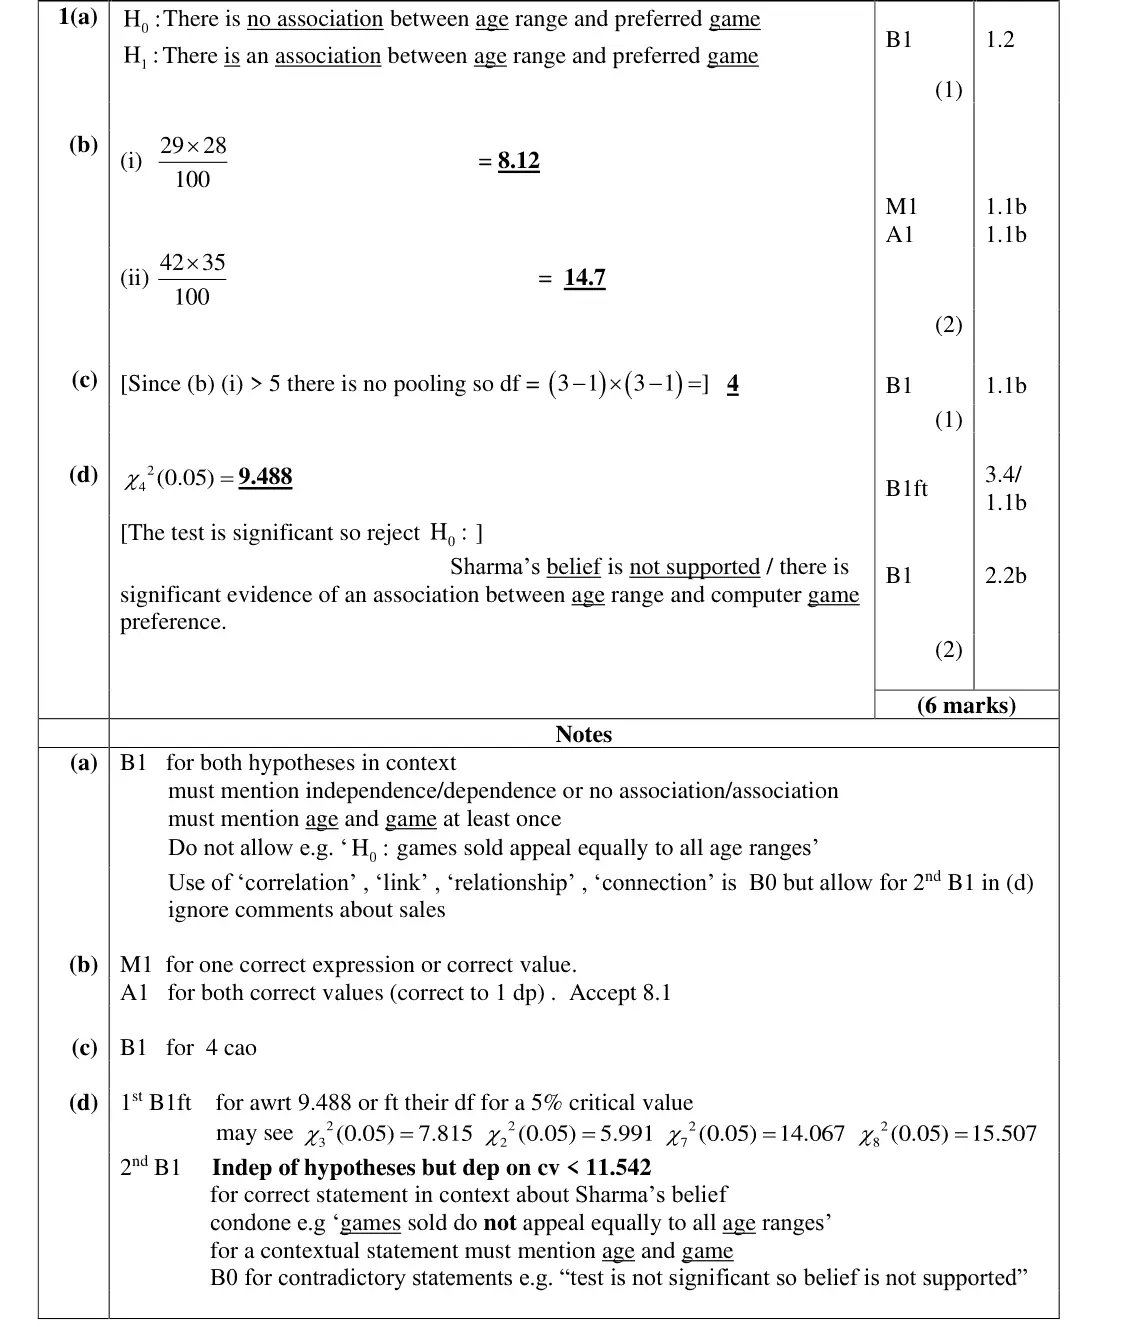
H₀: no association between age range and preferred game, H₁: association
must mention age and game
restating the belief, "correlation" or reversed hypotheses lost the mark
June 2024 · AS Paper 2 (Further Statistics 1) · Q1(b)2 marks
Mark scheme (whole question; this part is marked with the orange bar)
Examiner's comment
The vast majority of students made good progress in this question and answered the numerical sections accurately, securing full marks on (b), and (c). Occasional method errors in (b) usually involved some sort of average of the 3 observed frequencies. In (d), the correct critical value
Key points from the mark scheme and examiner's report
row total × column total ÷ 100: (i) 29 × 28/100 = 8.12, (ii) 42 × 35/100 = 14.7
rare errors averaged observed frequencies
June 2024 · AS Paper 2 (Further Statistics 1) · Q1(c)1 mark
Mark scheme (whole question; this part is marked with the orange bar)
Examiner's comment
The vast majority of students made good progress in this question and answered the numerical sections accurately, securing full marks on (b), and (c). Occasional method errors in (b) usually involved some sort of average of the 3 observed frequencies. In (d), the correct critical value
Key points from the mark scheme and examiner's report
smallest E is 8.12 > 5 so no pooling: ν = (3 − 1)(3 − 1) = 4
June 2024 · AS Paper 2 (Further Statistics 1) · Q1(d)2 marks
Mark scheme (whole question; this part is marked with the orange bar)
Examiner's comment
The vast majority of students made good progress in this question and answered the numerical involved some sort of average of the 3 observed frequencies. In (d), the correct critical value was stated in almost all responses, although a small number of students lost a mark for not giving this value to the required degree of accuracy as specified on the front of the examination paper. It was rare for students to select the wrong critical value for their stated degree of freedom. part (d), the statement of the conclusion could use less specific phraseology and so more students earned this than the mark in (a). Some students lost this mark by confusing the test statistic and
Key points from the mark scheme and examiner's report
χ²₄(5%) = 9.488
11.542 > 9.488, reject H₀: association between age range and game preference, so Sharma's belief is not supported
some misread rejecting H₀ as supporting the belief
June 2024 · AS Paper 2 (Further Statistics 1) · Q4(a)2 marks
Mark scheme (whole question; this part is marked with the orange bar)
Examiner's comment
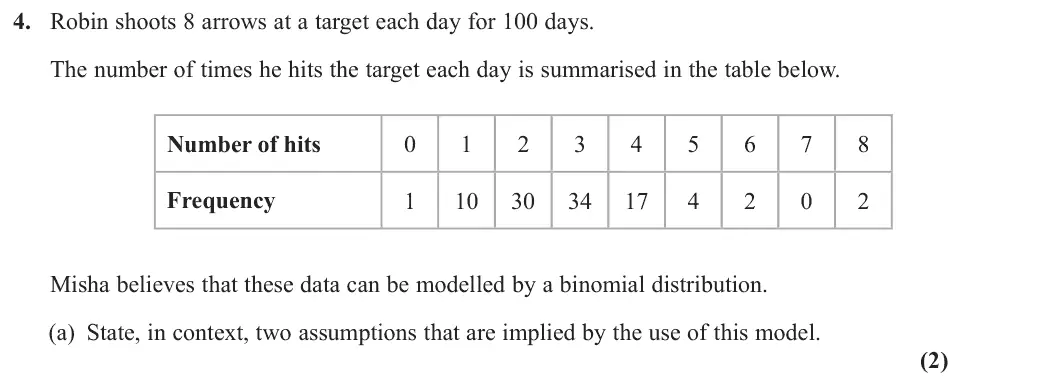
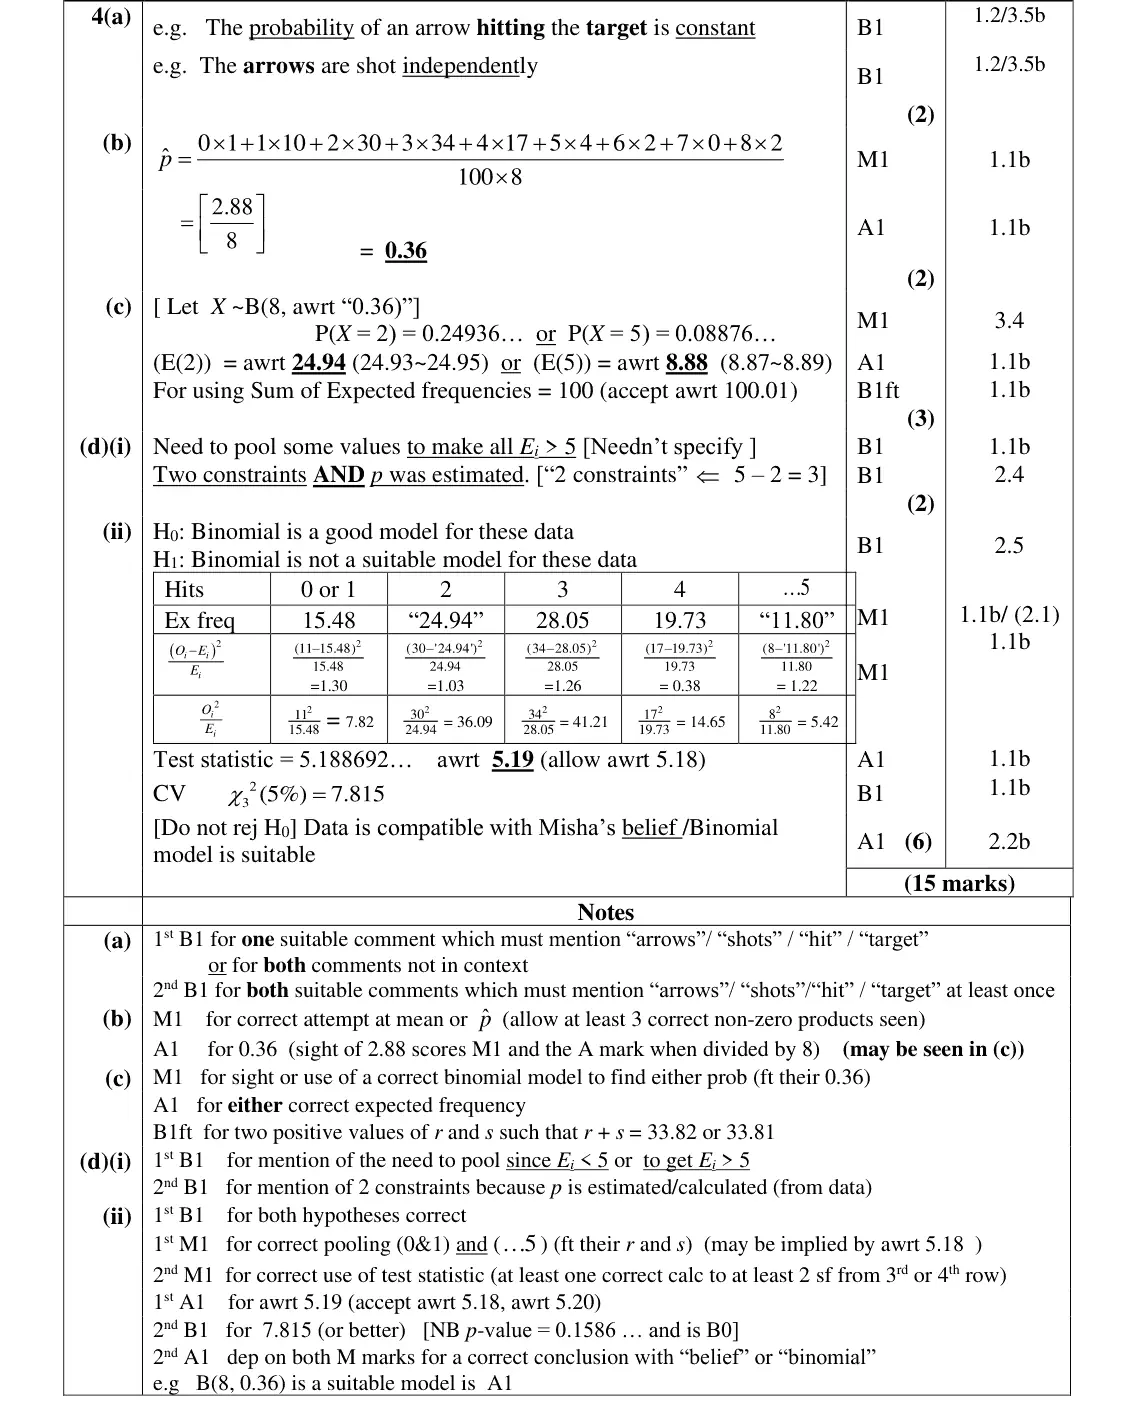
This question tested all aspects of goodness of fits tests and many were able to make some headway with parts (a) and (d) providing discrimination at the top end. In part (a) most students were able to score 1 out of 2 marks. Those who scored only 1 mark were able to explain that the probability of the arrow hitting the target was constant or by giving two comments not in context mentioning the key words. The concept of independence was not well understood and there were few comments that explained this concept and quite a significant number of explanations talked about the probabilities being independent and not referring to the ‘hits,’ ‘shots’ , ‘arrow being shot.’ A significant number of scripts could not use the mathematical language, such as ‘probability’ and ‘independence’ in their answers and often gave an explanation which implied these and so could pick up 1 mark.
Key points from the mark scheme and examiner's report
in context: the probability of an arrow hitting the target is constant
the shots (hits) are independent
"probabilities are independent" not accepted
June 2024 · AS Paper 2 (Further Statistics 1) · Q4(b)2 marks
Mark scheme (whole question; this part is marked with the orange bar)
Examiner's comment
This question tested all aspects of goodness of fits tests and many were able to make some headway Part (b) was a successful part of the question with most scoring full marks, though we allowed the mark to be picked up in part (c) for those only calculating the mean in this part but who went on
Key points from the mark scheme and examiner's report
mean hits per day = 288/100 = 2.88
p̂ = 2.88/8 = 0.36
error dividing by 100 instead of 800
June 2024 · AS Paper 2 (Further Statistics 1) · Q4(c)3 marks
Mark scheme (whole question; this part is marked with the orange bar)
Examiner's comment
This question tested all aspects of goodness of fits tests and many were able to make some headway mark to be picked up in part (c) for those only calculating the mean in this part but who went on to use 0.36 in the subsequent work. The reason for losing a mark here was a mistake made in calculating the expectation or by dividing by 100 and not 800. Again in part (c) many good solution were seen with most students picking up full marks. Those that did not earn full marks, made errors like: • choosing a Poisson model and then using it throughout the question • correctly choosing a binomial model (so earning the first two marks) and then going to use a Poisson Approximation to work out the expected values • giving values that were outside either of the ranges • the sum of their expectations did not add up to 100 or awrt 100.01
Key points from the mark scheme and examiner's report
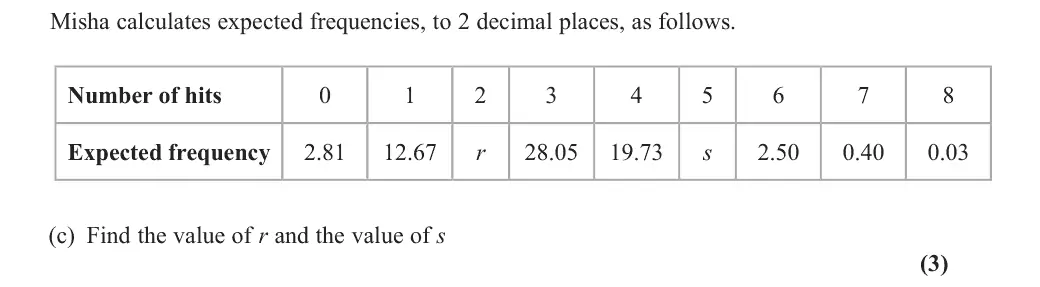
X ~ B(8, 0.36): r = 100P(X = 2) = 24.94, s = 100P(X = 5) = 8.88 (r + s = 33.82 from total 100)
errors: using a Poisson model
June 2024 · AS Paper 2 (Further Statistics 1) · Q4(d)(i)2 marks
Mark scheme (whole question; this part is marked with the orange bar)
Examiner's comment
This question tested all aspects of goodness of fits tests and many were able to make some headway with parts (a) and (d) providing discrimination at the top end. In part (a) most students were able to score 1 out of 2 marks. Those who scored only 1 mark were able to explain that the probability of the arrow hitting the target was constant or by giving two comments not in context mentioning the key words. The concept of independence was not well understood and there were few comments that explained this concept and quite a significant number of explanations talked about the probabilities being independent and not referring to the ‘hits,’ ‘shots’ , ‘arrow being shot.’ A significant number of scripts could not use the mathematical language, such as ‘probability’ and ‘independence’ in their answers and often gave an explanation which implied these and so could pick up 1 mark. Part (d)(i) saw a mixed response with most students picking up 1 of the two marks. Errors made were: • not being specific enough and saying that it was the expected values being pooled as the Ei<5 or needed to be such that all Ei>5 • referring only to frequencies, rather than expected frequencies • referring to 2 constraints but not explaining what they were • combining more cells than necessary to arrive at 3 degrees of freedom Many took the clue from the degrees of freedom given and were able to make a good start at part
Key points from the mark scheme and examiner's report
pool 0 & 1 and 5 to 8 so all E > 5, leaving 5 classes
2 constraints because p was estimated from the data: 5 − 2 = 3
June 2024 · AS Paper 2 (Further Statistics 1) · Q4(d)(ii)6 marks
Mark scheme (whole question; this part is marked with the orange bar)
Examiner's comment
This question tested all aspects of goodness of fits tests and many were able to make some headway (d)(ii). This was a good discriminator with more able students able to pick up most marks. Less highly performing students were still able to earn the mark for finding the correct critical value. The main reasons for losing marks in the question were: • stating hypotheses incorrectly either ‘having them the wrong way round’ or referring to p = 0.36 • incorrectly pooling either ‘0 and 1’ or ‘5,6,7 and 8’ or not showing these clearly enough 2 2 (𝑂𝑂𝑖𝑖-𝐸𝐸𝑖𝑖) 𝑂𝑂𝑖𝑖 • not pooling ‘0 and 1’ 𝐸𝐸𝑖𝑖 𝐸𝐸𝑖𝑖 • mistakes in or values, having them the wrong way round or not giving enough accuracy • writing down an incorrect value of the test statistic with no supporting working
Key points from the mark scheme and examiner's report
H₀: binomial is a suitable model (not p = 0.36)
pooled O: 11, 30, 34, 17, 8 vs E: 15.48, 24.94, 28.05, 19.73, 11.80
χ² = 5.19
CV χ²₃(5%) = 7.815
not significant: binomial model is suitable
errors in pooling (or not pooling 0 and 1)
June 2024 · Paper 3B (Further Statistics 1) · Q3(a)1 mark
Mark scheme (whole question; this part is marked with the orange bar)
Examiner's comment
(a).
Key points from the mark scheme and examiner's report
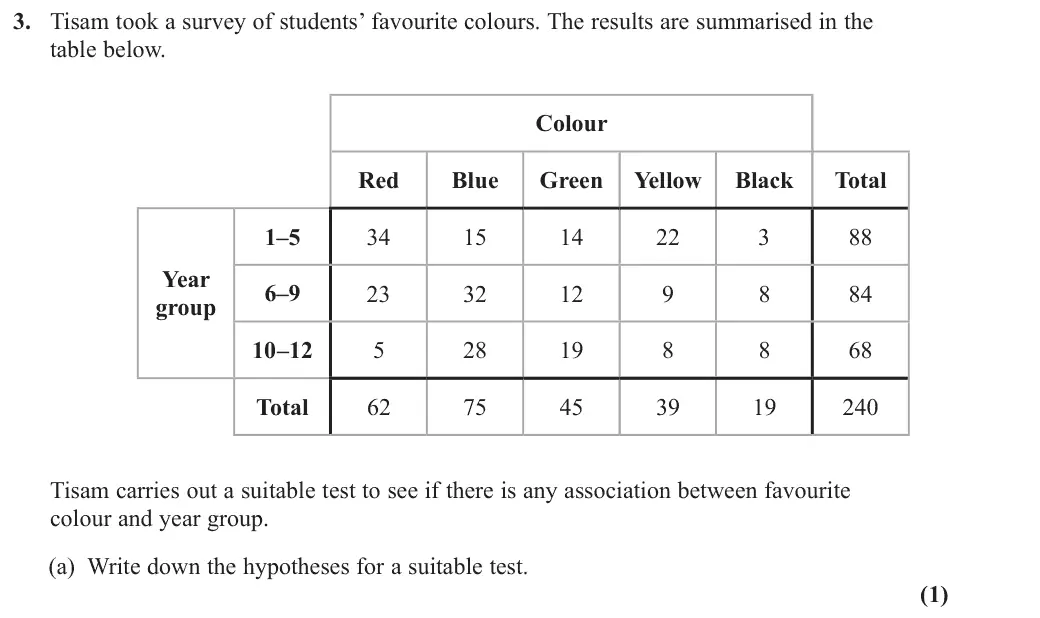
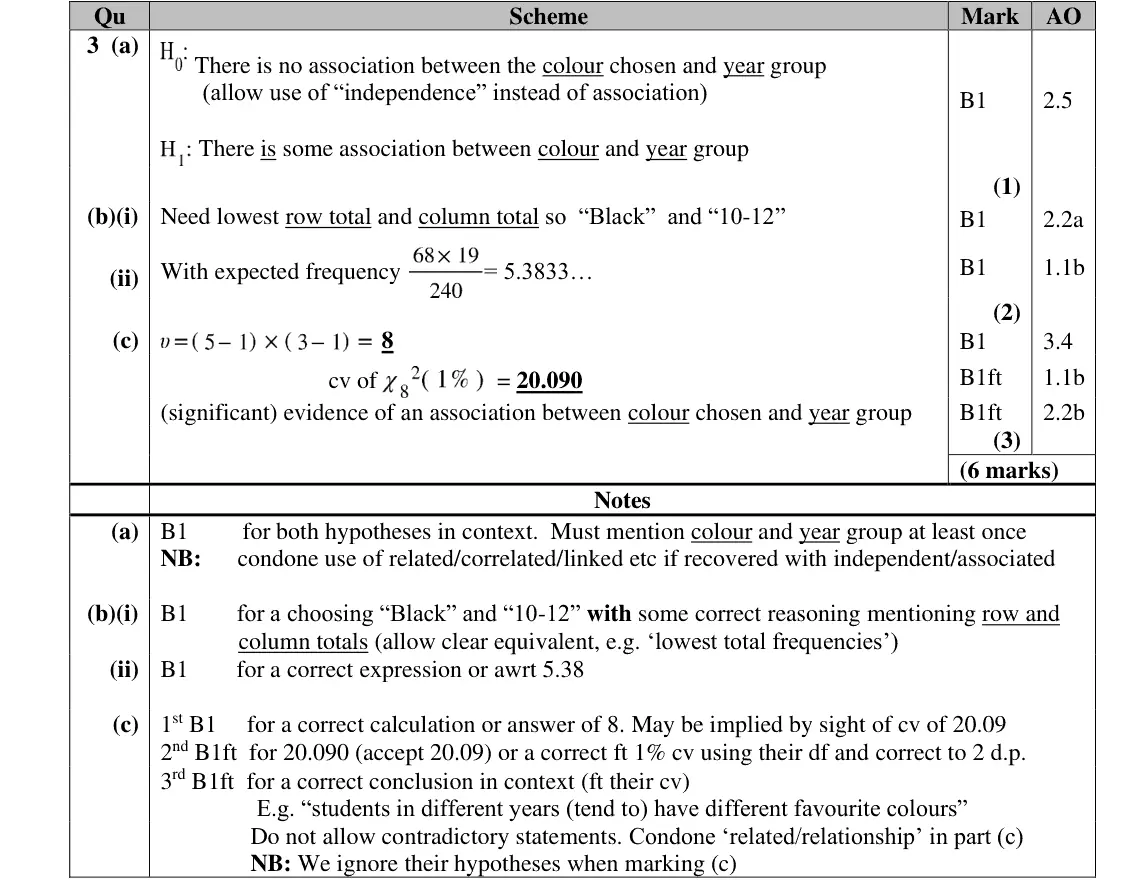
H0: no association between colour and year group, H1: association
in context
some reversed H0 and H1
June 2024 · Paper 3B (Further Statistics 1) · Q3(b)2 marks
Mark scheme (whole question; this part is marked with the orange bar)
Examiner's comment
Part (b) did make the candidates think a little. Most still gave the correct answer, perhaps through understanding or perhaps through calculating the expected frequencies and choosing the lowest. Most also gave an acceptable reason. The most common incorrect answer was to select ‘Black’ and ‘1 – 5’, as the observed frequency is lowest. Almost all candidates were able to correctly find the value of an expected frequency, therefore, if they selected the correct cell candidates tended to gain the second mark in (b) as well. Almost all candidates gave the correct degrees of freedom and critical value. The few that gave incorrect degrees of freedom tended to state 14 (using 15 – 1 = 14). However, the vast majority still gained the second B1 for following through to give a correct critical value. The final B1 did not depend on anything previous. That is, it was independent of the candidate’s hypotheses, and followed through their critical value. As all incorrect critical values seen still led to the same conclusion, this allowed candidates to recover from any errors and to show their knowledge. The majority of candidates were able to give a suitable conclusion and score the final mark, showing that candidates are in general practised and adept at giving conclusions in context.
Key points from the mark scheme and examiner's report
smallest expected frequency comes from the lowest row and column totals: Black, 10–12
E = 68 × 19/240 = 5.38
choosing the smallest observed cell (Black, 1–5) was the common error
June 2024 · Paper 3B (Further Statistics 1) · Q3(c)3 marks
Mark scheme (whole question; this part is marked with the orange bar)
Examiner's comment
This question was perhaps the one that caused candidates the most issues of all the early questions in the paper. Some candidates were not able to state the hypotheses correctly. The most common error being to give H0 as ‘association’ instead of ‘no association’. This is not an error usually seen. Association was used most, but independence was also seen a lot – both scoring the mark in
Key points from the mark scheme and examiner's report
ν = (5 − 1)(3 − 1) = 8, cv 20.090 at 1%
38.449 significant: evidence of an association between colour and year group
15 − 1 = 14 seen
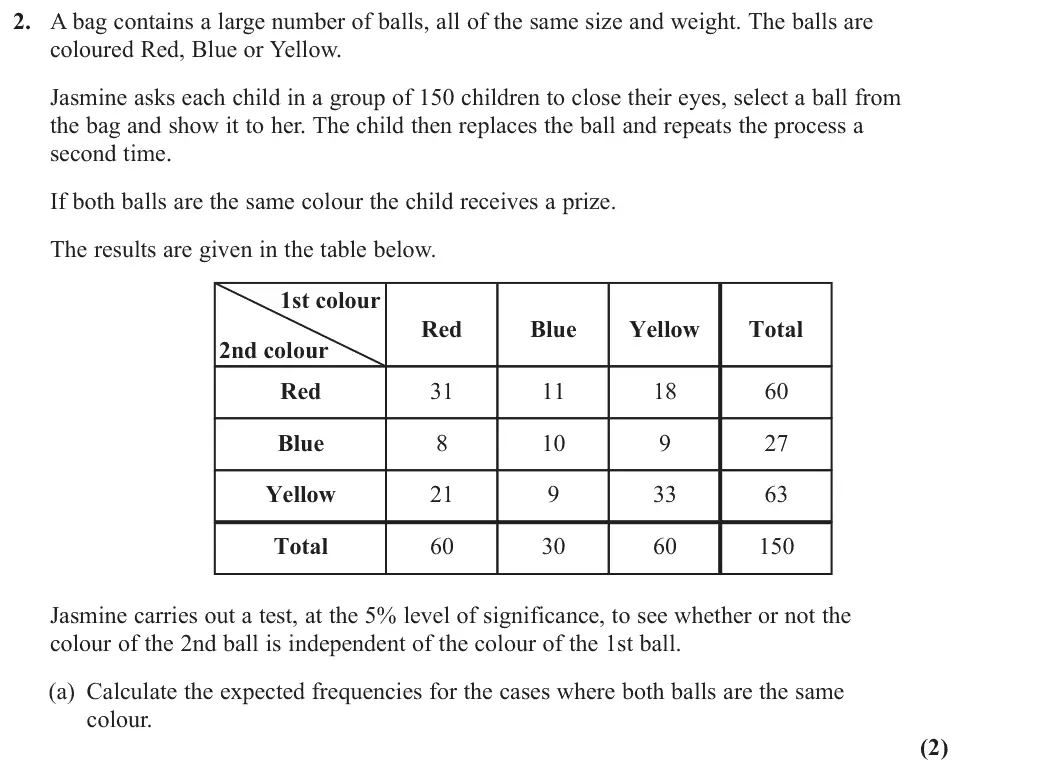
June 2023 · AS Paper 2 (Further Statistics 1) · Q2(a)2 marks
Mark scheme (whole question; this part is marked with the orange bar)
Examiner's comment
The vast majority of candidates were confident in calculating the expected frequencies, and as such were able to get off to a good start with this question. The vast majority of candidates then went on to use the correct degrees of freedom to find a correct critical value. The final two marks were more challenging to obtain. The final mark of (b) required the candidates to mention ‘colour’ as well as ‘not independent’ (o.e.); a good number failed to meet
Key points from the mark scheme and examiner's report
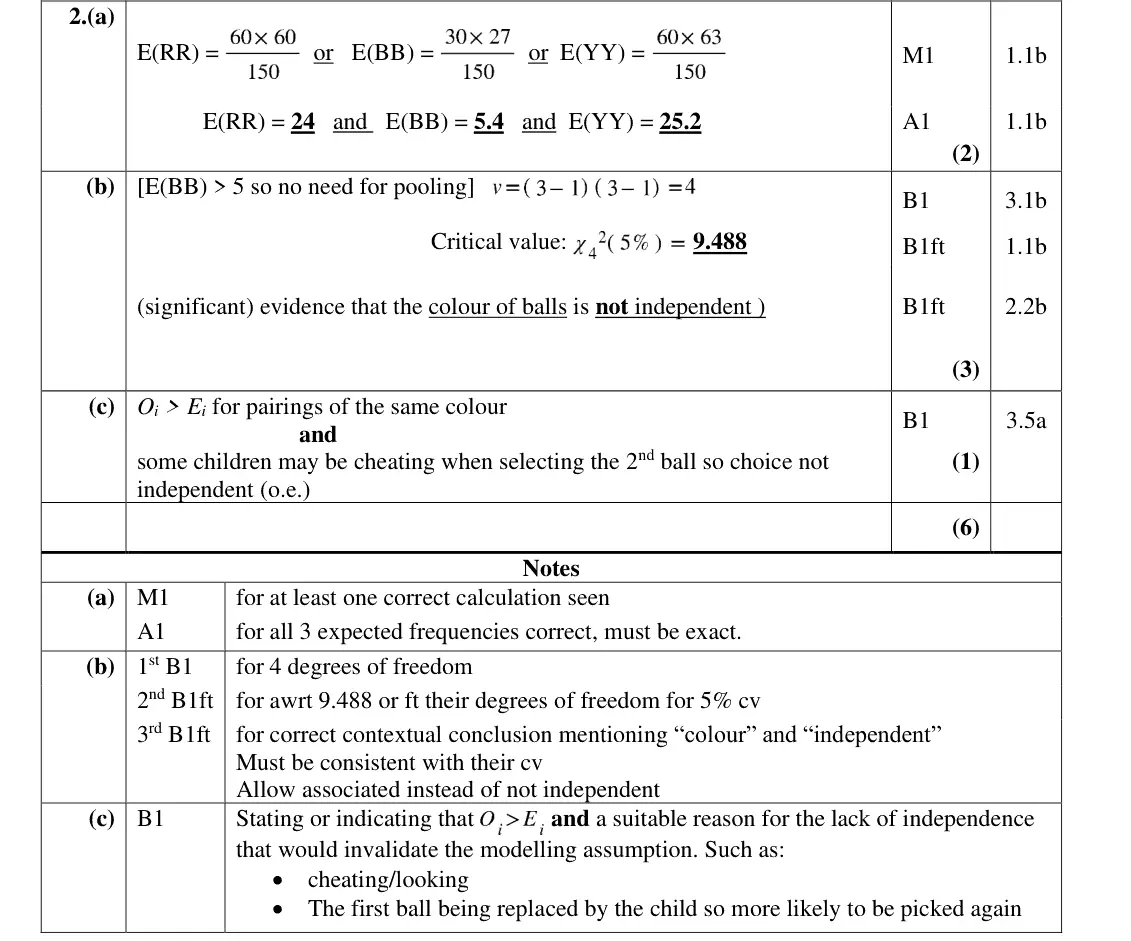
E = row total × column total ÷ 150: E(RR) = 24, E(BB) = 5.4, E(YY) = 25.2 (exact)
hypotheses and all nine expected frequencies were not required and wasted time
June 2023 · AS Paper 2 (Further Statistics 1) · Q2(b)3 marks
Mark scheme (whole question; this part is marked with the orange bar)
Examiner's comment
The vast majority of candidates were confident in calculating the expected frequencies, and as such were able to get off to a good start with this question. The vast majority of candidates then went on to use the correct degrees of freedom to find a correct critical value. The final two marks were more challenging to obtain. The final mark of (b) required the candidates to mention ‘colour’ as well as ‘not independent’ (o.e.); a good number failed to meet
Key points from the mark scheme and examiner's report
all E ≥ 5 (5.4) so no pooling: ν = (3 − 1)(3 − 1) = 4, CV 9.488
12.712 > 9.488, significant: colour of the 2nd ball is not independent of the 1st
conclusion must mention colour and independence
June 2023 · AS Paper 2 (Further Statistics 1) · Q2(c)1 mark
Mark scheme (whole question; this part is marked with the orange bar)
Examiner's comment
both of these criteria. The B1 in (c) was seldom gained by candidates. Again, this required two criteria and most candidates only mentioned one, thus failing to gain this mark. This was a very useful question as it was accessible to all, but the final two marks discriminated well and provided a high level of challenge. The slightly unusual structure of this question was found to be challenging for many. Many candidates found all nine expected frequencies and/or the hypotheses. Neither of these were required and hence candidates finding these wasted a lot of their time, which may have had an impact on the rest of the paper.
Key points from the mark scheme and examiner's report
needs both: O > E for same-colour pairs, and a reason the draws are not independent (children peeking or cheating to win the prize)
seldom gained as most gave only one point
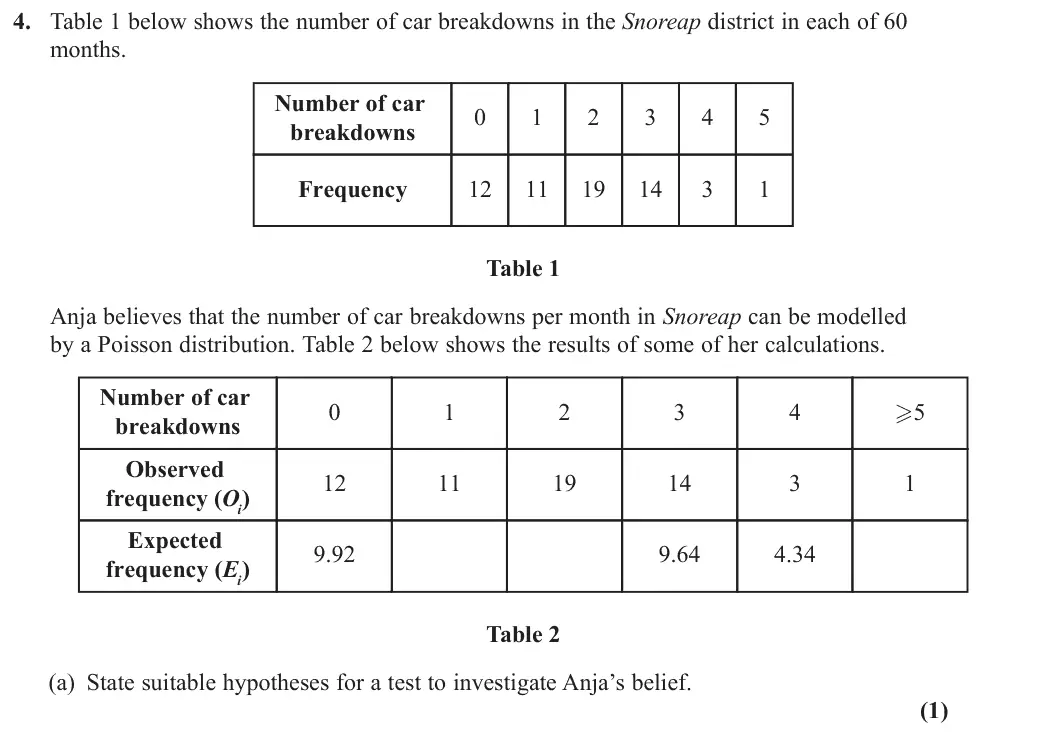
June 2023 · AS Paper 2 (Further Statistics 1) · Q4(a)1 mark
Mark scheme (whole question; this part is marked with the orange bar)
Examiner's comment
This was quite a challenging question, and whilst most candidates scored eight or more marks out of twelve many really struggled. The worded answers required were quite nuanced and specific, and if a candidate was unable to find a value of lambda they were only able to gain half the marks. This is not unreasonable for the final question of a paper, but it did put a distinct divide between higher and lower ability candidates. Part (a) required the candidates to give hypotheses mentioning ‘breakdowns’ and ‘Poisson’. A large number failed to meet both of these criteria. This is perhaps an issue of exam technique as if they read the question carefully it clearly mentions both of these points when describing Anya’s belief and the direction in part (a) refers directly to Anya’s belief. A further issue was that candidates gave the value of lambda in their hypotheses, which meant they did not gain the mark. This was unfortunate as often stating the value of a parameter is required. Once again, good exam technique dictates that this was not appropriate here as the candidate had not been asked to find a value of lambda at this stage of the question.
Key points from the mark scheme and examiner's report
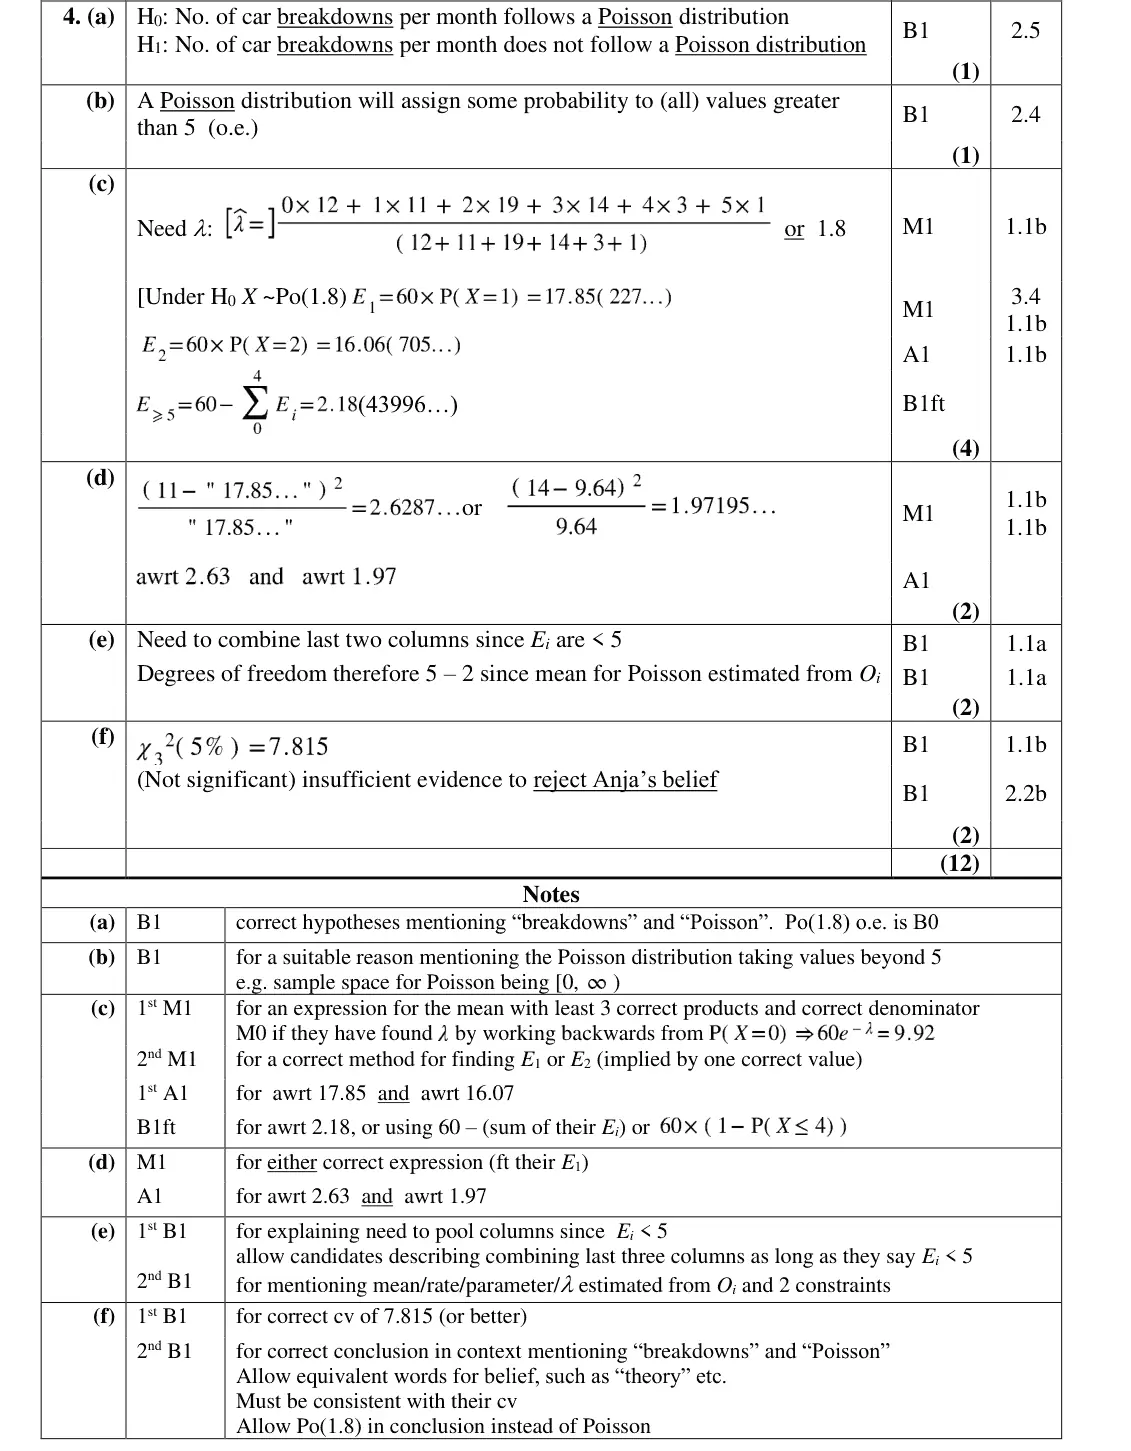
H₀: number of car breakdowns per month can be modelled by a Poisson distribution
must mention breakdowns and Poisson
giving Po(1.8) in H₀ scores B0 (λ is to be estimated)
June 2023 · AS Paper 2 (Further Statistics 1) · Q4(b)1 mark
Mark scheme (whole question; this part is marked with the orange bar)
Examiner's comment
This was quite a challenging question, and whilst most candidates scored eight or more marks out of twelve many really struggled. The worded answers required were quite nuanced and specific, and if a candidate was unable to find a value of lambda they were only able to gain half the marks. This is not unreasonable for the final question of a paper, but it did put a distinct divide between higher and lower ability candidates. Part (b) was seldom answered correctly. Most candidates gave a contextual answer linking to the problem itself rather than the Poisson distribution. The question did not direct the candidates to such an answer, but this part was an excellent way to challenge the most able candidates.
Key points from the mark scheme and examiner's report
a Poisson distribution gives non-zero probability to all values above 5 (sample space 0, 1, 2, …)
contextual answers scored 0
seldom correct
June 2023 · AS Paper 2 (Further Statistics 1) · Q4(c)4 marks
Mark scheme (whole question; this part is marked with the orange bar)
Examiner's comment
This was quite a challenging question, and whilst most candidates scored eight or more marks out of twelve many really struggled. The worded answers required were quite nuanced and specific, and if a candidate was unable to find a value of lambda they were only able to gain half the marks. This is not unreasonable for the final question of a paper, but it did put a distinct divide between higher and lower ability candidates. Part (c) hinged on the candidate realising they had to find the value of lambda from the data, which is an entirely reasonable demand as it should be clear that this was needed to progress. Most candidates were able to gain the majority of the marks by finding a mean and using the Poisson distribution to calculate the frequencies. The final mark was often gained, showing candidates knew to calculate the final expected frequency in such a way to ensure the sum of the expected frequencies matched the sum of the observed frequencies. A fair few candidates obtained lambda by working backwards from a given expected frequency. Candidates who did this well could still gain three out of four marks for this question. Once a candidate did get started with part (c) the most common errors were failing to keep a suitable level of accuracy and consequently obtaining inaccurate expected frequencies, and not giving their answers to a level of accuracy matching the other expected frequencies.
Key points from the mark scheme and examiner's report
estimate λ = Σfx/60 = 1.8 (not by working back from 9.92)
E₁ = 60P(X = 1) = 17.85, E₂ = 16.07
E(≥5) = 60 − ΣEᵢ = 2.18
June 2023 · AS Paper 2 (Further Statistics 1) · Q4(d)2 marks
Mark scheme (whole question; this part is marked with the orange bar)
Examiner's comment
This was quite a challenging question, and whilst most candidates scored eight or more marks out of twelve many really struggled. The worded answers required were quite nuanced and specific, and if a candidate was unable to find a value of lambda they were only able to gain half the marks. This is not unreasonable for the final question of a paper, but it did put a distinct divide between higher and lower ability candidates. Part (d) allowed candidates who had not attempted part (c) to gain one of the two marks. Most candidates therefore scored one mark if they had not completed part (c) or had done so with a low degree of accuracy. If a candidate had successfully completed part (c) they almost always gained both marks in (d).
Key points from the mark scheme and examiner's report
June 2023 · AS Paper 2 (Further Statistics 1) · Q4(e)2 marks
Mark scheme (whole question; this part is marked with the orange bar)
Examiner's comment
This was quite a challenging question, and whilst most candidates scored eight or more marks out of twelve many really struggled. The worded answers required were quite nuanced and specific, and if a candidate was unable to find a value of lambda they were only able to gain half the marks. This is not unreasonable for the final question of a paper, but it did put a distinct divide between higher and lower ability candidates. Part (e) required the candidates to demonstrate a good understanding of the degrees of freedom used in chi-squared and also communicate this understanding accurately with a high level of specificity. Most candidates gained the first B1 for describing the need to merge columns, however, a good number failed to refer to expected frequencies specifically and fell short of this mark. The second mark was largely independent of the first and a large number of candidates were able to successfully describe the lost degree of freedom for estimating lambda to end up on three degrees of freedom. Again, a good number failed to be specific enough for this last mark – instead referring to estimating in general or estimating totals/probabilities.
Key points from the mark scheme and examiner's report
combine the last two columns because expected frequencies < 5 (must say expected)
5 classes − 2 constraints since λ was estimated from the data: ν = 3
June 2023 · AS Paper 2 (Further Statistics 1) · Q4(f)2 marks
Mark scheme (whole question; this part is marked with the orange bar)
Examiner's comment
This was quite a challenging question, and whilst most candidates scored eight or more marks out of twelve many really struggled. The worded answers required were quite nuanced and specific, and if a candidate was unable to find a value of lambda they were only able to gain half the marks. This is not unreasonable for the final question of a paper, but it did put a distinct divide between higher and lower ability candidates. Part (f) was able to be done fully independently of the rest of the question. As such, most candidates were able to give the correct critical value, though some failed to give it to the required level of accuracy. Many candidates failed to give an acceptable conclusion, usually by failing to mention ‘breakdowns’. As with part (e) of question 3, most candidates attempted to give a full contextual conclusion mentioning breakdowns and Poisson, perhaps missing the simpler approach of stating that we accept Anya’s belief.
Key points from the mark scheme and examiner's report
χ²₃(5%) = 7.815
6.54 < 7.815, not significant: number of breakdowns can be modelled by a Poisson distribution
many omitted "breakdowns"
June 2023 · Paper 3B (Further Statistics 1) · Q3(a)3 marks
Mark scheme (whole question; this part is marked with the orange bar)
Examiner's comment
There were a large number of accessible marks on this question for all students but the written expression required in part (e) allowed higher achieving pupils to shine. Part (a) was answered extremely well, with the vast majority of candidates scoring full marks by multiplying the required probabilities by 170. Some slips saw students multiplying by 100 instead.
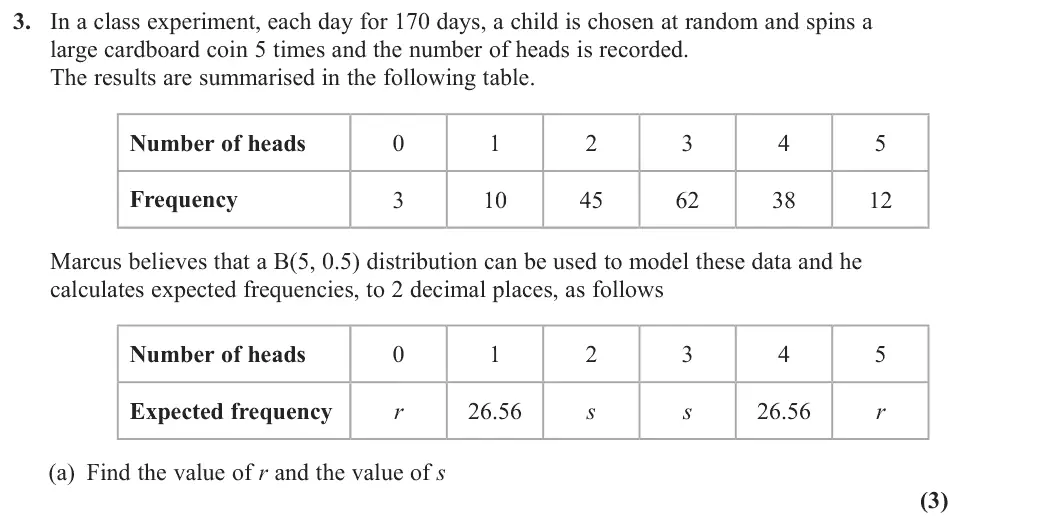
Key points from the mark scheme and examiner's report
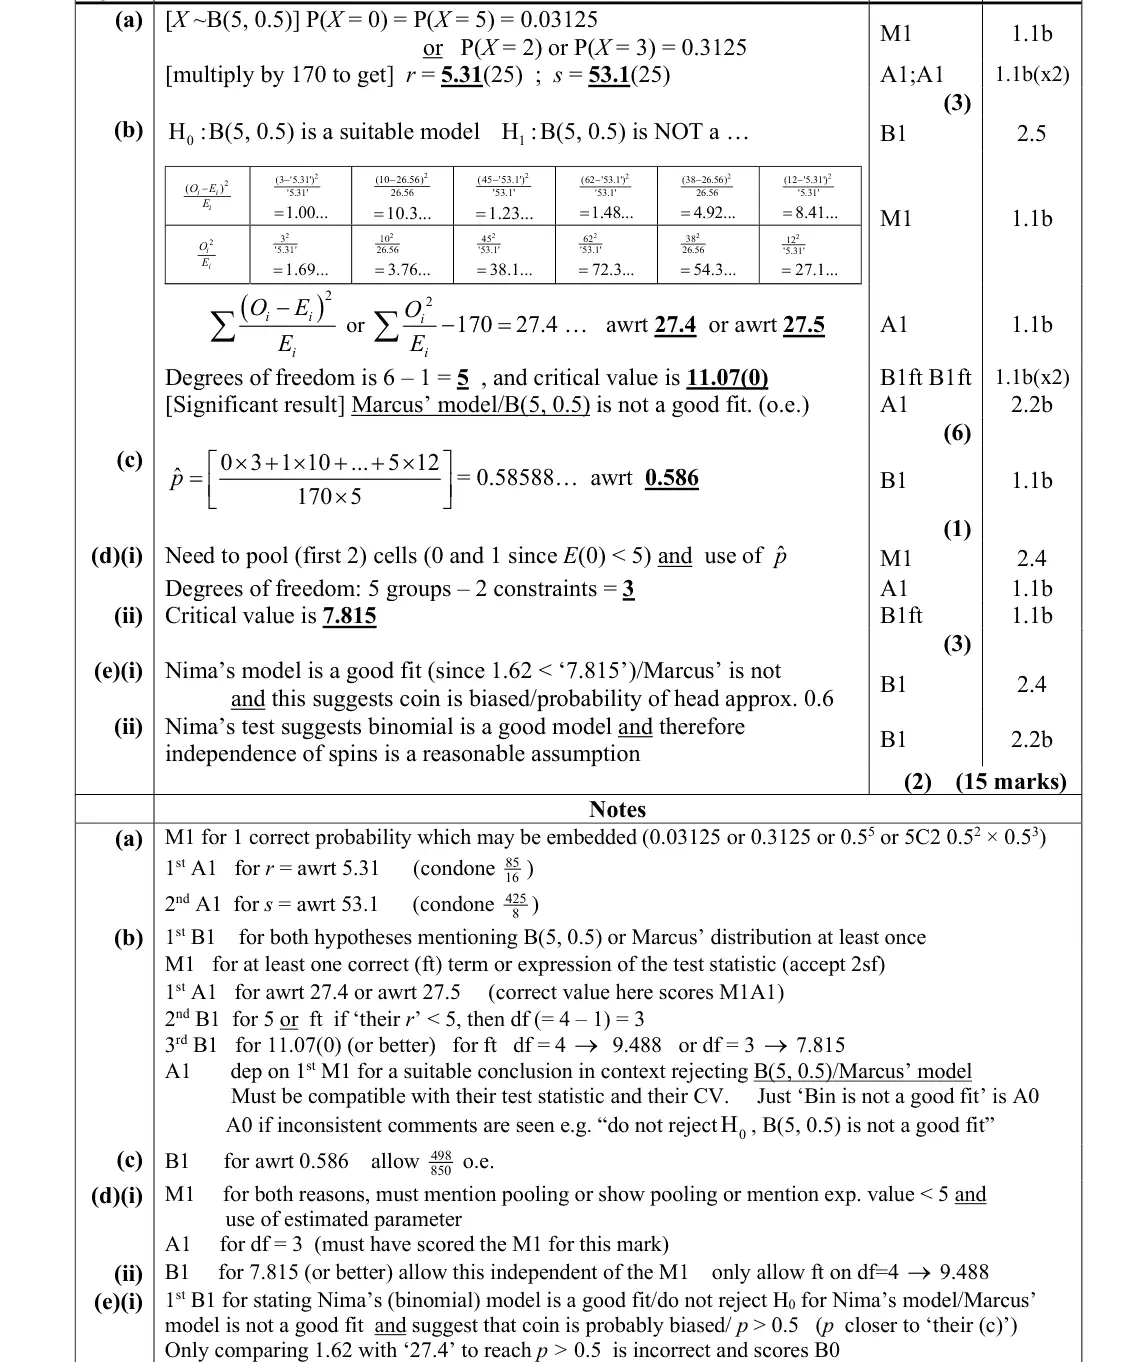
170 × P(X = 0) = r = 5.31, 170 × P(X = 2) = s = 53.1
multiplying by 100 was a slip
June 2023 · Paper 3B (Further Statistics 1) · Q3(b)6 marks
Mark scheme (whole question; this part is marked with the orange bar)
Examiner's comment
There were a large number of accessible marks on this question for all students but the written expression required in part (e) allowed higher achieving pupils to shine. In (b) the majority of students correctly stated both the null and alternative hypotheses, although some forgot to mention the parameters of the model B(5,0.5). The value of the test statistic was generally calculated accurately, with ( ) 2 i i i O E E - seen more commonly than 2 170 i i O E - . Occasionally, the first two columns were pooled, leading to an incorrect value of the test statistic. The value of ν was usually taken to be 5 and a correct critical value found. A well expressed contextual conclusion meant that most students earned all marks on part (b).
Key points from the mark scheme and examiner's report
H0: B(5, 0.5) is a suitable model (parameters needed)
all E ≥ 5 so no pooling
X² = 27.4
ν = 6 − 1 = 5, cv 11.070
significant so Marcus' model is not a good fit
pooling the first two columns was an error
June 2023 · Paper 3B (Further Statistics 1) · Q3(c)1 mark
Mark scheme (whole question; this part is marked with the orange bar)
Examiner's comment
There were a large number of accessible marks on this question for all students but the written expression required in part (e) allowed higher achieving pupils to shine. In (c), the majority of students were able to calculate the correct estimate for p, although some rounded prematurely, giving an answer of 0.59. An answer of 0.6, without any working, was also regularly seen.
Key points from the mark scheme and examiner's report
p̂ = total heads/(170 × 5) = 498/850 = 0.586
premature rounding to 0.59 or 0.6 without working
June 2023 · Paper 3B (Further Statistics 1) · Q3(d)3 marks
Mark scheme (whole question; this part is marked with the orange bar)
Examiner's comment
There were a large number of accessible marks on this question for all students but the written expression required in part (e) allowed higher achieving pupils to shine. In part (d)(i), nearly all students referred to the necessity of combining the first two columns as the first expected frequency < 5. However, the constraint of the value of p being estimated was less frequently noted. Writing down the critical value for ν = 3 presented no problems to students; students who had stated that ν = 4 were able to obtain follow through credit for a critical value of 9.488. On rare occasions students gave a critical value to 1 or 2 decimal places and lost the mark as a result.
Key points from the mark scheme and examiner's report
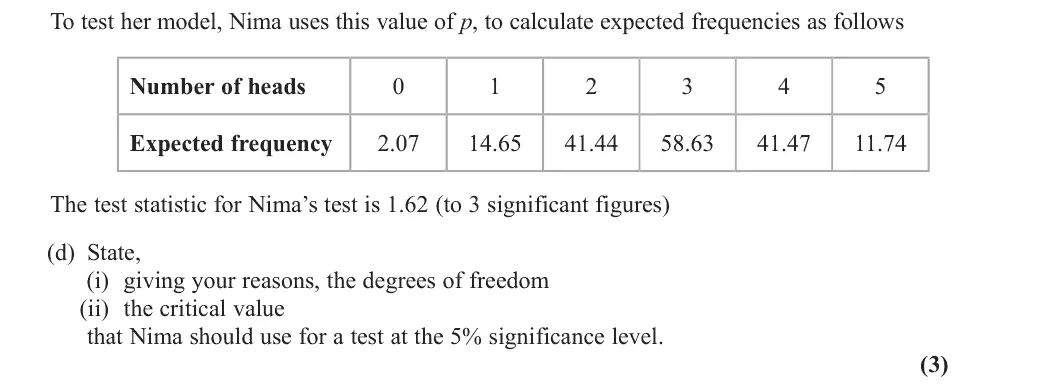
E(0) = 2.07 < 5 so pool 0 and 1: 5 cells
p estimated, so ν = 5 − 2 = 3
cv 7.815
the estimated-parameter constraint often omitted
June 2023 · Paper 3B (Further Statistics 1) · Q3(e)2 marks
Mark scheme (whole question; this part is marked with the orange bar)
Examiner's comment
There were a large number of accessible marks on this question for all students but the written expression required in part (e) allowed higher achieving pupils to shine. A large majority of students were able to make an attempt at both parts (e)(i) and (e)(ii). Some were hampered by a lack of clarity of thought. Those students who recognised that Nima's model was a good fit for the data usually were able to give convincing explanations in each case. Many thought that because p was greater than 0.5 (as demonstrated by Nima’s model) that independence no longer held. Examiners noted that poor handwriting in part (e) made it very difficult to decipher some students’ responses.
Key points from the mark scheme and examiner's report
(i) 1.62 < 7.815: Nima's B(5, 0.586) fits but B(5, 0.5) does not, so the coin is biased (P(head) about 0.6)
(ii) a binomial fits, so independence of spins is reasonable
many wrongly thought p > 0.5 breaks independence
June 2022 · AS Paper 2 (Further Statistics 1) · Q1(a)2 marks
Mark scheme (whole question; this part is marked with the orange bar)
Examiner's comment
This was a friendly start to the paper. Part (a) was generally fully correct. Any errors seen were mainly due to incorrect totals being calculated. A very small number of students were unable to recall the method to calculate expected frequencies.
Key points from the mark scheme and examiner's report
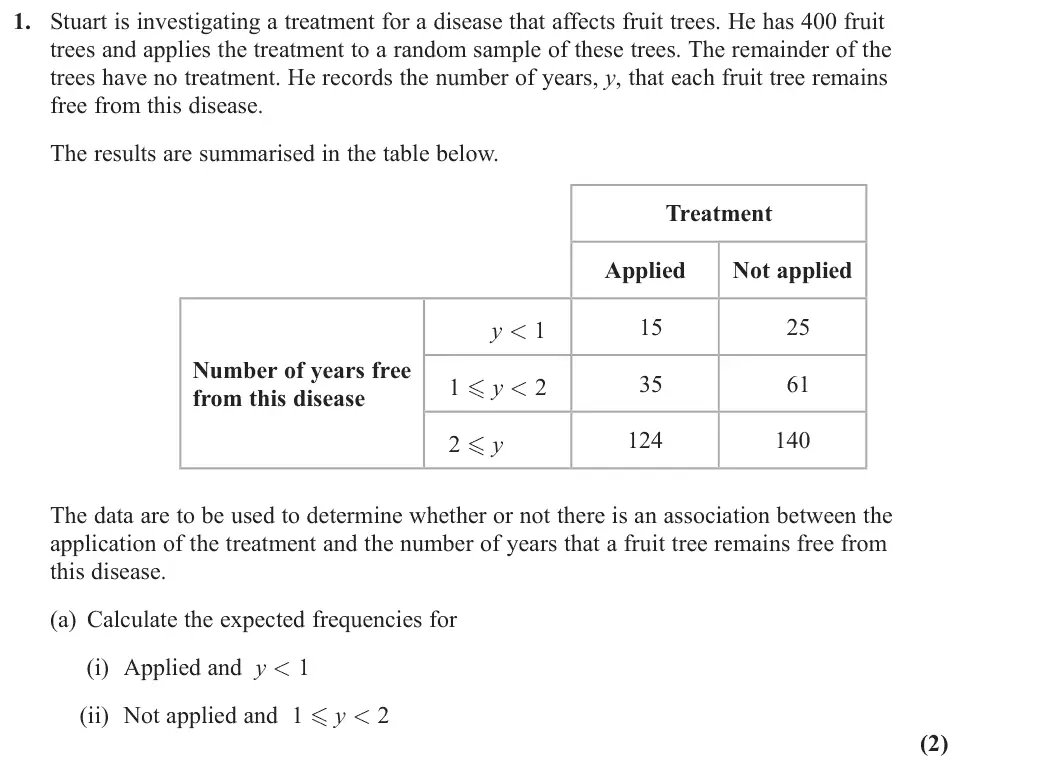
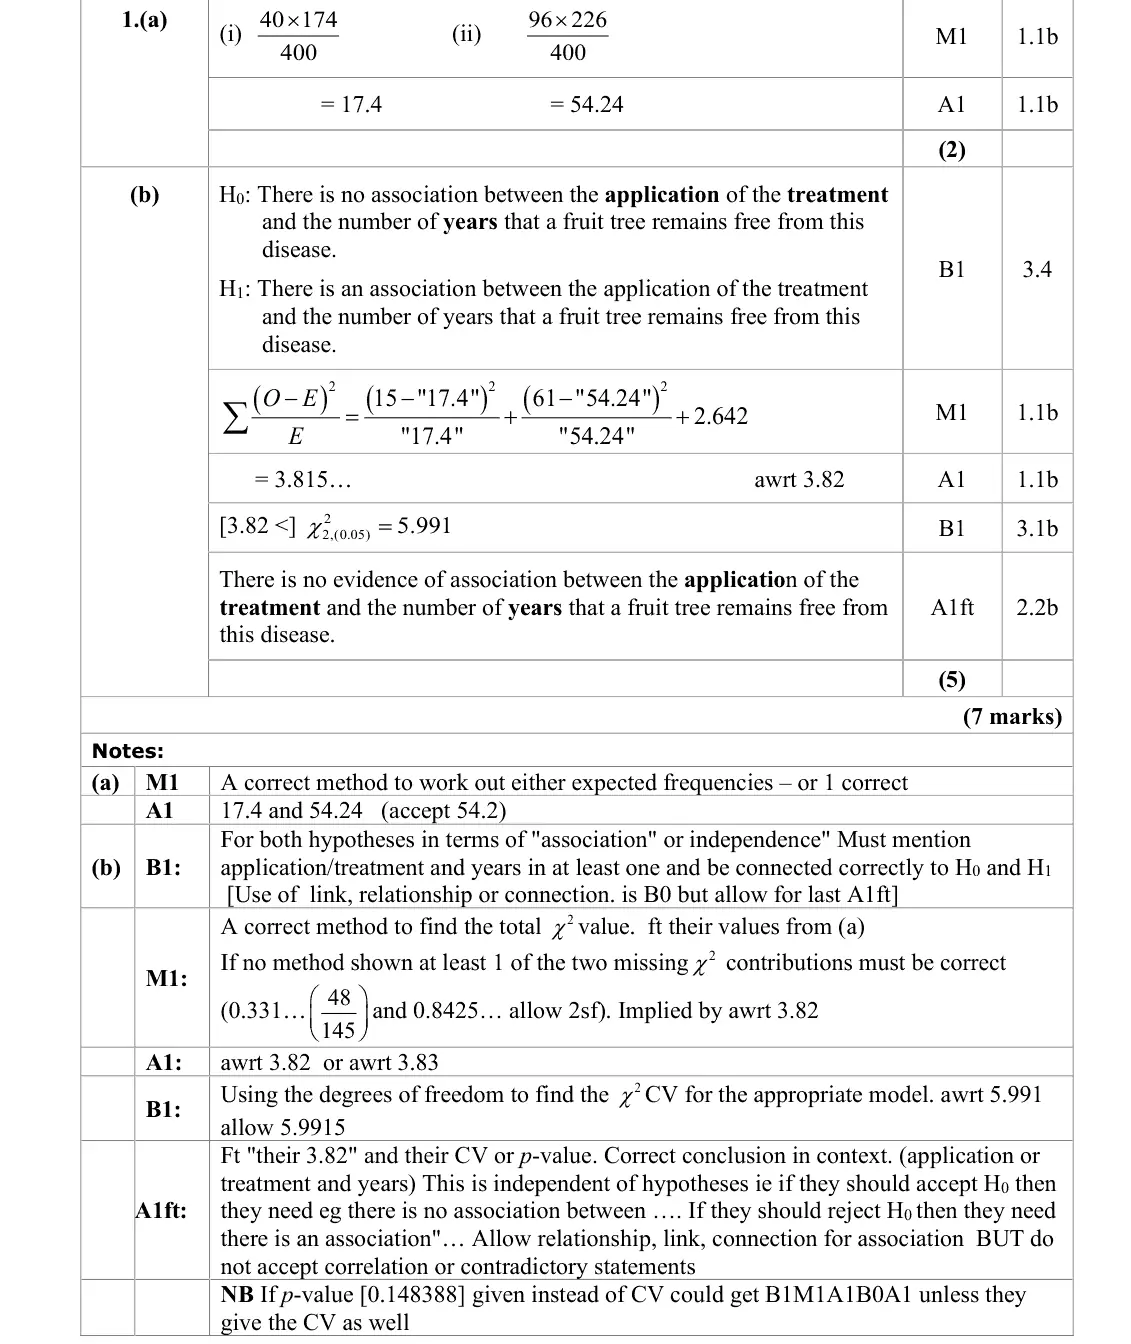
E = row total × column total ÷ grand total: (i) 40 × 174/400 = 17.4, (ii) 96 × 226/400 = 54.24
errors came from wrong totals
June 2022 · AS Paper 2 (Further Statistics 1) · Q1(b)5 marks
Mark scheme (whole question; this part is marked with the orange bar)
Examiner's comment
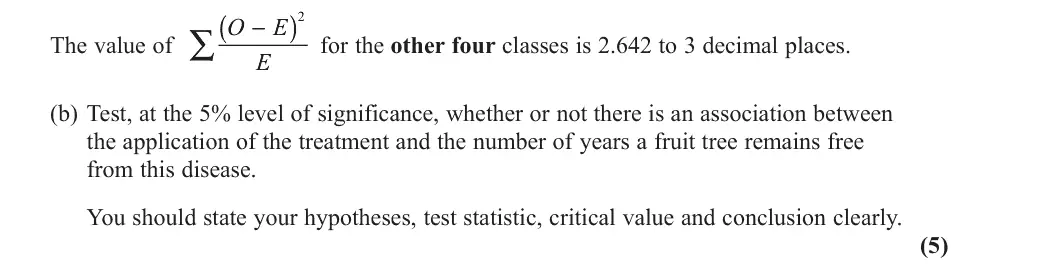
This was a friendly start to the paper. Part (b) was a slight variation in a standard contingency table question with part of the value of the test statistic being given. Some students chose to ignore this piece of information and simply calculated all of the contributions leading to a correct test statistic answer of 3.82 without the use of the given value of 2.642 The students who used the alternative method of finding the test statistic 2 total O E - ∑ were not always successful when it came to finding the test statistic. Those who ignored the 2.642 were fine but those who tried to alter their formula to accommodate 2.642 were less successful as they were unsure of what total to subtract. The critical value using the chi-squared distribution was invariably correct. It was reassuring to see the majority of students using full context in both their hypotheses and their final conclusion. However, a significant number of students mixed up their hypotheses, usually leading to an incorrect conclusion as a result of this error.
Key points from the mark scheme and examiner's report
H₀: no association between applying the treatment and years free from disease
add the two missing contributions (0.331 and 0.843) to the given 2.642: χ² = 3.82
ν = (3 − 1)(2 − 1) = 2, CV 5.991
no evidence of association
hypotheses often swapped
some ignored the given 2.642
June 2022 · AS Paper 2 (Further Statistics 1) · Q3(a)1 mark
Mark scheme (whole question; this part is marked with the orange bar)
Examiner's comment
Part (a) proved to be a good opening part to the question with most giving an explanation relating to the sample size or that expected frequencies would be less than 5.
Key points from the mark scheme and examiner's report
sample too small: some expected frequencies would be below 5 (cells would need combining)
June 2022 · AS Paper 2 (Further Statistics 1) · Q3(b)1 mark
Mark scheme (whole question; this part is marked with the orange bar)
Examiner's comment
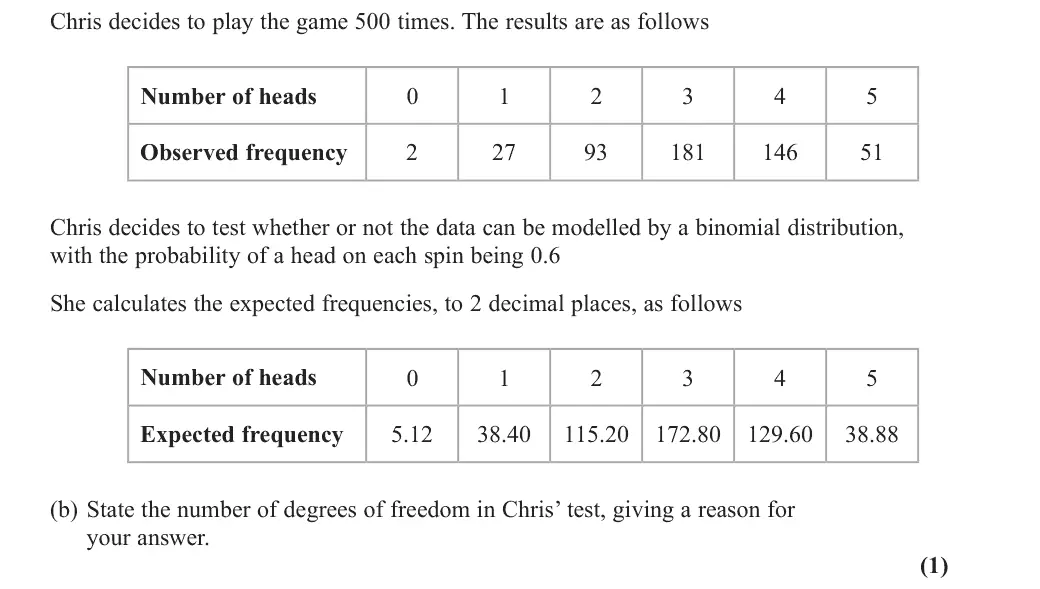
Part (b) not well done and only the most able students realised that the probability (parameter) did not need calculating / estimated as it was given and only commented about the totals adding up to 500.
Key points from the mark scheme and examiner's report
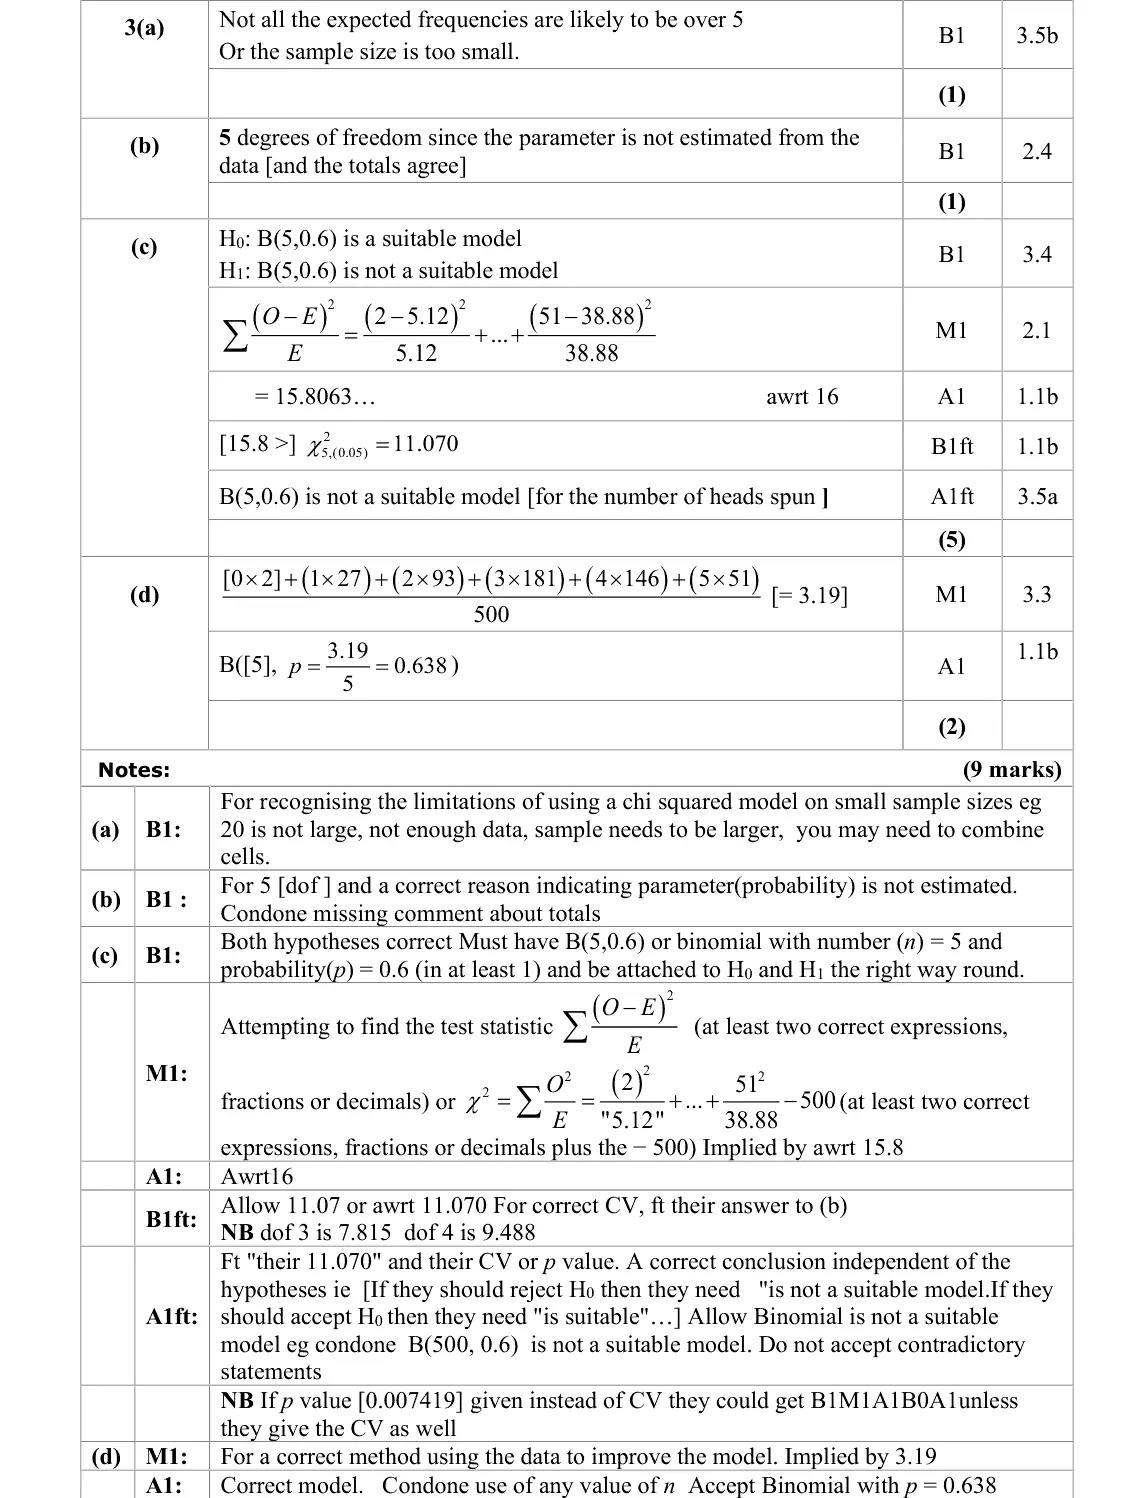
6 classes, 5 degrees of freedom because p = 0.6 is given, not estimated from the data (only the totals constraint)
few gave the parameter reason
June 2022 · AS Paper 2 (Further Statistics 1) · Q3(c)5 marks
Mark scheme (whole question; this part is marked with the orange bar)
Examiner's comment
In part (c) the Hypotheses were often incorrect. The main errors were giving the model B(500, 0.6) instead of B(5, 0.6) or leaving out the model completely and just stating it was a Binomial Distribution. The calculation of the test statistic was often done correctly and then compared with a critical value, followed through from their degrees of freedom in (b) and a correct conclusion reached that the model was not suitable. There was evidence to suggest that students understood the demand of the question with many who put n = 500 in the hypotheses using n = 5 in their calculations.
Key points from the mark scheme and examiner's report
H₀: B(5, 0.6) is a suitable model (not B(500, 0.6) or just "binomial")
no combining needed (5.12 > 5)
χ² = 15.8
CV χ²₅(5%) = 11.070
reject: B(5, 0.6) is not a suitable model
June 2022 · AS Paper 2 (Further Statistics 1) · Q3(d)2 marks
Mark scheme (whole question; this part is marked with the orange bar)
Examiner's comment
In part (d) most students were able to use the data to work out the expected mean value of 3.19 but only the most able related this to a Binomial Model and calculate a value for p.
Key points from the mark scheme and examiner's report
sample mean = Σfx/500 = 3.19
np = 3.19 gives p = 0.638: B(5, 0.638)
most found 3.19 but few turned it into p
June 2022 · Paper 3B (Further Statistics 1) · Q1(a)3 marksEasy
Mark scheme (whole question; this part is marked with the orange bar)
Examiner's comment
This provided a good start to the paper with over 60% of students scoring full marks. Nearly all answered part (a) correctly but there were a few errors occasionally seen in part (b). Some failed to state the parameters of the model in the hypotheses and very occasionally the hypotheses were the wrong way around. The calculation of the test statistic was generally correct though a few students thought that they needed to pool the final two columns and this, of course, affected their degrees of freedom. The correct conclusion was usually given in context as required.
Key points from the mark scheme and examiner's report
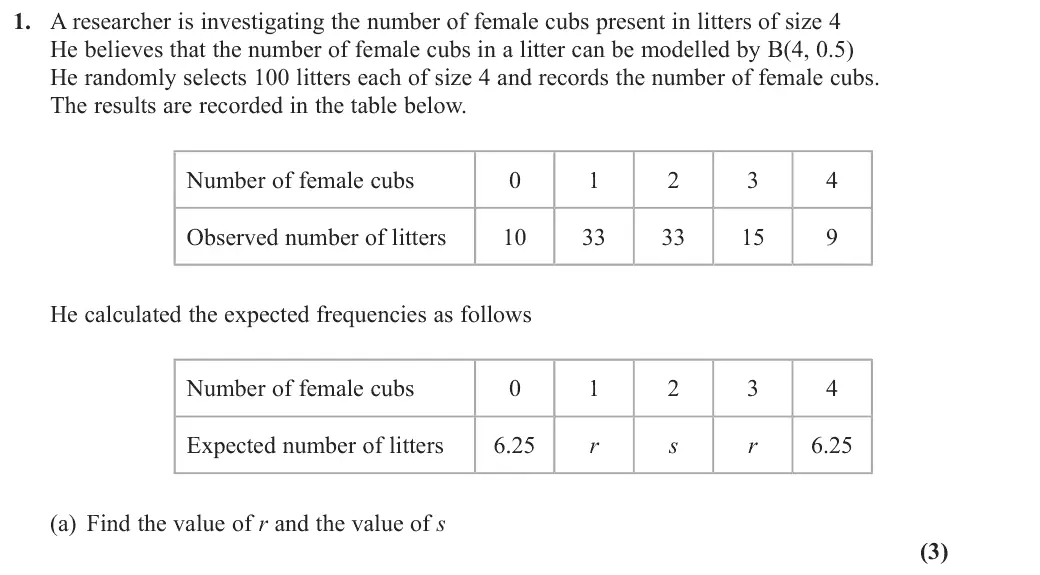
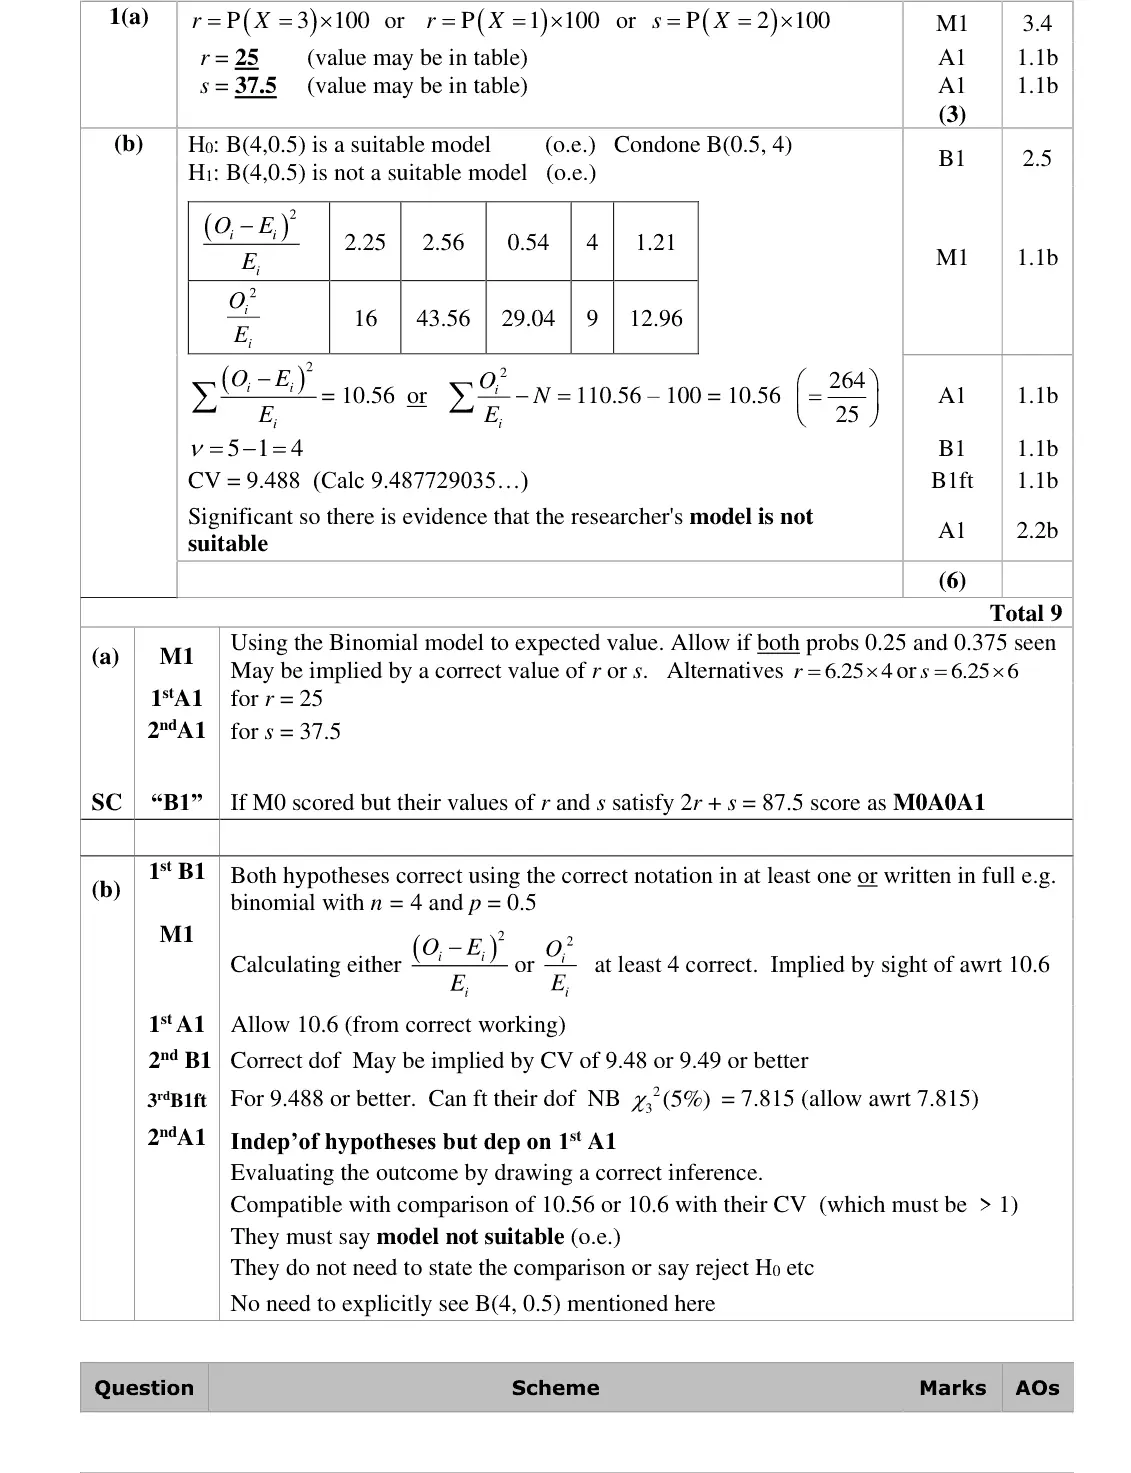
expected = 100 × P(X = x) from B(4, 0.5): r = 25, s = 37.5
June 2022 · Paper 3B (Further Statistics 1) · Q1(b)6 marksEasy
Mark scheme (whole question; this part is marked with the orange bar)
Examiner's comment
This provided a good start to the paper with over 60% of students scoring full marks. Nearly all answered part (a) correctly but there were a few errors occasionally seen in part (b). Some failed to state the parameters of the model in the hypotheses and very occasionally the hypotheses were the wrong way around. The calculation of the test statistic was generally correct though a few students thought that they needed to pool the final two columns and this, of course, affected their degrees of freedom. The correct conclusion was usually given in context as required.
Key points from the mark scheme and examiner's report
H0: B(4, 0.5) is a suitable model
no pooling needed (all E ≥ 5)
X² = 10.56
ν = 5 − 1 = 4 (no parameter estimated), cv 9.488
significant so model not suitable
some pooled unnecessarily, changing ν
state parameters in the hypotheses
Nov 2021 · Paper 3B (Further Statistics 1) · Q1(a)1 mark
Mark scheme (whole question; this part is marked with the orange bar)
Examiner's comment
Part (a) was a straightforward opener and most candidates answered this correctly.
Key points from the mark scheme and examiner's report
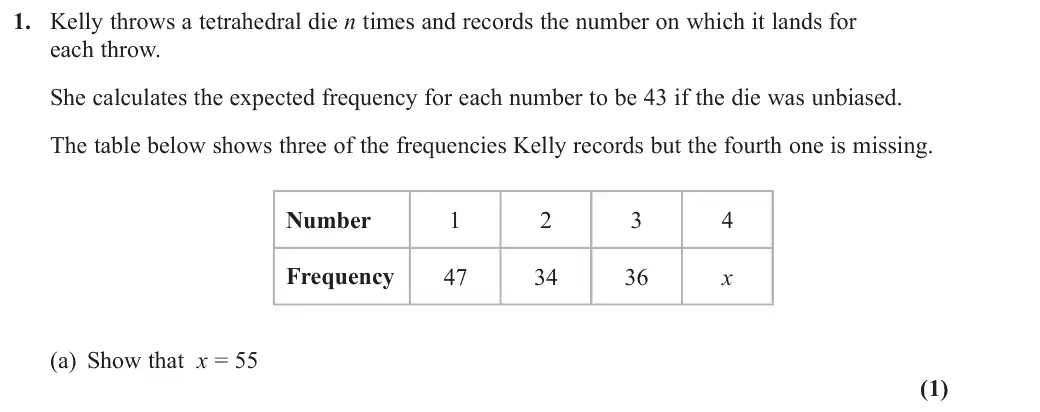
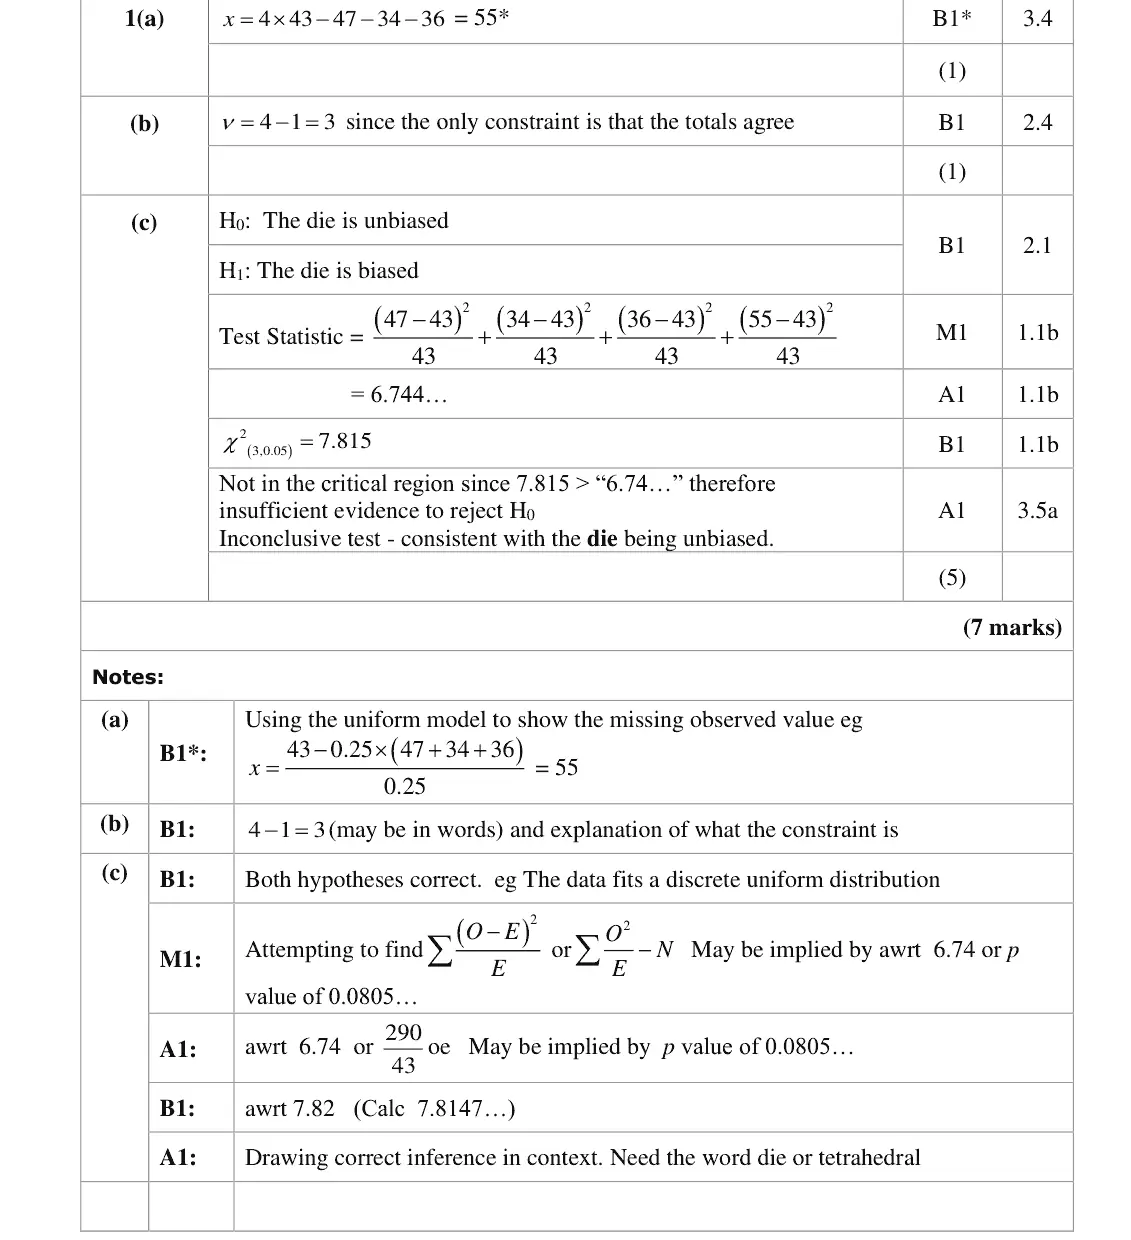
discrete uniform model: total 4 × 43 = 172, so x = 172 − 47 − 34 − 36 = 55
Nov 2021 · Paper 3B (Further Statistics 1) · Q1(b)1 mark
Mark scheme (whole question; this part is marked with the orange bar)
Examiner's comment
In part (b) many recognised that there was one constraint but described why there is not a second constraint and made no reference as to why there is one restraint. In the final part most calculated the test statistic accurately and the critical value. Of those
Key points from the mark scheme and examiner's report
ν = 4 − 1 = 3: the only constraint is that the totals agree (no parameter estimated)
many said why there is no second constraint but not what the one constraint is
Nov 2021 · Paper 3B (Further Statistics 1) · Q1(c)5 marks
Mark scheme (whole question; this part is marked with the orange bar)
Examiner's comment
In the final part most calculated the test statistic accurately and the critical value. Of those candidates who didn’t gain the correct statistic the majority did not show any working. This was a risky strategy as an error using the calculator results in the loss of marks. Students need to check their calculator entries carefully but would be advised to show at least some evidence of how they calculated the test statistic.
Key points from the mark scheme and examiner's report
H0: die unbiased (discrete uniform fits)
X² = 290/43 = 6.74 (p = 0.0805)
cv 7.815
not significant, consistent with an unbiased die
show the working for the statistic
Oct 2020 · AS Paper 2 (Further Statistics 1) · Q2(a)7 marks
Mark scheme (whole question; this part is marked with the orange bar)
Examiner's comment
Most candidates made a good start to this question stating the hypotheses in part (a) the correct way round (with the correct use of association) and carrying out an appropriate test. The expected values for the test were almost always found correctly and most calculated the value of the test statistics to an appropriate degree of accuracy. The calculation of the degrees of freedom caused some difficulty for weaker candidates with 8 – 1 = 7 sometimes being seen. Candidates did well to conclude the hypothesis test in context.
Key points from the mark scheme and examiner's report
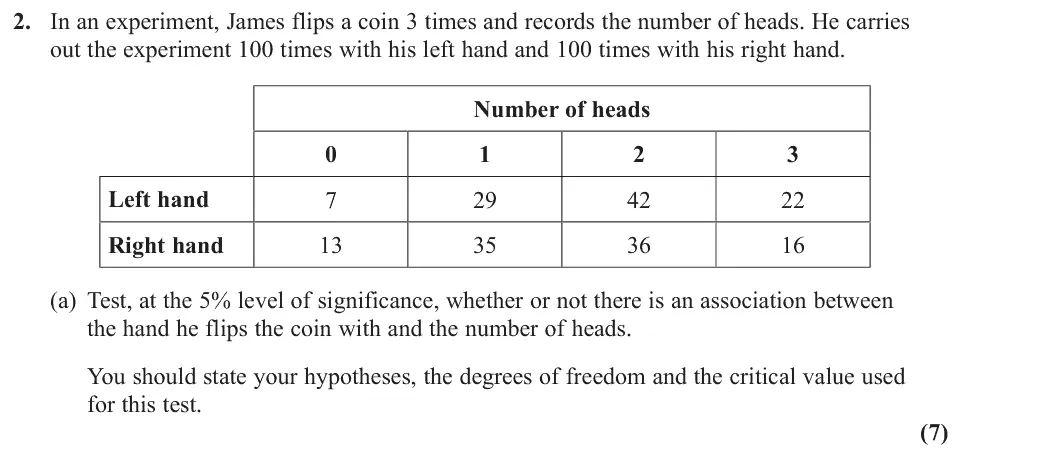
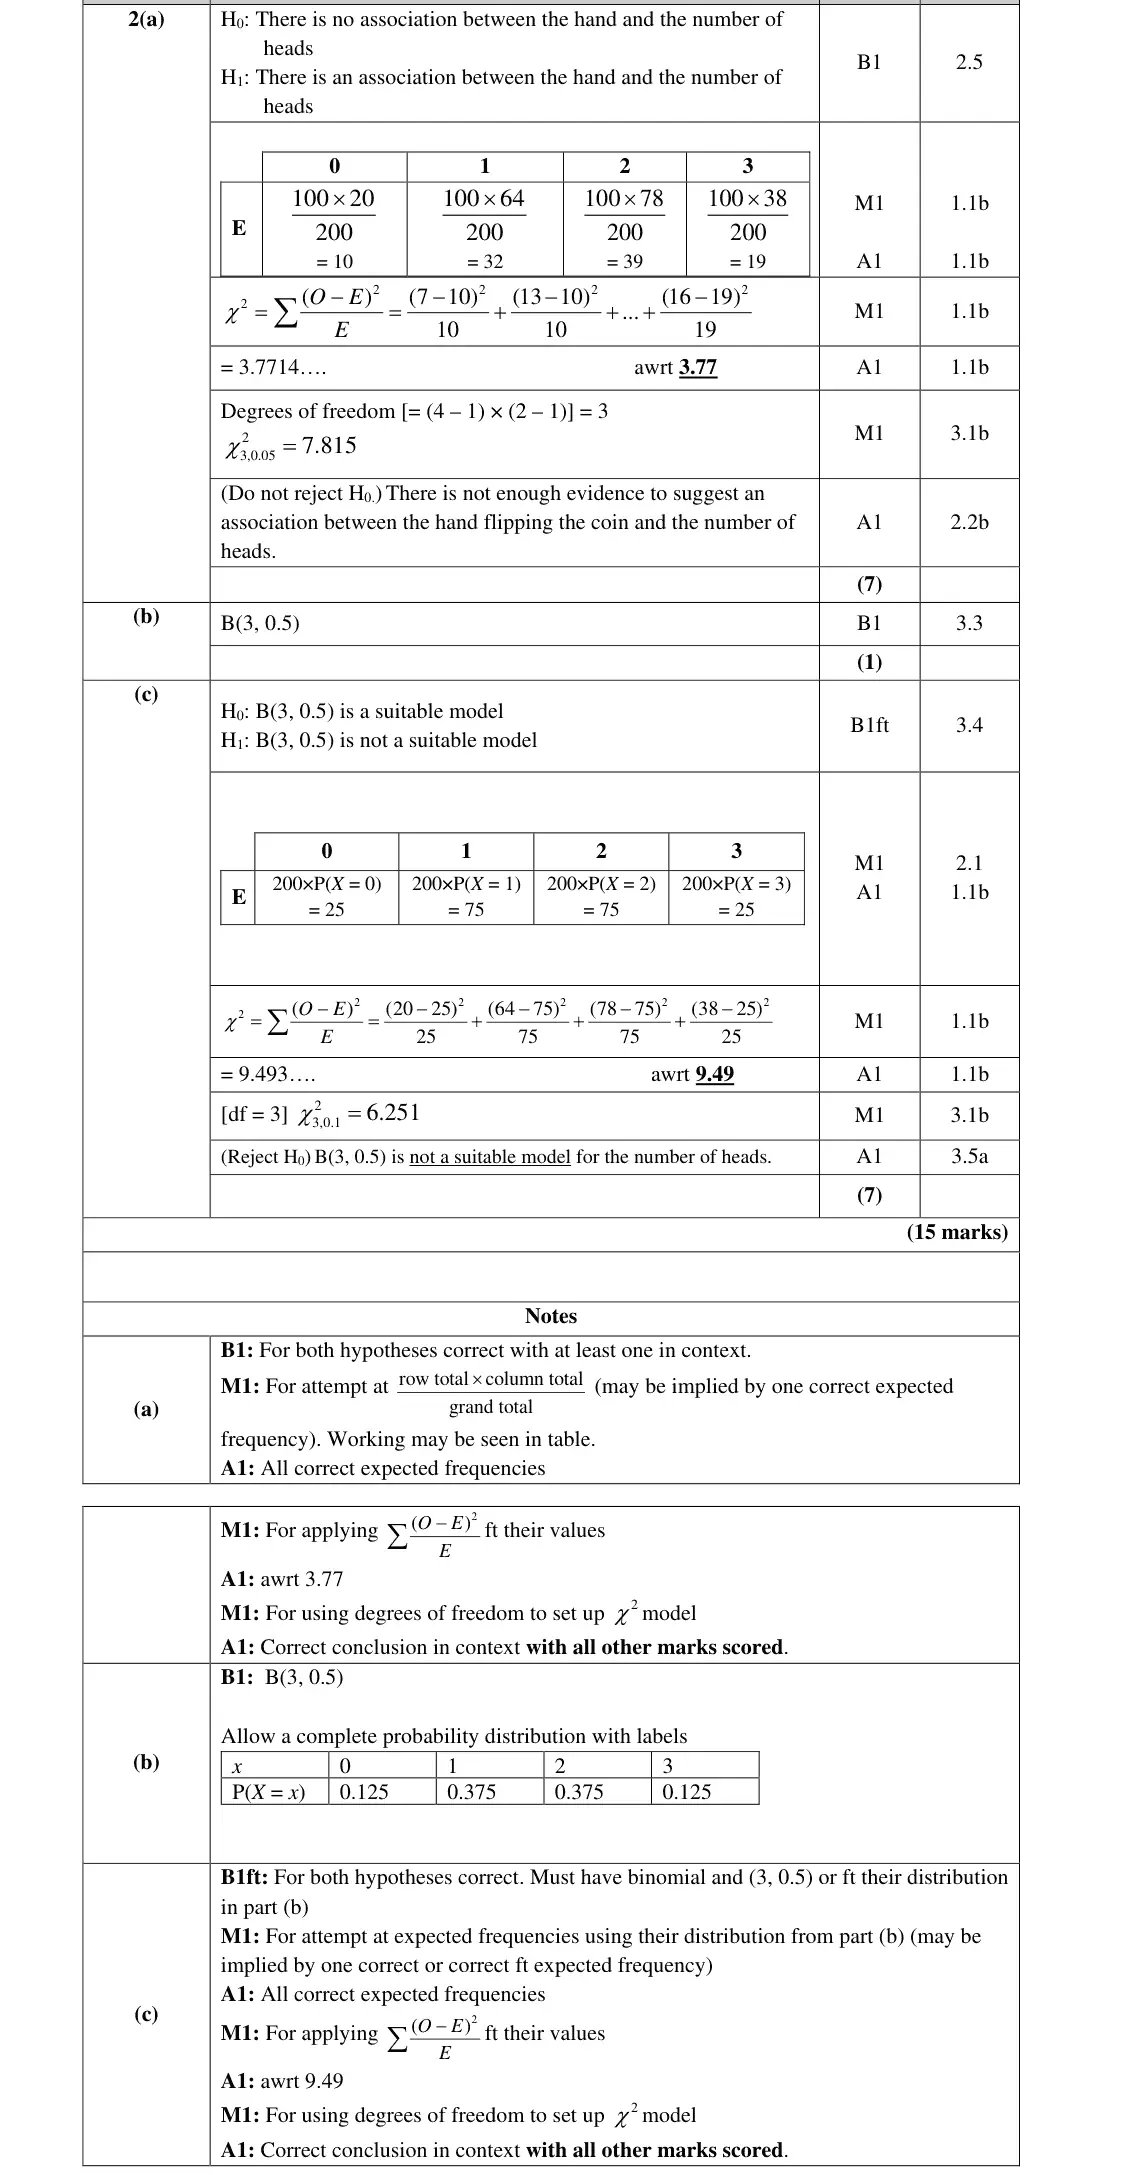
H₀: no association between hand and number of heads
E = row total × column total ÷ 200: 10, 32, 39, 19
χ² = 3.77
ν = (4 − 1)(2 − 1) = 3, CV 7.815
not significant: no evidence of association
8 − 1 = 7 degrees of freedom was a common error
Oct 2020 · AS Paper 2 (Further Statistics 1) · Q2(b)1 mark
Mark scheme (whole question; this part is marked with the orange bar)
Examiner's comment
Part (b) proved more challenging for most. Many attempted to find the probability distribution from scratch working out the probabilities for 0, 1, 2 and 3 heads separately. The instruction ‘write down’ alongside the fact that only 1 mark was available for this part should have both provided clues that no calculations were needed. Some candidates misinterpreted ‘unbiased’ for the uniform distribution and assumed that all outcomes were equally likely. Most went on to use their distribution in their hypotheses is part (c). It is important to
Key points from the mark scheme and examiner's report
B(3, 0.5): "write down" for 1 mark, no calculation needed
some wrongly assumed a uniform distribution
Oct 2020 · AS Paper 2 (Further Statistics 1) · Q2(c)7 marks
Mark scheme (whole question; this part is marked with the orange bar)
Examiner's comment
Most went on to use their distribution in their hypotheses is part (c). It is important to note that we are testing not just whether a binomial distribution is suitable, but whether the distribution B(3, 0.5) is suitable. Many used their distribution correctly to work out the expected values for the hypothesis test. The biggest mistake made was failing to realise the need to combine the left hand row and the right hand row so that there were only 4 cells required.
Key points from the mark scheme and examiner's report
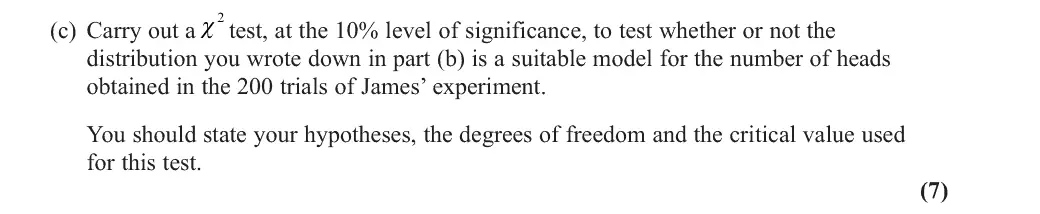
H₀: B(3, 0.5) is a suitable model (not just "binomial")
combine left- and right-hand rows into 4 cells: O = 20, 64, 78, 38
E = 25, 75, 75, 25
χ² = 9.49
ν = 3, CV 6.251
reject: B(3, 0.5) is not a suitable model
main error was not combining the two hands
Oct 2020 · Paper 3B (Further Statistics 1) · Q5(a)2 marks
Mark scheme (whole question; this part is marked with the orange bar)
Examiner's comment
Part (a) was an accessible start to the question. A small number seemed to be attempting expectation. Some simply wrote down 6/40 which was not sufficient.
Key points from the mark scheme and examiner's report
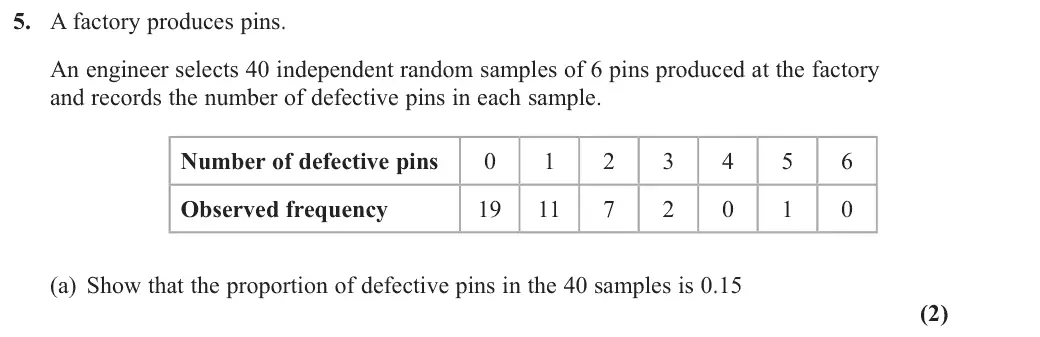
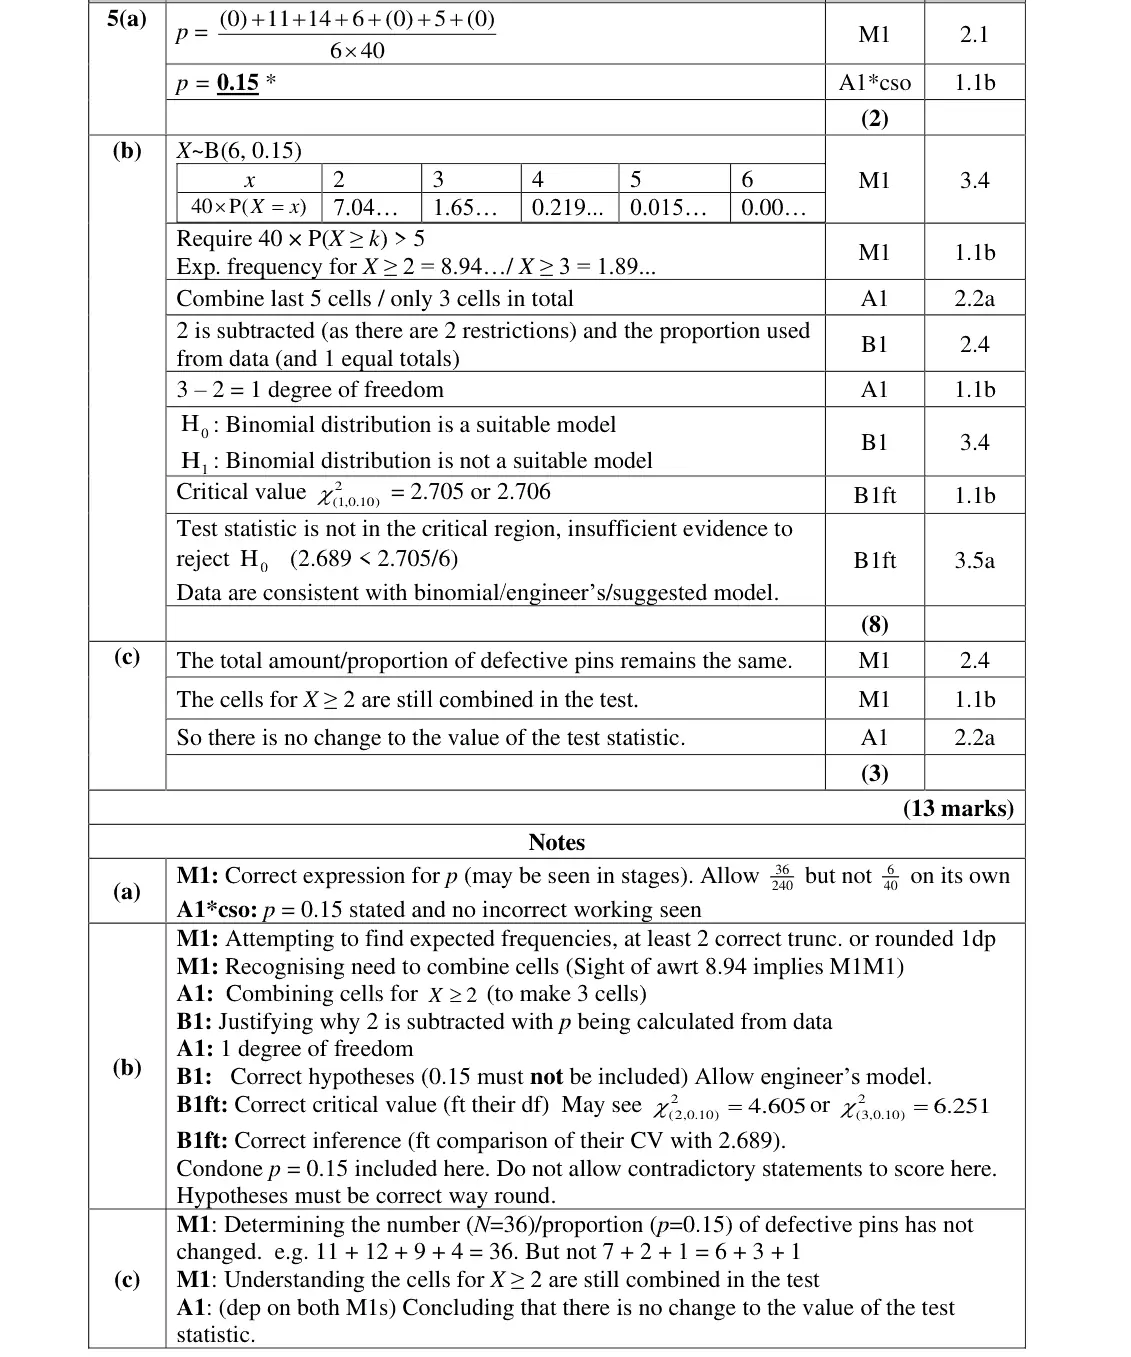
total defectives 36 out of 6 × 40 = 240 pins, p = 0.15
6/40 alone not sufficient
Oct 2020 · Paper 3B (Further Statistics 1) · Q5(b)8 marks
Mark scheme (whole question; this part is marked with the orange bar)
Examiner's comment
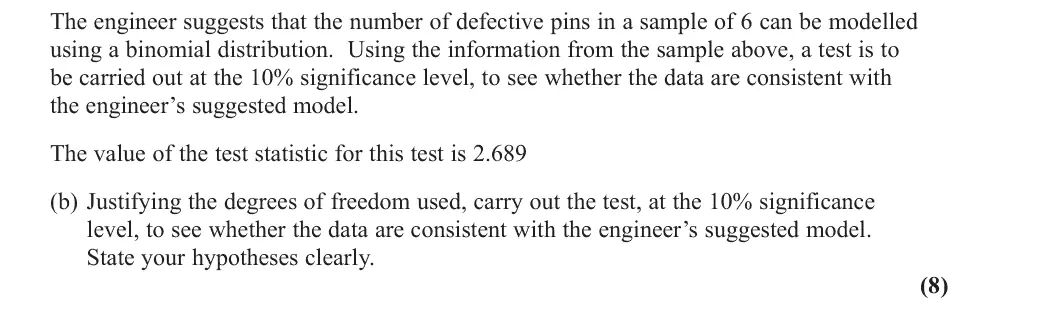
In part (b), hypotheses were usually stated first and often correct. A common error was to include p = 0.15 in the hypotheses which is not correct for this problem. (This was not penalised in the conclusion although should not have been there either.) Expected values were usually shown evaluated, and the need for pooling identified. Most pooled correctly and found one degree of freedom. (Some were not explicit that it is low expected frequencies that lead to the need for pooling rather than low observed frequencies.) A fair number missed the demand to explain their degrees of freedom calculation, but many did explain that the value of p was calculated from the data. A corresponding critical value was stated by most, even when the degrees of freedom was incorrect, and concluded correctly. A small number used the wrong column in the tables and some believed that the statistic being below the critical value meant a significant result. Surprisingly, a significant number of candidates evaluated a test statistic, despite being given the value, and worryingly some of these compared their value to the stated one as though it were the critical value.
Key points from the mark scheme and examiner's report
B(6, 0.15) expected frequencies
combine X ≥ 2 so 3 cells
ν = 3 − 2 = 1 because p was estimated from the data (justification required)
cv 2.706
2.689 not significant, data consistent with the binomial model
p = 0.15 must not be in the hypotheses
Oct 2020 · Paper 3B (Further Statistics 1) · Q5(c)3 marks
Mark scheme (whole question; this part is marked with the orange bar)
Examiner's comment
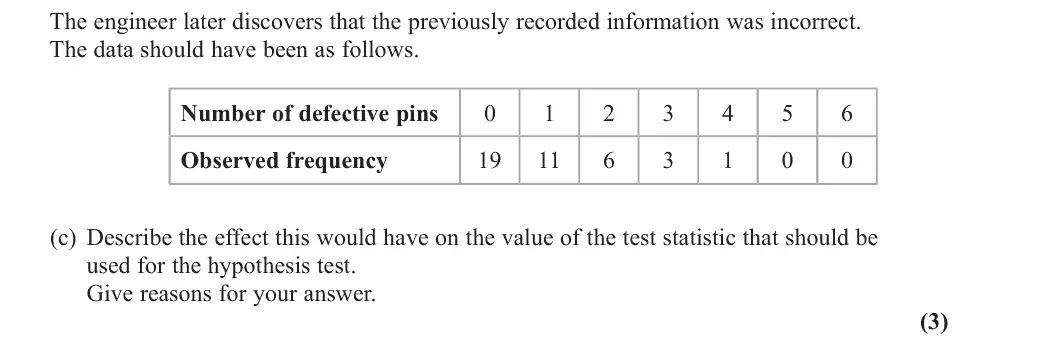
Part (c) was challenging for most and one of the most discriminating parts of the paper. Few gained full marks here, but a large number gained a mark for recognising the need to still pool the same classes. Few considered how the change might affect the proportion of defective pins and so, without complete reasoning, could not access the mark for recognising that there would be no effect on the test statistic.
Key points from the mark scheme and examiner's report
total defectives still 36 so p = 0.15 unchanged
cells X ≥ 2 still combined with the same totals (6 + 3 + 1 = 10), so the test statistic is unchanged
most discriminating part
June 2019 · AS Paper 2 (Further Statistics 1) · Q1(a)1 mark
Mark scheme (whole question; this part is marked with the orange bar)
Examiner's comment
Nearly all the candidates knew the hypotheses were about association or independence and mentioned tables and gave the value 1.635 and those who had their hypotheses the correct way round in part (a) were usually able to give an appropriate conclusion either in terms of there being evidence of association between age and choice of activity or, more simply, stating that there was evidence to support the manager’s belief.
Key points from the mark scheme and examiner's report
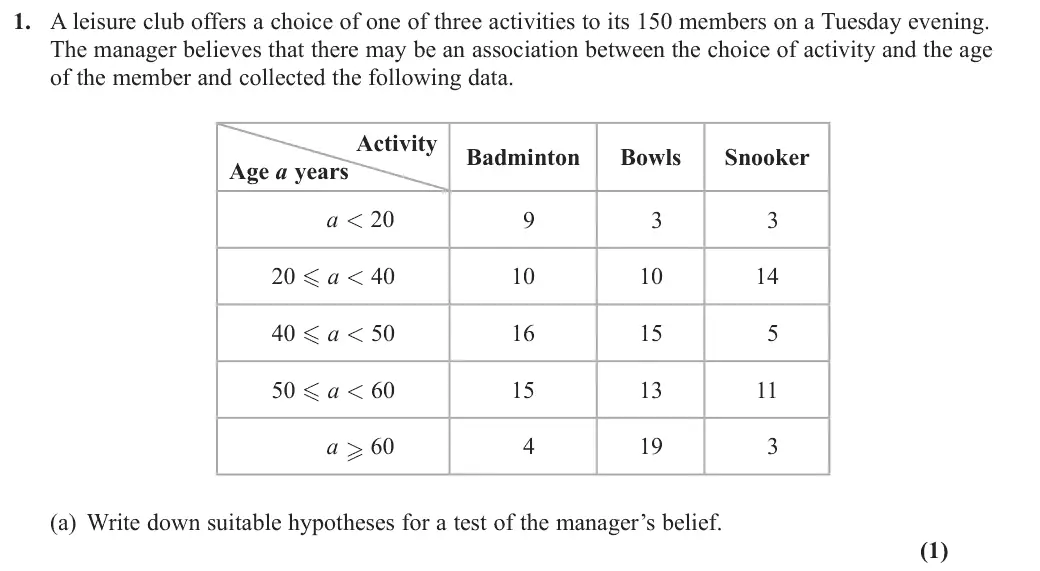
H₀: no association between age and activity, H₁: there is an association
must mention age and activity
"relationship" or "correlation" not accepted
a surprising number had H₀ and H₁ the wrong way round
June 2019 · AS Paper 2 (Further Statistics 1) · Q1(b)1 mark
Mark scheme (whole question; this part is marked with the orange bar)
Examiner's comment
Nearly all the candidates knew the hypotheses were about association or independence and mentioned the context but a surprising number gave H0 and H1 the wrong way around. Part (b) was answered very well and the critical value in part (d) was usually quoted correctly with these two marks being scored but their calculation in part (b) should have steered them towards the top right-hand cell which had an expected frequency of 3.6 and therefore meant that some amalgamation was required. Those who did identify this value usually realised that amalgamating the first two rows would deal with the small expected frequencies and the ensuing 4x3 table would lead to 6 degrees of freedom. Few candidates calculated the 3.6 (though one mark was available for mentioning the combining or rows leading to the 4x3 table) and some confused rows and columns or just mentioned vaguely combining cells. A common error was to think that amalgamation of cells was required because of the observed frequencies being less than 5 and this sometimes led to combining snooker and bowls or the first and last rows. Others simply thought that the 6 came from a calculation of 8 – 2 presumably confusing with the calculations required for goodness of fit tests. In the final part only a small minority did not know how to use the
Key points from the mark scheme and examiner's report
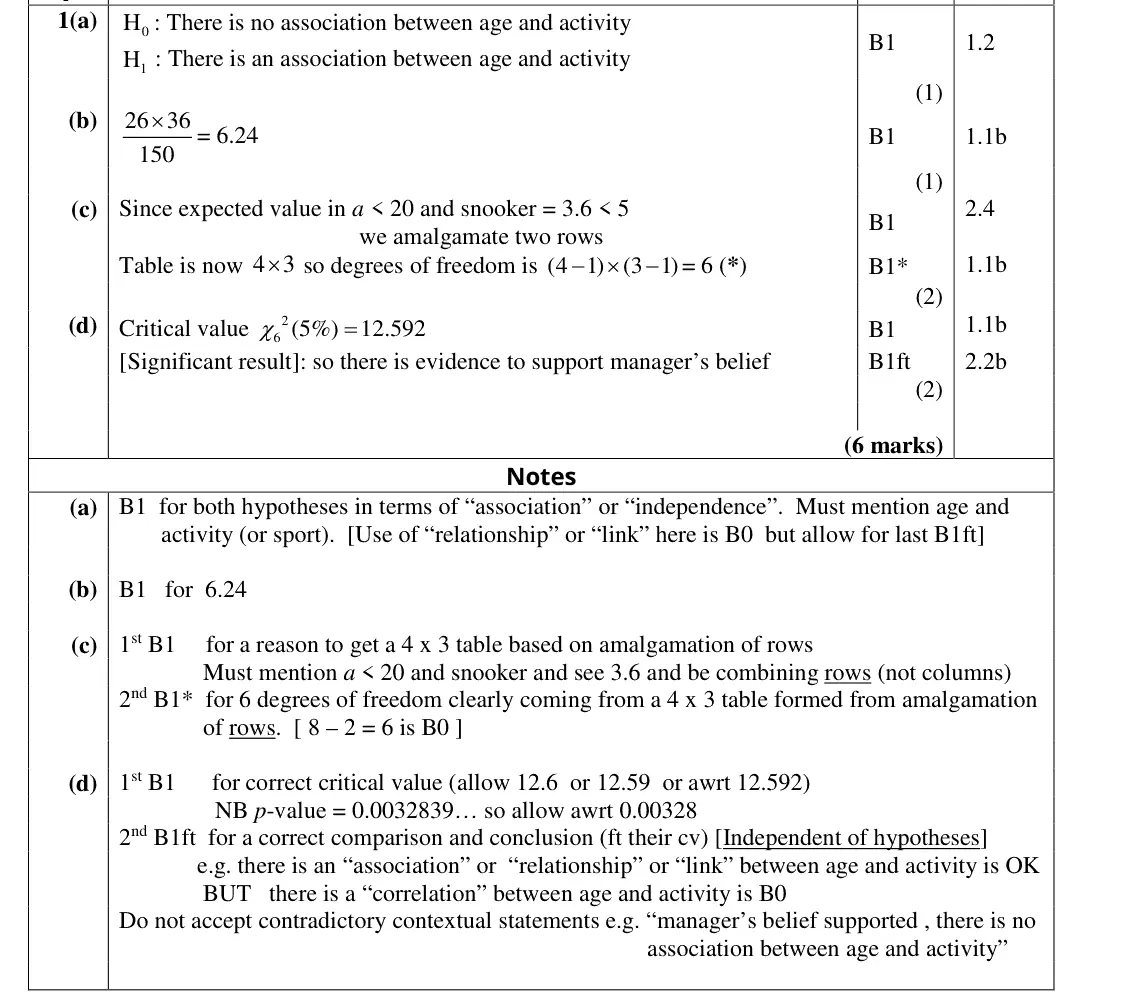
E = row total × column total ÷ grand total = 26 × 36 / 150 = 6.24
June 2019 · AS Paper 2 (Further Statistics 1) · Q1(c)2 marks
Mark scheme (whole question; this part is marked with the orange bar)
Examiner's comment
Nearly all the candidates knew the hypotheses were about association or independence and mentioned by the vast majority of the candidates. The explanation in part (c) was not always answered thoroughly enough. We were looking for candidates to realise that some of the rows would need amalgamating because some expected frequencies were less than 5. Some calculated all of the expected frequencies but their calculation in part (b) should have steered them towards the top right-hand cell which had an
Key points from the mark scheme and examiner's report
expected frequency for a < 20 and snooker is 3.6 < 5, so amalgamate the first two rows (not columns)
4 × 3 table gives (4 − 1)(3 − 1) = 6
common errors were citing observed frequencies < 5 or 8 − 2 = 6
June 2019 · AS Paper 2 (Further Statistics 1) · Q1(d)2 marks
Mark scheme (whole question; this part is marked with the orange bar)
Examiner's comment
Nearly all the candidates knew the hypotheses were about association or independence and mentioned well and the critical value in part (d) was usually quoted correctly with these two marks being scored by the vast majority of the candidates. The explanation in part (c) was not always answered thoroughly required for goodness of fit tests. In the final part only a small minority did not know how to use the tables and gave the value 1.635 and those who had their hypotheses the correct way round in part (a)
Key points from the mark scheme and examiner's report
χ²₆(5%) = 12.592
19.583 > 12.592, significant: evidence of association between age and activity (supports the manager's belief)
"correlation" scores B0
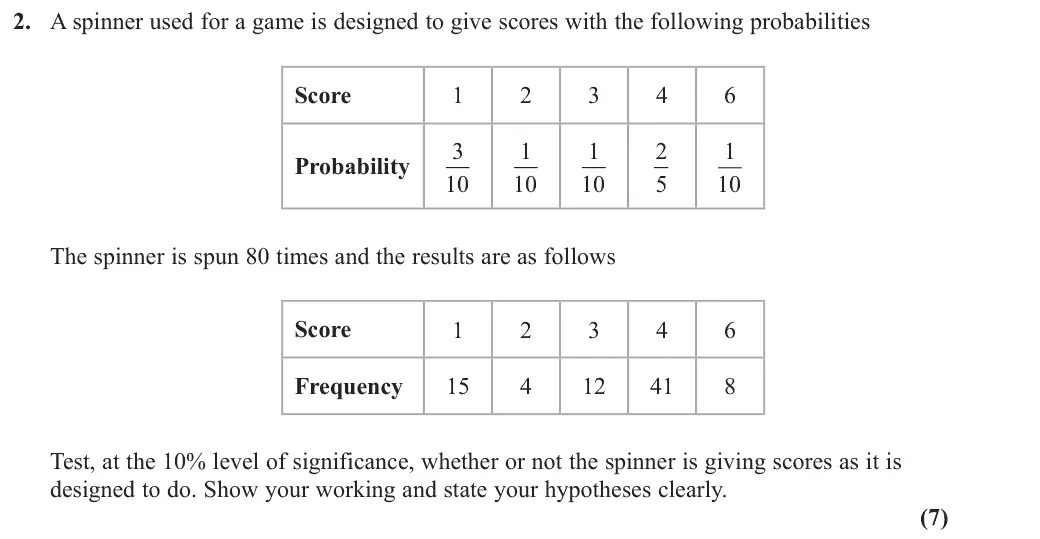
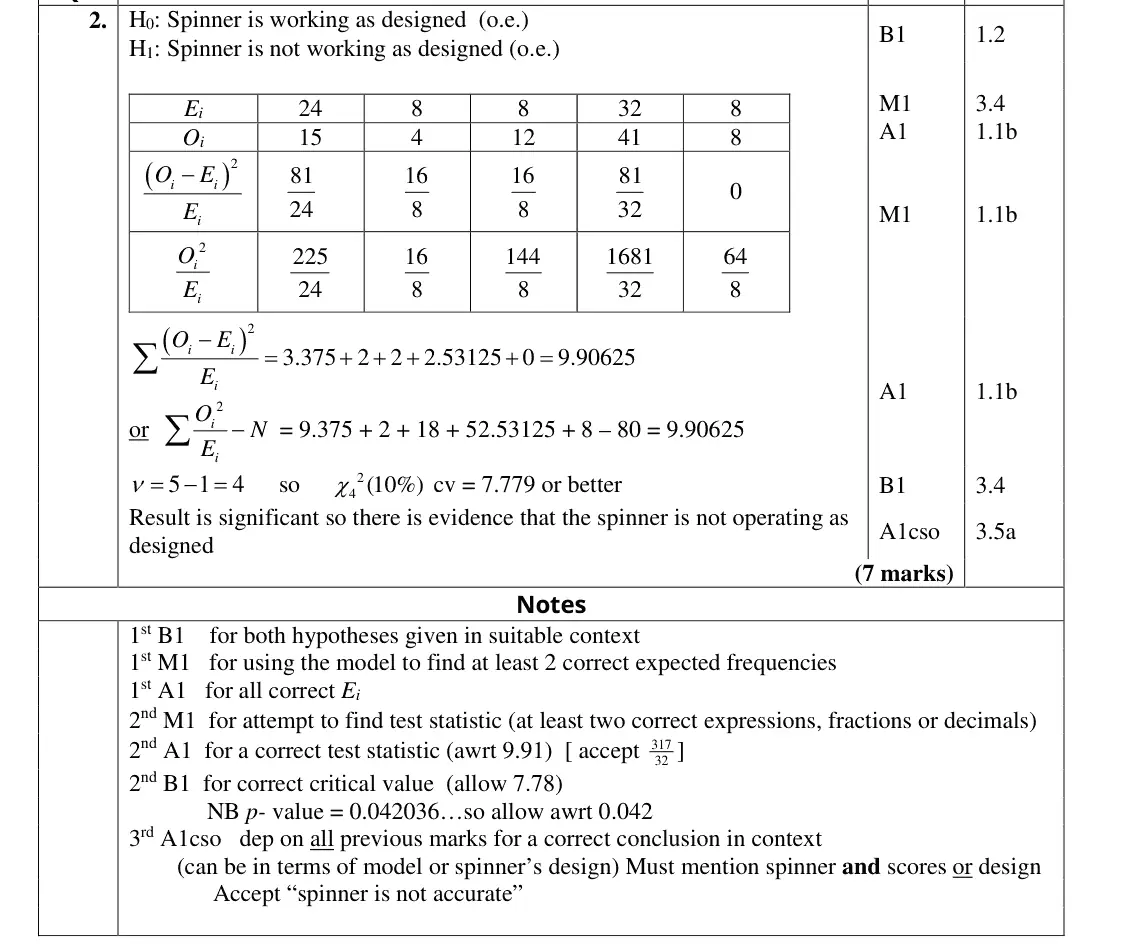
June 2019 · AS Paper 2 (Further Statistics 1) · Q27 marks
Mark scheme (whole question; this part is marked with the orange bar)
Examiner's comment
This question was generally answered very well. Some lost marks for the hypotheses: statements such as the “observed frequencies match the expected frequencies” or “a uniform distribution is a suitable model” were given rather than a comment about the spinner’s design such as “the spinner is giving probabilities as it is designed to do”. The expected frequencies were usually found correctly but a number of candidates lost marks for incorrectly combining the scores for 1 and 2 because the observed frequency for a score of 2 was less than 5; candidates need to understand that the amalgamation of cells is only required when expected frequencies fall below 5. The calculations and selection of the critical value were usually correct and most realised that the test suggested the spinner was not working as designed.
Key points from the mark scheme and examiner's report
H₀: the spinner works as designed
expected frequencies 24, 8, 8, 32, 8 (none < 5, so do not combine scores 1 and 2: only expected frequencies matter)
χ² = 9.906
ν = 4, CV 7.779
significant: spinner not working as designed
hypotheses such as "uniform distribution" lost the mark
June 2019 · Paper 3B (Further Statistics 1) · Q4(a)2 marks
Mark scheme (whole question; this part is marked with the orange bar)
Examiner's comment
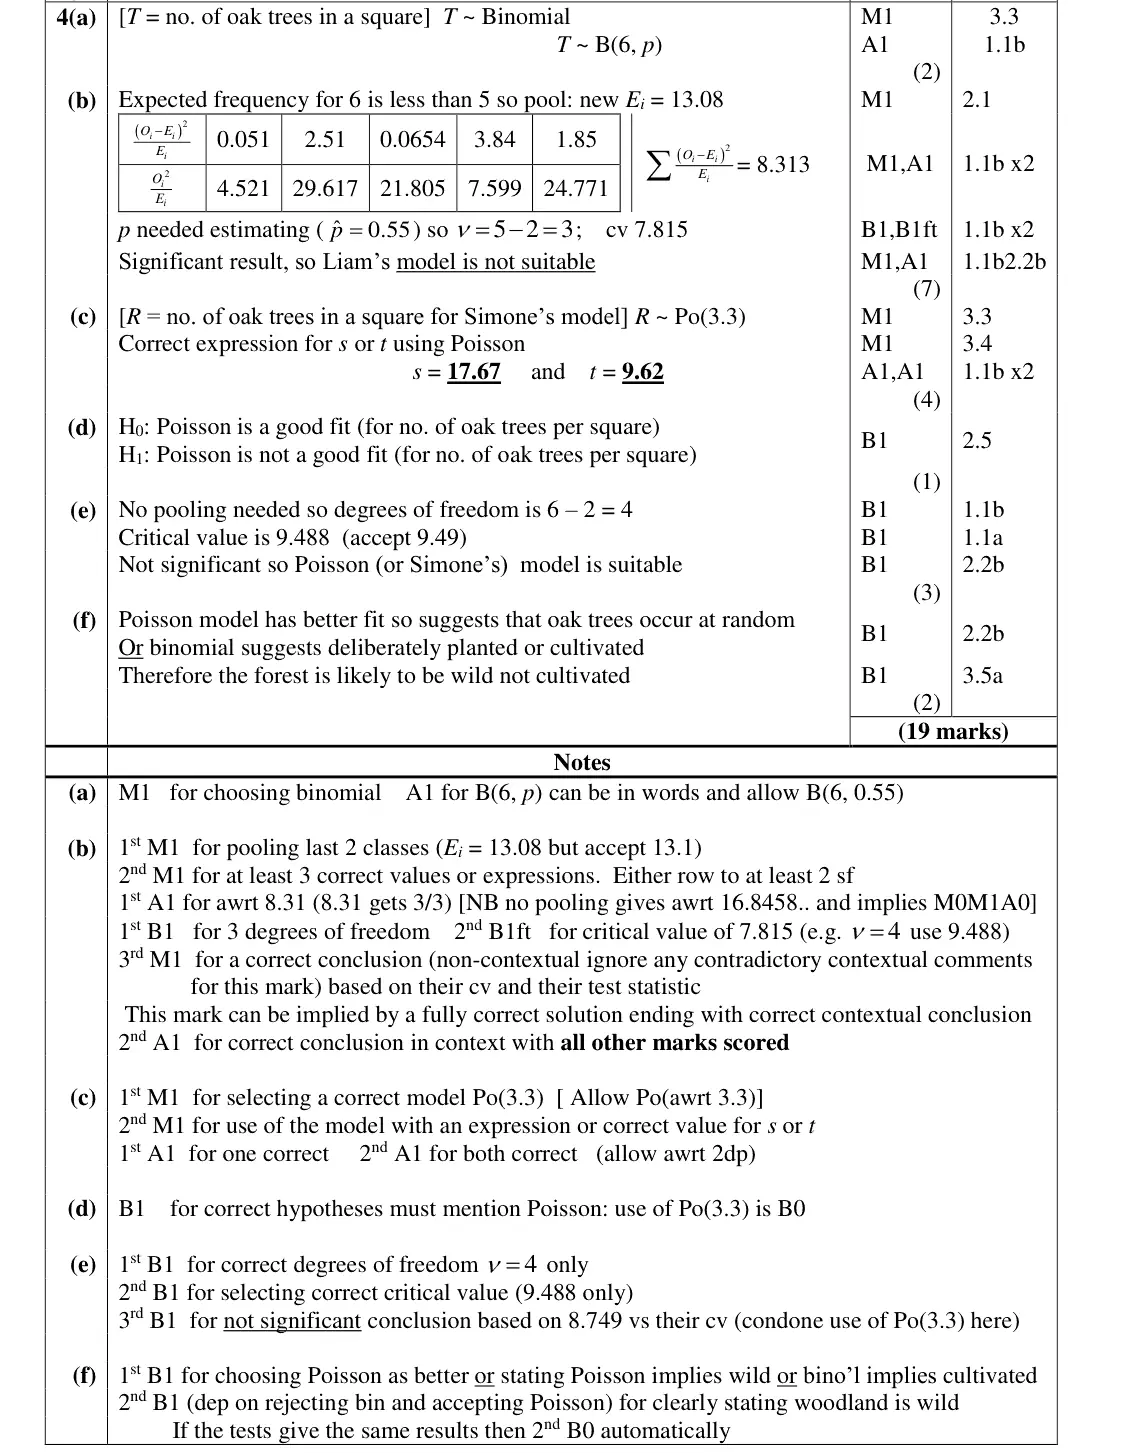
Part (a) was answered well with the majority identifying a suitable binomial distribution although a few did think a Poisson was appropriate here. In part (b) the most common error was a failure to pool the
Key points from the mark scheme and examiner's report
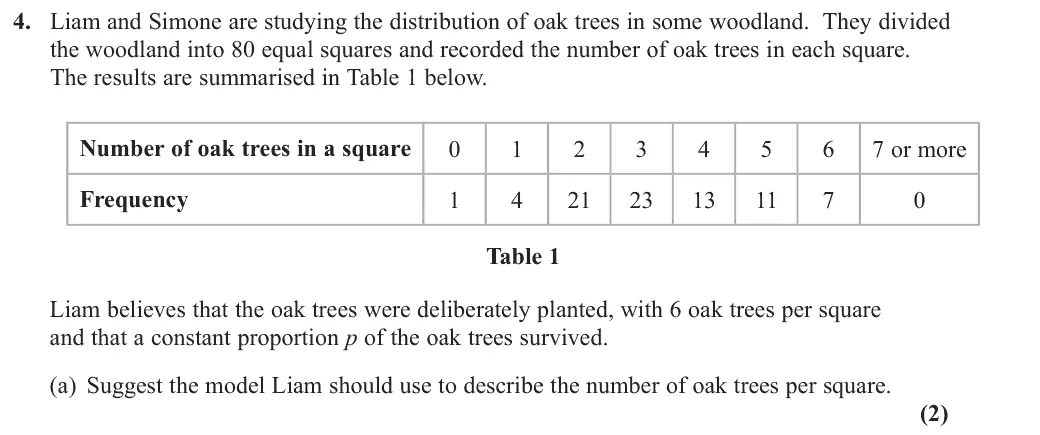
fixed 6 trees with constant survival probability: B(6, p)
some wrongly chose Poisson
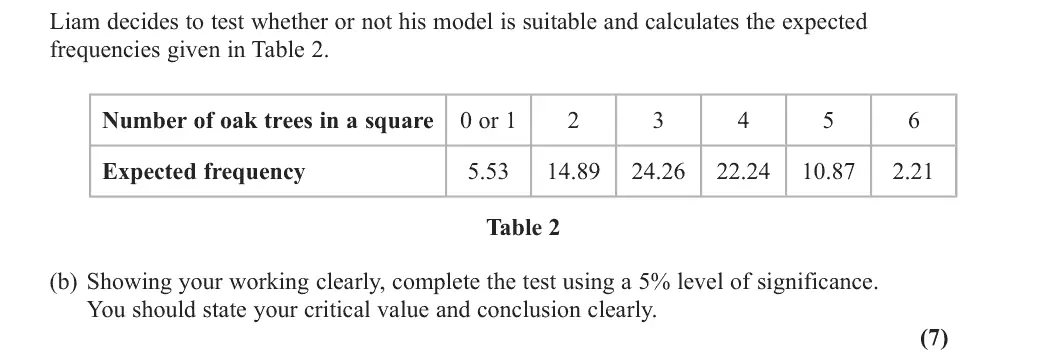
June 2019 · Paper 3B (Further Statistics 1) · Q4(b)7 marks
Mark scheme (whole question; this part is marked with the orange bar)
Examiner's comment
did think a Poisson was appropriate here. In part (b) the most common error was a failure to pool the last two classes and this often led to the test being carried out using 4 degrees of freedom and the subsequent acceptance of the binomial model. Part (c) though was answered very well with most
Key points from the mark scheme and examiner's report
pool the 6 class (E < 5) with 5: E = 13.08
X² = 8.313
ν = 5 − 2 = 3 (p estimated), cv 7.815
significant so Liam's binomial model not suitable
failing to pool (ν = 4) was the commonest error
June 2019 · Paper 3B (Further Statistics 1) · Q4(d)1 mark
Mark scheme (whole question; this part is marked with the orange bar)
Examiner's comment
In part (d) most candidates incorrectly quoted the value of the parameter; this was penalised in part (d) but condoned for the final mark of part (e). Part (e) was answered well but some used an incorrect value
Key points from the mark scheme and examiner's report
H0: a Poisson distribution is a good fit
H1: it is not
quoting Po(3.3) in the hypotheses is B0 (most lost this mark)
June 2019 · Paper 3B (Further Statistics 1) · Q4(e)3 marks
Mark scheme (whole question; this part is marked with the orange bar)
Examiner's comment
but condoned for the final mark of part (e). Part (e) was answered well but some used an incorrect value for the degrees of freedom. There were some good answers to the final part with many appreciating
Key points from the mark scheme and examiner's report
no pooling: ν = 6 − 2 = 4, cv 9.488
8.749 not significant, Poisson model suitable
wrong degrees of freedom common
June 2019 · Paper 3B (Further Statistics 1) · Q4(f)2 marks
Mark scheme (whole question; this part is marked with the orange bar)
Examiner's comment
for the degrees of freedom. There were some good answers to the final part with many appreciating that the suitability of the Poisson model suggested that the oak trees were randomly spread in the woodland and this would imply that it was wild and not cultivated. Whilst many thought that the woodland was probably wild some were unable to give a suitable reason based on the results of the tests.
Key points from the mark scheme and examiner's report
Poisson fits better so trees occur at random, so likely wild not cultivated
many gave no reason based on the tests
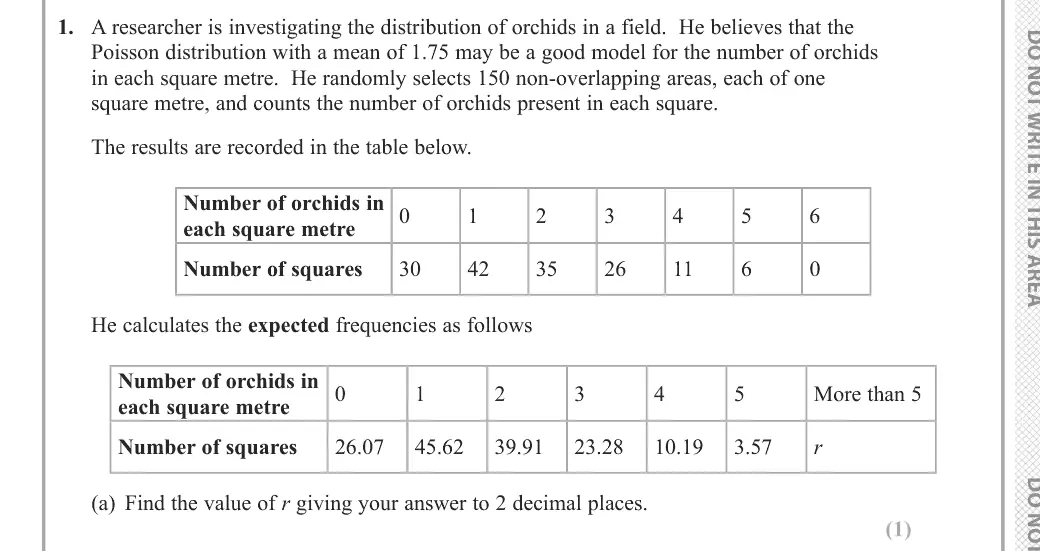
June 2018 · AS Paper 2 (Further Statistics 1) · Q1(a)1 mark
Mark scheme (whole question; this part is marked with the orange bar)
Examiner's comment
Part (a) was generally well answered. The most common error was to calculate X rather than do 150 minus the sum of other expected frequencies. P( 5) 150
Key points from the mark scheme and examiner's report
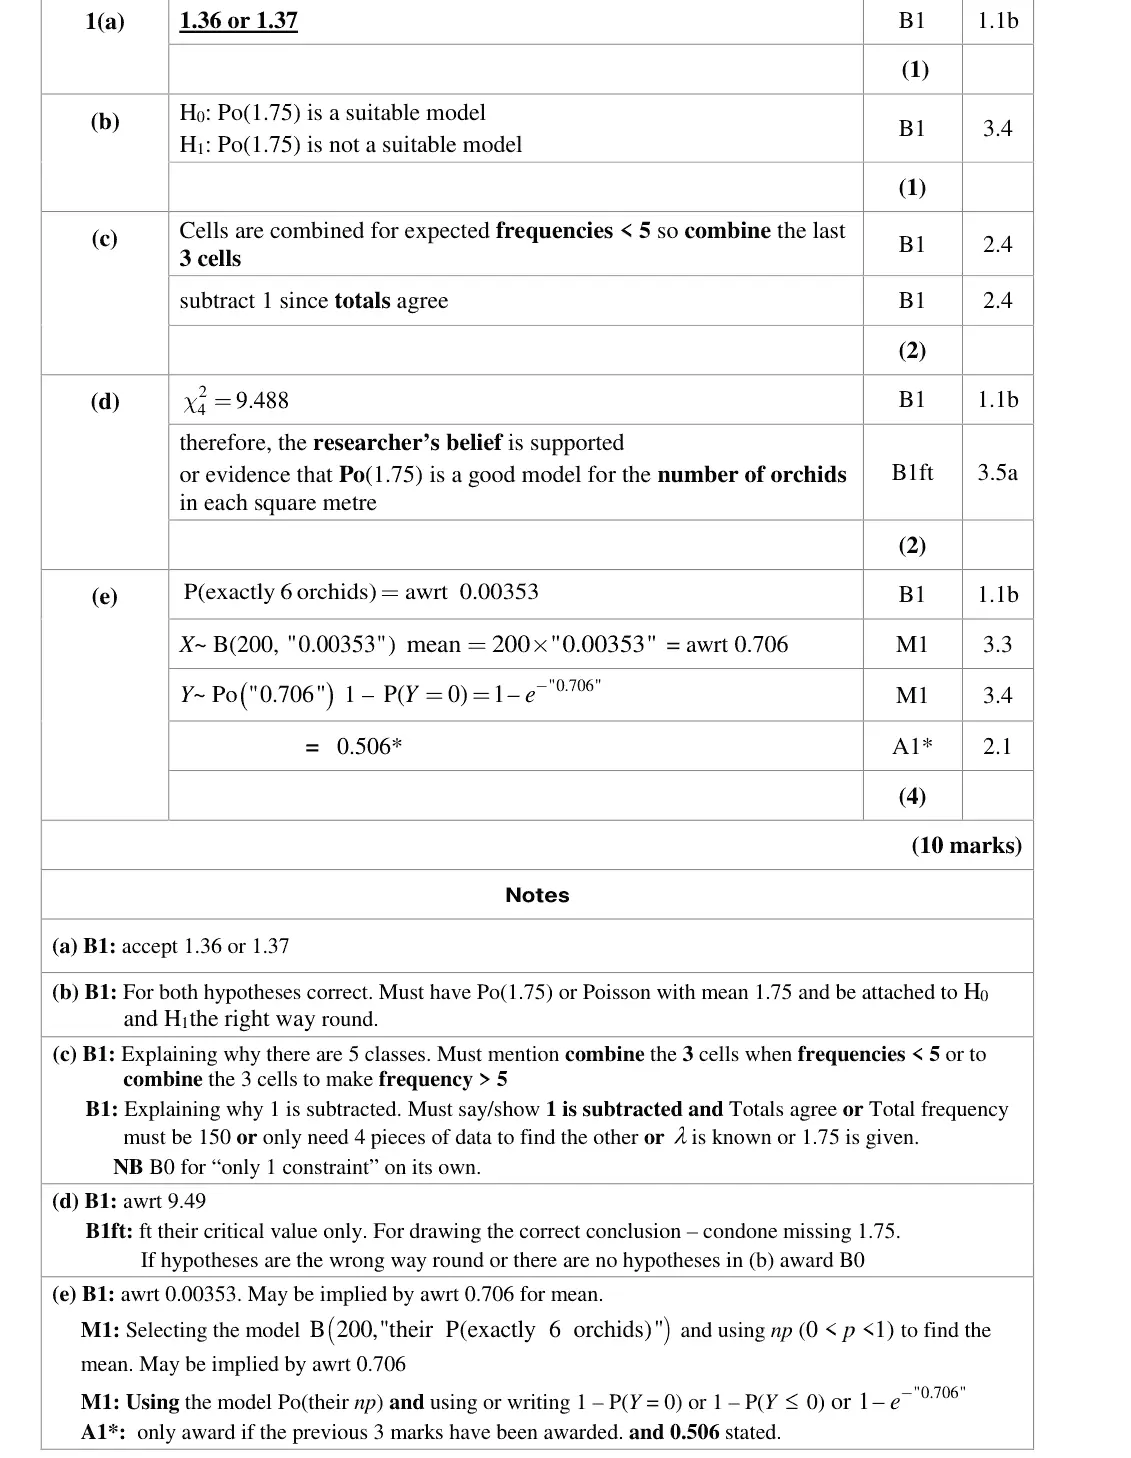
r = 150 minus the sum of the other expected frequencies = 1.36 or 1.37
common error was finding 150 × P(X > 5) instead
June 2018 · AS Paper 2 (Further Statistics 1) · Q1(b)1 mark
Mark scheme (whole question; this part is marked with the orange bar)
Examiner's comment
In part (b) we are not looking to see if the data can be modelled by a Poisson distribution but specifically whether it can be modelled by Po (1.75) so this must be included in the hypotheses. Part (c) not only tested if the candidate knew how to calculate the degrees of
Key points from the mark scheme and examiner's report
H₀: Po(1.75) is a suitable model, H₁: it is not
must name the mean 1.75, not just "Poisson"
June 2018 · AS Paper 2 (Further Statistics 1) · Q1(c)2 marks
Mark scheme (whole question; this part is marked with the orange bar)
Examiner's comment
hypotheses. Part (c) not only tested if the candidate knew how to calculate the degrees of freedom but also if they understood the reasons behind their calculation. The majority of students knew why groups were combined, although a minority did not mention in some form that it needed to be the last 3 columns which were combined. Few students were able to explain why one was subtracted. The most common reasons were because there is 1 constraint or because that is the rule rather than making reference to the fact the two totals have to agree or that the mean had been given and not estimated. Weaker students who were not confident in how to calculate the degrees of freedom often started with the premise that there were six groups rather than 7 probably not realising the first column was for zero orchids. In part d students had clearly been trained to recognise that the chi-squared distribution was required and were able to correctly state the value of 9.488 however, conclusions were very rarely in context, many simply referring to the data rather than the number of orchids.
Key points from the mark scheme and examiner's report
combine the last 3 cells because expected frequencies < 5, giving 5 classes
subtract 1 because the totals must agree (λ is given, not estimated)
"only 1 constraint" alone scores B0
few explained the subtraction
June 2018 · AS Paper 2 (Further Statistics 1) · Q1(d)2 marks
Mark scheme (whole question; this part is marked with the orange bar)
Examiner's comment
This proved to be one of the more difficult questions for the students. The question tests the students’ knowledge of the Poisson distribution alongside hypothesis tests which wer clearly familiar to them but their answers lacked the required detail.
Key points from the mark scheme and examiner's report
critical value χ²₄(5%) = 9.488
2.0 < 9.488 so do not reject: Po(1.75) is a suitable model for the number of orchids per square metre
conclusions rarely in context
June 2018 · AS Paper 2 (Further Statistics 1) · Q47 marks
Mark scheme (whole question; this part is marked with the orange bar)
Examiner's comment
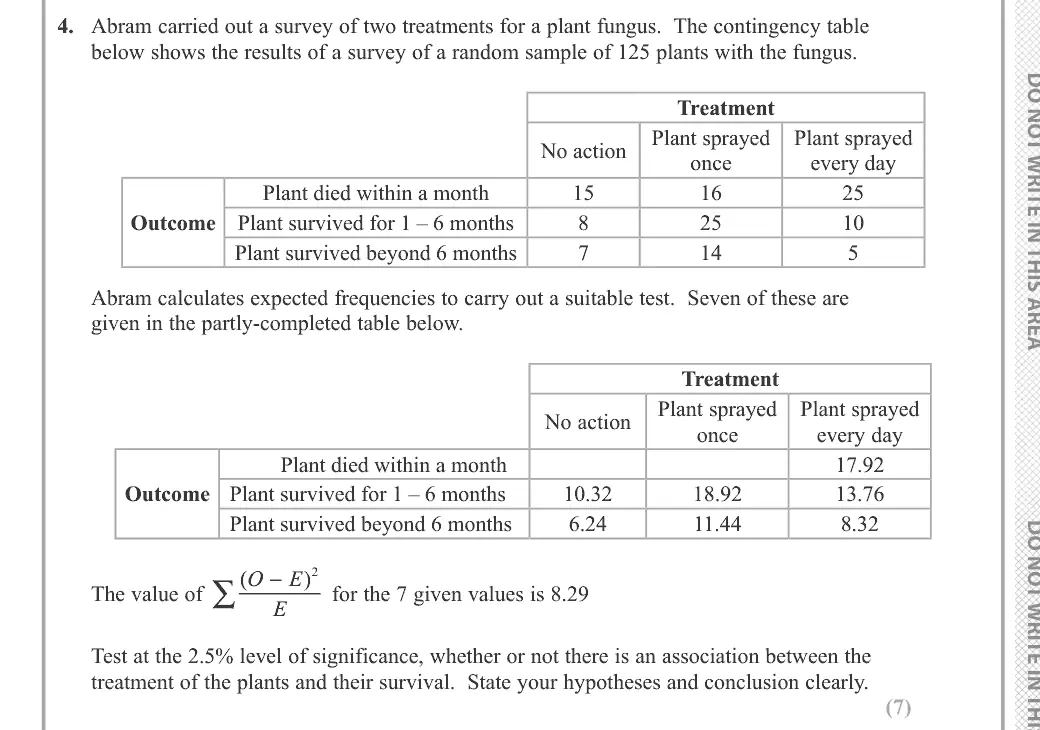
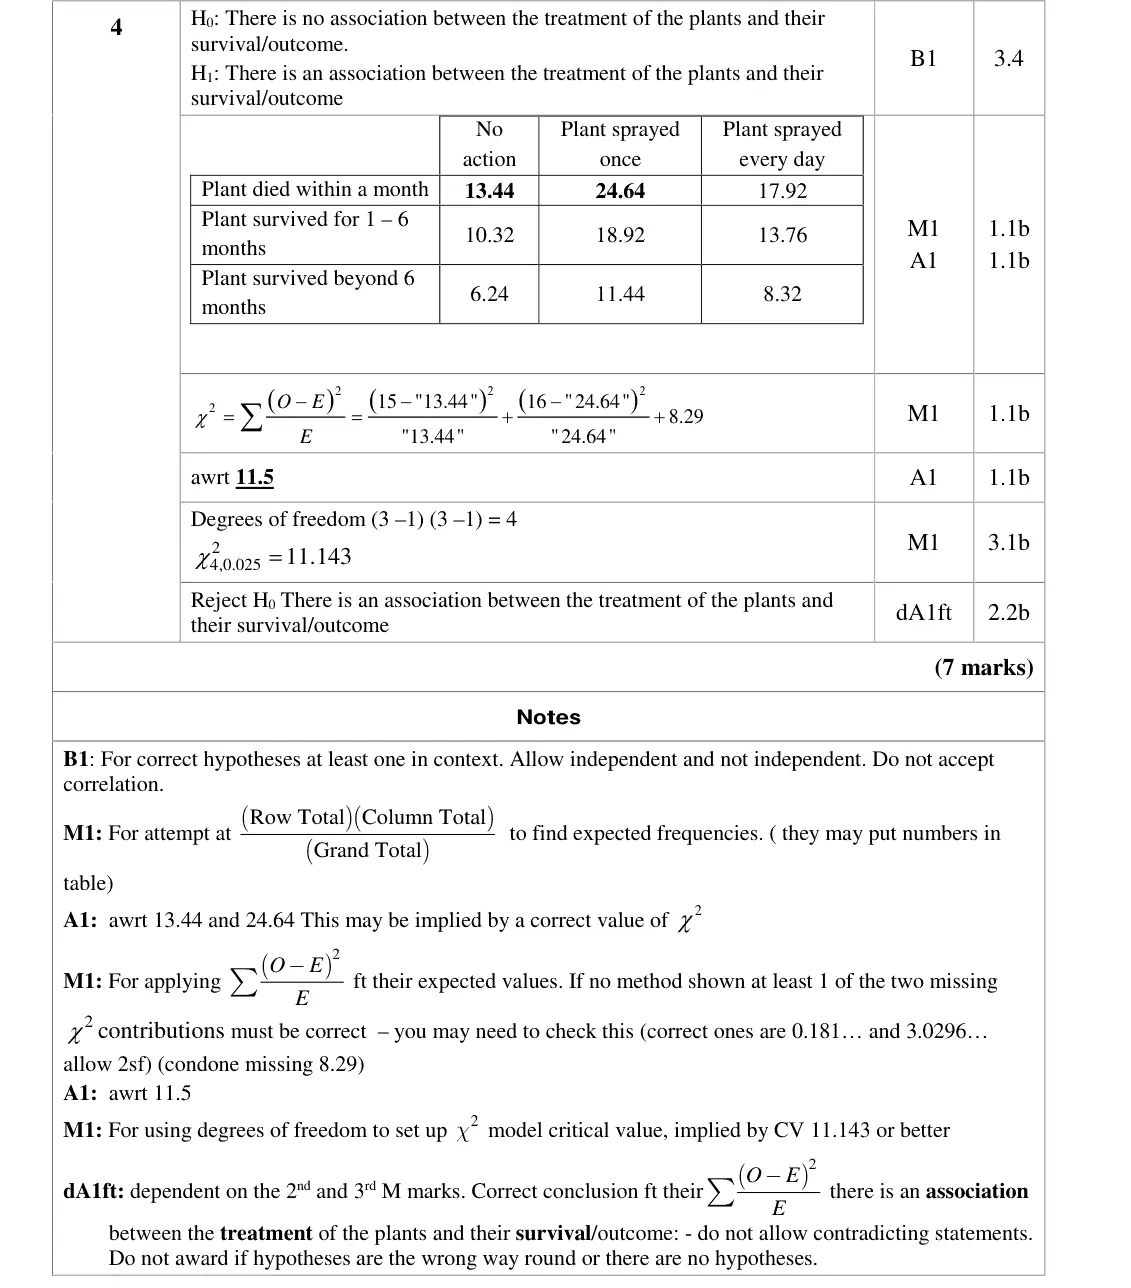
It was clear from the candidate’s solutions that they knew how to use a chi-squared test on a contingency table. However, the most common error was having the hypotheses the wrong way around. The majority of students had little trouble in calculating the missing expected values but a minority did not realise that the 8.29 given in the question did not include these values and lost unnecessary marks. Others worked out 2 O E for the 2 values and added this to the 8.29
Key points from the mark scheme and examiner's report
H₀: no association between treatment and survival
missing expected values 13.44 and 24.64 (row total × column total ÷ 125)