Notes, worked examples and practice for this topic are being written by our tutors. The past-paper questions below are ready now: work each one on paper, then open the mark scheme and the examiner's comment.
Tap a question to zoom it. Mark scheme and examiner's comment open under each question.
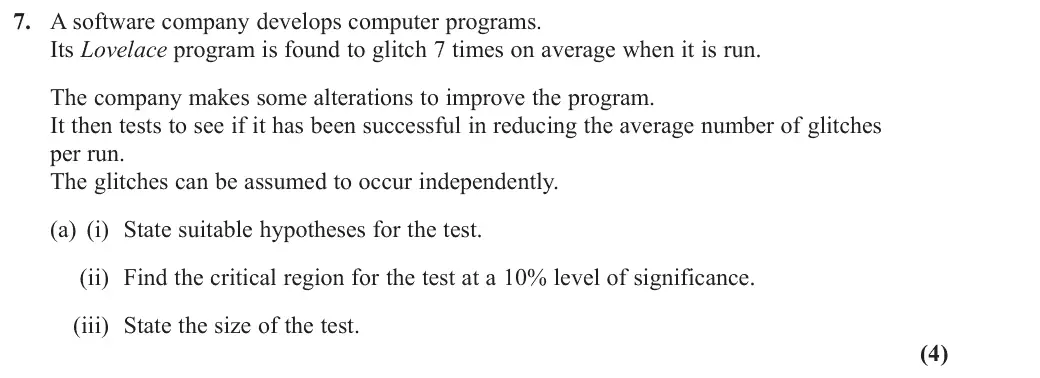
June 2025 · Paper 3B (Further Statistics 1) · Q7(a)4 marks
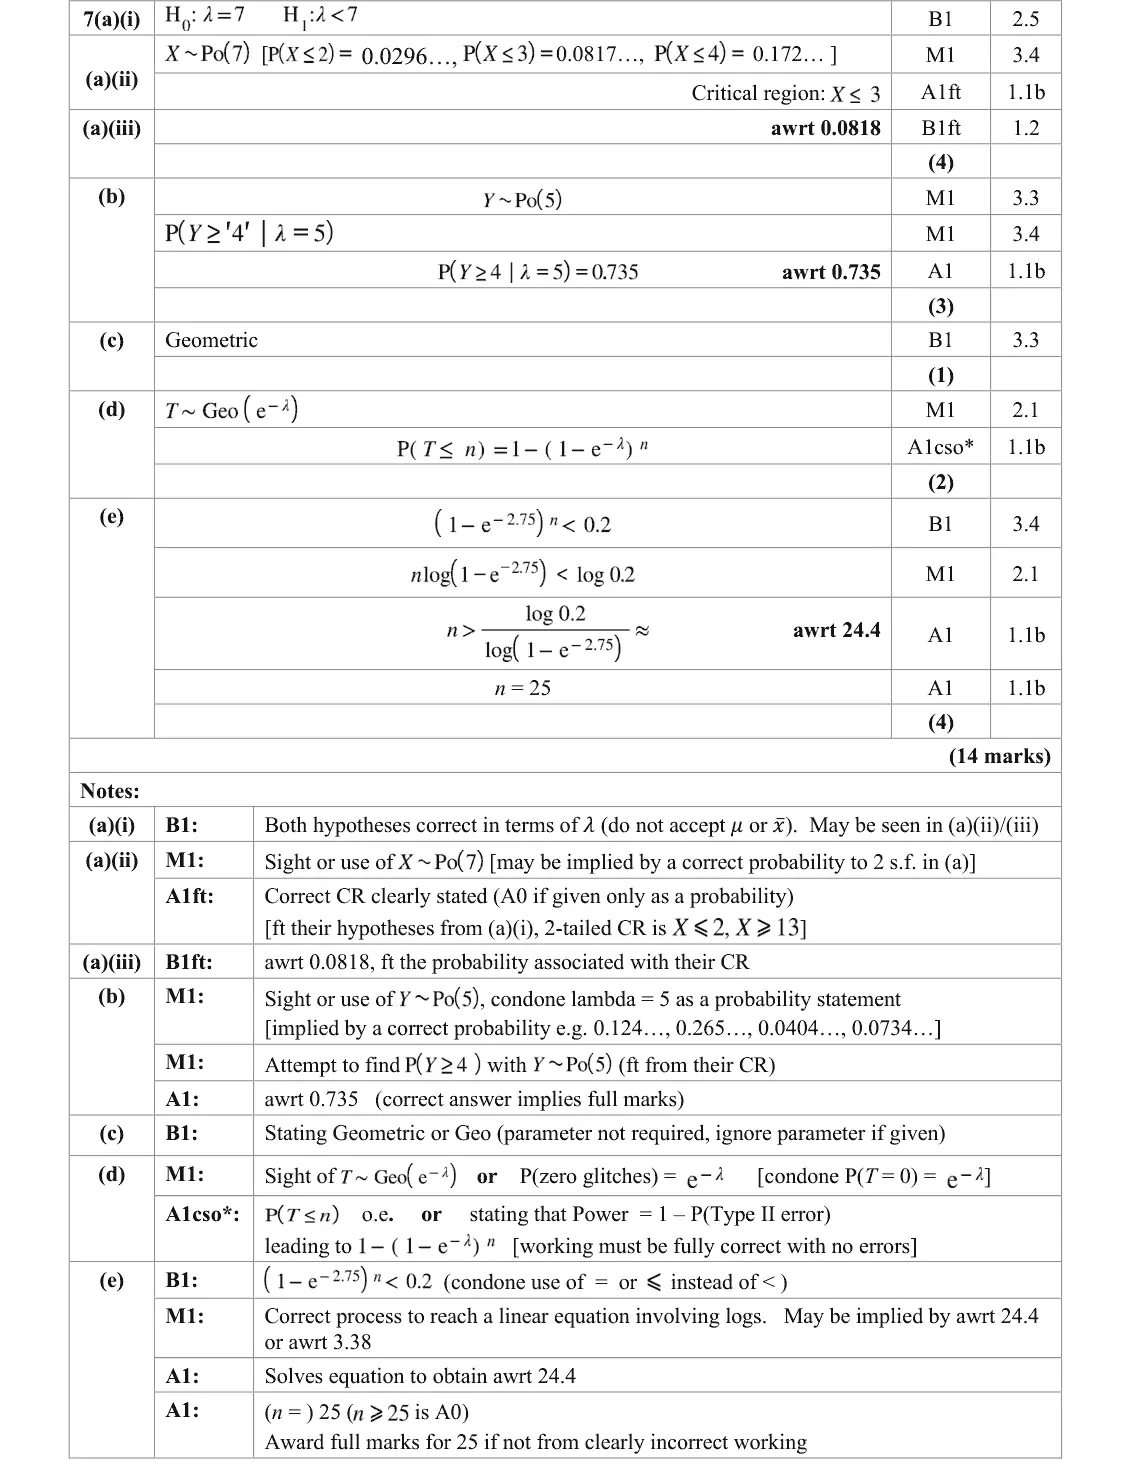
Mark scheme (whole question; this part is marked with the orange bar)
Examiner's comment
In general, candidates scored well in this question, with the exception of part (d), which was very challenging. The great majority of candidates gave the hypotheses in the required form in part (a)(i), although there were some which were expressed in words only. A very small minority a different symbol, which was not accepted for this part. Similarly, most candidates used the appropriate Poisson distribution and gave a correct critical region to score both marks in (a)(ii), with a small minority leaving it expressed within a probability statement, hence losing the final mark. In part (a)(iii) the correct size of the test was given by almost all candidates; there was occasionally a loss of accuracy.
Key points from the mark scheme and examiner's report
H0: λ = 7, H1: λ < 7
Po(7) CR X ≤ 3
size 0.0818
CR not as a probability statement
June 2025 · Paper 3B (Further Statistics 1) · Q7(b)3 marks
Mark scheme (whole question; this part is marked with the orange bar)
Examiner's comment
In general, candidates scored well in this question, with the exception of part (d), which was very challenging. Part (b) proved more challenging for candidates. Almost all scored the first mark for using or stating the correct distribution, but many candidates only scored this mark. Many candidates failed to realise the acceptance region was required and instead used the critical region. Another group of candidates realised the acceptance region was required but did not alter the probability statement correctly and were unable to gain further marks on this part. However, a good number of candidates understood what was required and scored full marks.
Key points from the mark scheme and examiner's report
Po(5): P(Type II) = P(Y ≥ 4) = 0.735
using the CR instead of the acceptance region was common
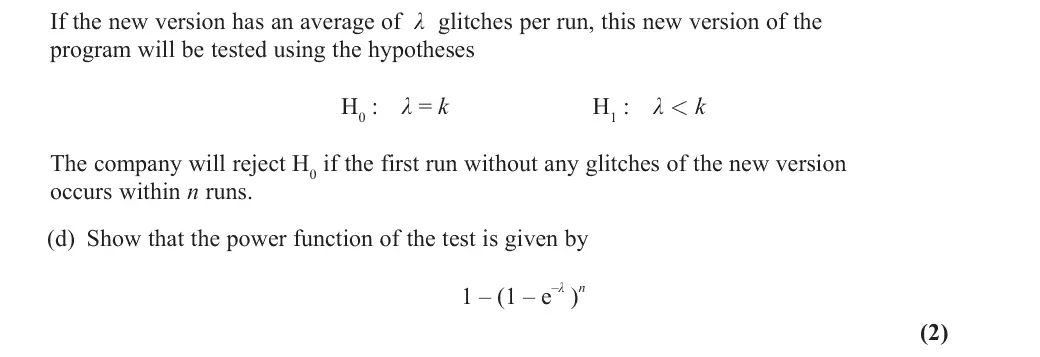
June 2025 · Paper 3B (Further Statistics 1) · Q7(d)2 marks
Mark scheme (whole question; this part is marked with the orange bar)
Examiner's comment
In general, candidates scored well in this question, with the exception of part (d), which was very challenging. Part (d) was understandably challenging for the candidates as these were high demand marks. The question was complex in terms of the context as well as the statistical knowledge required. Many candidates chose to concentrate on the given answer and work backwards from it, instead of working from first principles. This approach did not seem to be helpful to candidates and often resulted in seemingly random probability statements being written down with no coherent pattern to force the answer. Candidates who approached the question without working backwards often latched on to the crucial first step of realising that the previous part suggested that a Geometric distribution is the appropriate model to use, and, given that, to determine its parameter, p. Leading them to the next step of establishing that the parameter, p, the probability of number glitches in a run, as e-λ . Therefore, a good number of candidates did gain the first mark in part (d). A reasonably number did indeed go on to give a correct probability statement leading to the given answer and gain the final mark. A minority of candidates gained both marks by stating that Power = 1 – P(Type II error).
Key points from the mark scheme and examiner's report
P(run has no glitches) = e^(−λ) so T ~ Geo(e^(−λ))
power = P(T ≤ n) = 1 − (1 − e^(−λ))ⁿ
working backwards from the answer failed
June 2025 · Paper 3B (Further Statistics 1) · Q7(e)4 marks
Mark scheme (whole question; this part is marked with the orange bar)
Examiner's comment
In general, candidates scored well in this question, with the exception of part (d), which was very challenging. Part (e) saw candidates back surer ground, as the previous part having a given answer provided a reset. The majority of candidates wrote down the required inequality, solved it correctly using logs, dealt with the inequality sign correctly, finally choosing the correct value of n to score full marks. The most common error was to solve an inequality involving 0.8 instead of the correct 0.2, but most of these candidates were still able to gain a method mark for the correct use of logs in solving their equation. A few candidates made algebraic errors while solving and only gained the first mark, and a few did not fully answer the question and left their answer as an inequality, losing the final mark.
Key points from the mark scheme and examiner's report
P(Type II) = (1 − e^(−2.75))ⁿ < 0.2
logs give n > 24.4 so n = 25
using 0.8 instead of 0.2
leaving an inequality
June 2024 · Paper 3B (Further Statistics 1) · Q2(c)1 mark
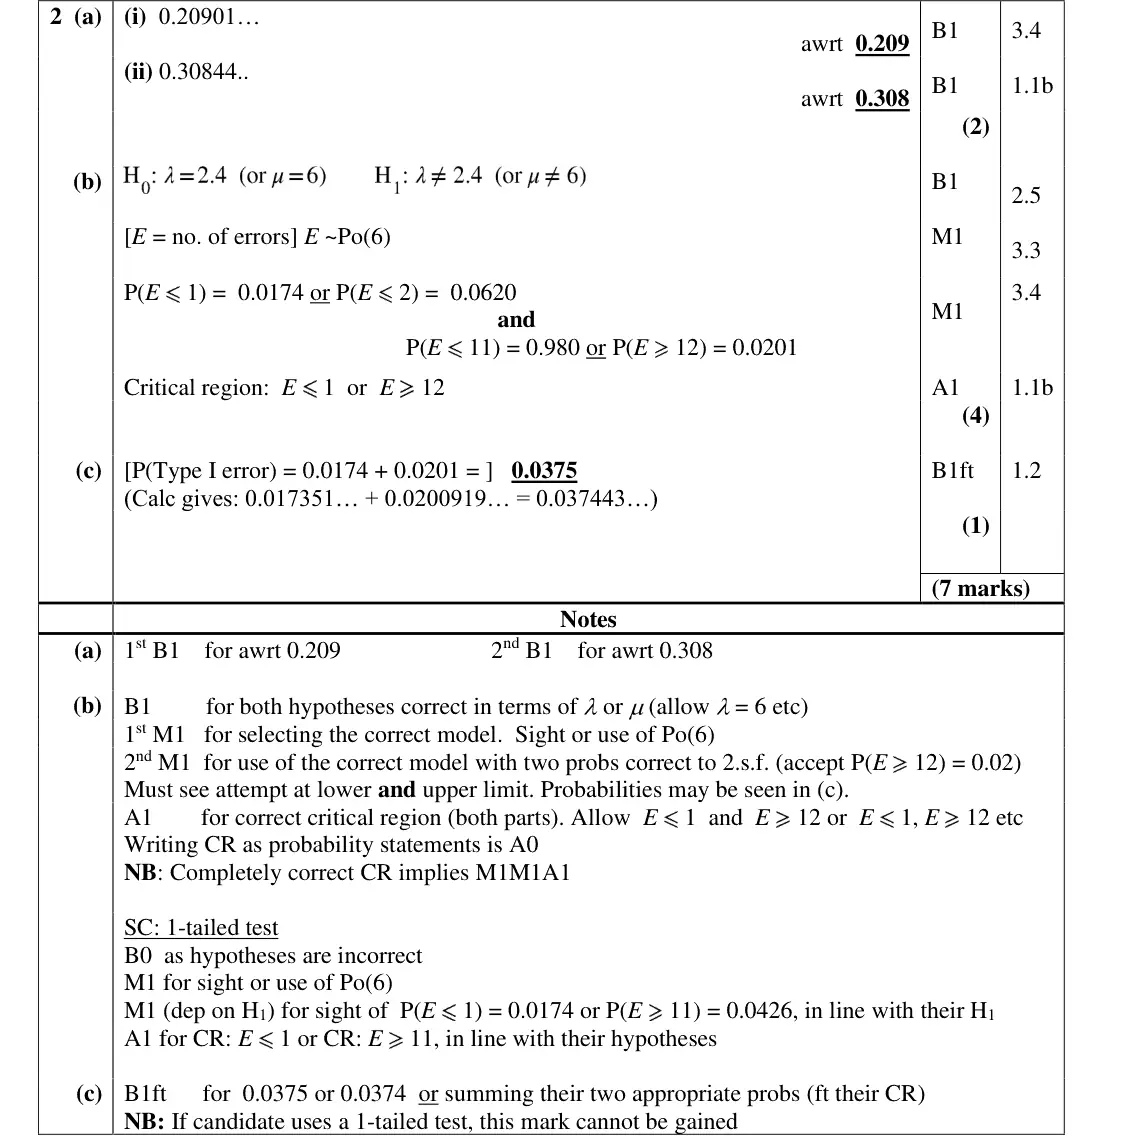
Mark scheme (whole question; this part is marked with the orange bar)
Examiner's comment
This question covered some familiar topics. Since the question did not require candidates to give the tail probabilities explicitly, almost all candidates gained full marks on this question as they tended to use their calculators to find the critical region and stating this was sufficient
Key points from the mark scheme and examiner's report
size = 0.0174 + 0.0201 = 0.0375, not simply 5%
June 2024 · Paper 3B (Further Statistics 1) · Q5(a)1 mark
Mark scheme (whole question; this part is marked with the orange bar)
Examiner's comment
This question was the first on the paper to cause any real issues to most candidates. It covered an aspect of the specification which tends to not be as well answered as others: Quality of Tests. Part (a) was very routine. A nice beginning to the question, and almost all candidates gained the mark.
Key points from the mark scheme and examiner's report
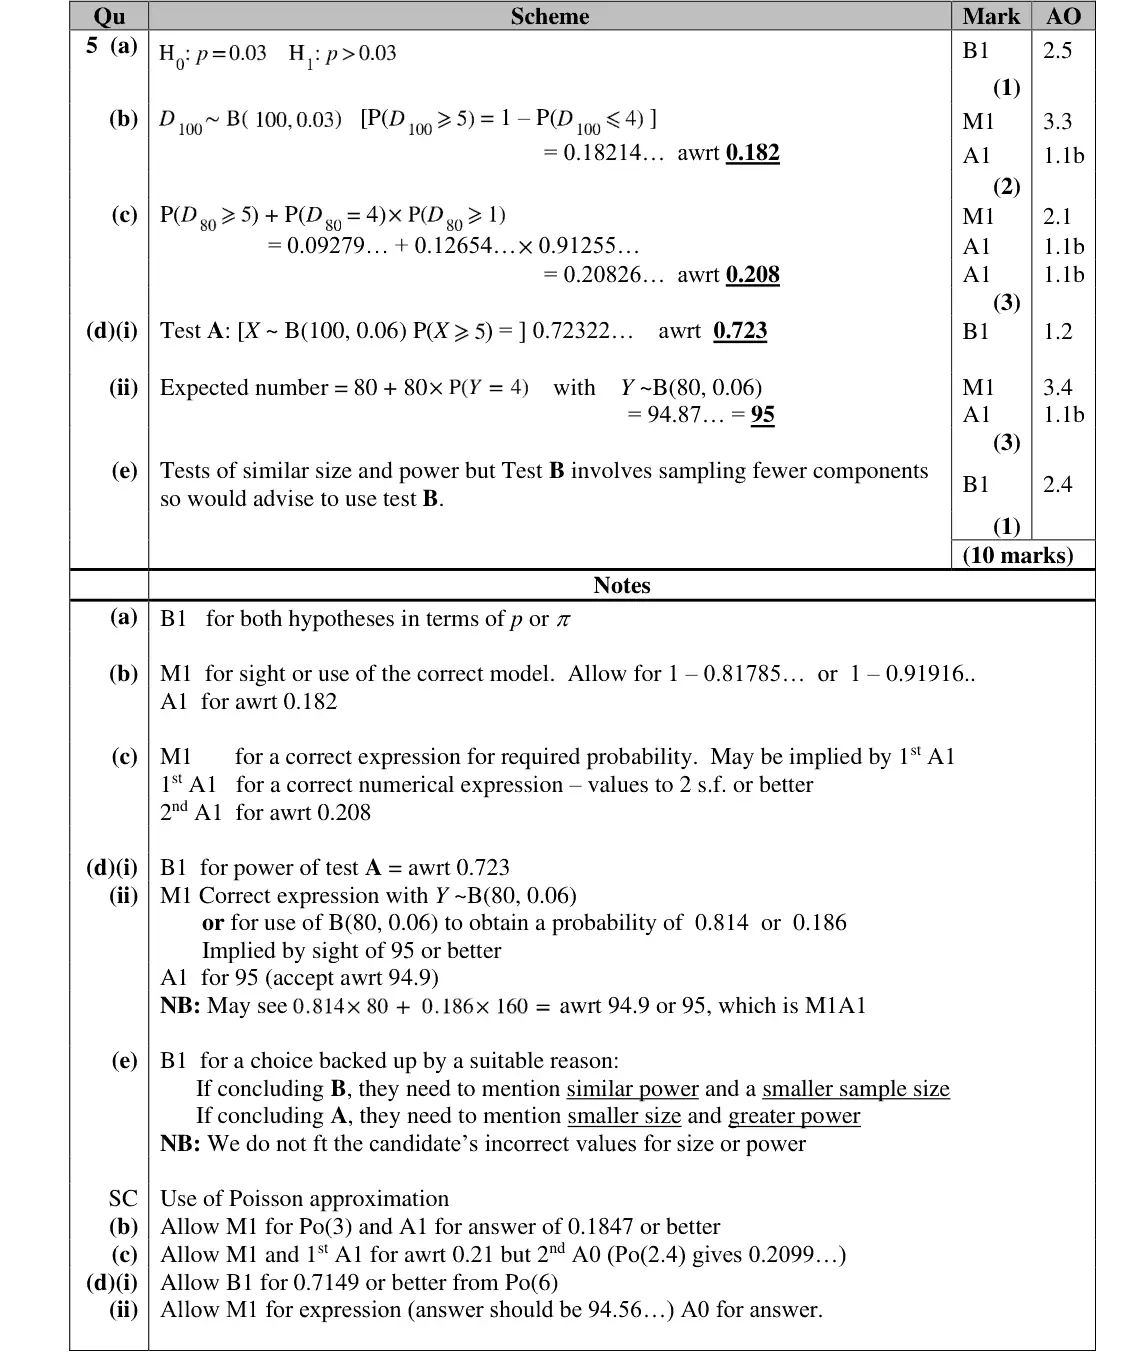
H0: p = 0.03, H1: p > 0.03
June 2024 · Paper 3B (Further Statistics 1) · Q5(b)2 marks
Mark scheme (whole question; this part is marked with the orange bar)
Examiner's comment
This question was the first on the paper to cause any real issues to most candidates. It covered an aspect of the specification which tends to not be as well answered as others: Quality of Tests. Part (b) was also quite straightforward. Candidates tended to gain the marks on this part, showing that most do understand what is meant by the size of a test.
Key points from the mark scheme and examiner's report
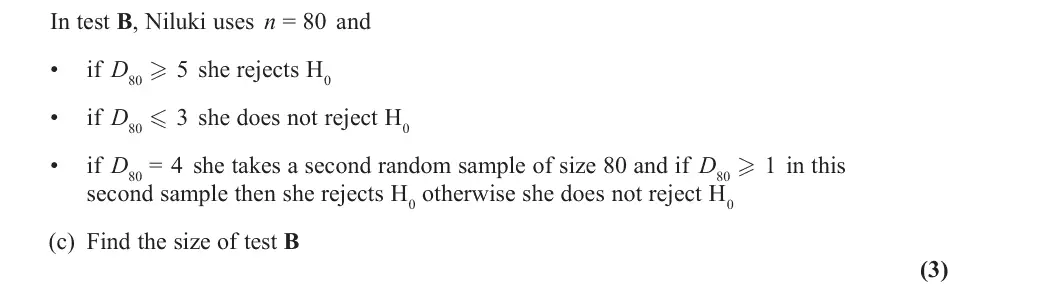
size = P(D ≥ 5) for B(100, 0.03) = 0.182
June 2024 · Paper 3B (Further Statistics 1) · Q5(c)3 marks
Mark scheme (whole question; this part is marked with the orange bar)
Examiner's comment
This question was the first on the paper to cause any real issues to most candidates. It covered an aspect of the specification which tends to not be as well answered as others: Quality of Tests. Part (c) was more challenging but candidates still coped well in general, with most gaining the marks. The importance of showing their working was brought to the fore, as a good number of candidates struggled to retain accuracy until their final answer – but those that showed their method clearly gained 2/3 marks. Overall, the candidates were generally able to understand the context of the question, use the correct distribution, and have a good attempt at completing the question. Marks tended to be lost through poor execution rather than lack of understanding.
Key points from the mark scheme and examiner's report
June 2024 · Paper 3B (Further Statistics 1) · Q5(d)3 marks
Mark scheme (whole question; this part is marked with the orange bar)
Examiner's comment
This question was the first on the paper to cause any real issues to most candidates. It covered an aspect of the specification which tends to not be as well answered as others: Quality of Tests. Part (d)(i) was answered correctly in general, again showing that candidates understand what is meant by power and size. However, part (d)(ii) caused candidates problems. It appeared that many did not perhaps think deeply enough, saw ‘expected value’, and immediately used E(X) = np – gaining them no marks. Candidates did tend to use the correct distribution, but they needed to find a correct probability to gain any marks. Therefore, most candidates scored zero on this part of the question.
Key points from the mark scheme and examiner's report
(i) power of A: P(X ≥ 5) for B(100, 0.06) = 0.723
(ii) 80 + 80 × P(Y = 4) with Y ~ B(80, 0.06) = 94.9 (95)
using np gained nothing
most scored 0 on (ii)
June 2024 · Paper 3B (Further Statistics 1) · Q5(e)1 mark
Mark scheme (whole question; this part is marked with the orange bar)
Examiner's comment
This question was the first on the paper to cause any real issues to most candidates. It covered an aspect of the specification which tends to not be as well answered as others: Quality of Tests. Part (e) was very demanding, and really tested the candidate’s knowledge of the implications of size and power on the quality of a test. Most candidates, perhaps superficially, saw that the power of Test A was higher and concluded that therefore this test was the best to use. A more nuanced approach was required, either looking at size and power to conclude Test A, or to also consider number of components sampled to conclude Test B. Almost no candidates chose to conclude using the latter reasoning, most who answered correctly chose Test A. A small number of candidates used a Poisson approximation - those who did tended to follow this method correctly. They could gain 6/8 marks using this approach, but since most candidates in general were not gaining the marks in (d)(ii) the use of a Poisson Approximation tended to effectively just lose a candidate one extra mark.
Key points from the mark scheme and examiner's report
either B: similar size and power but fewer components sampled, or A: smaller size and greater power
"A has higher power" alone scores 0
June 2023 · Paper 3B (Further Statistics 1) · Q5(a)4 marks
Mark scheme (whole question; this part is marked with the orange bar)
Examiner's comment
Though there were some good attempts seen here, premature rounding was the main issue. Part (a) was a standard request to find the critical region for the test statistic X , and presented few difficulties to students. The hypotheses, when written, were nearly always correct, with candidates invariably using a N(330, 82/25) distribution. The critical value of 327.368... was usually obtained from a calculator, but a small minority then forgot to state the critical region as an inequality. Occasionally, for those showing a standardisation, some equated it to –1.96 instead of –1.6449. The concept of a Type I error was well known in part (b) and examiners frequently saw a split between those candidates who found P(Type II error) for part (a) and those who found this probability for the test in part (b). Of those who chose the requested option, premature mistakenly calculated the power of the test in part (a).
Key points from the mark scheme and examiner's report
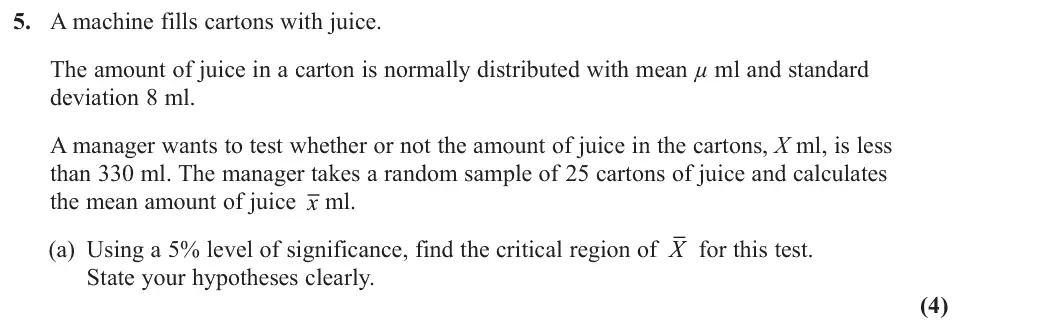
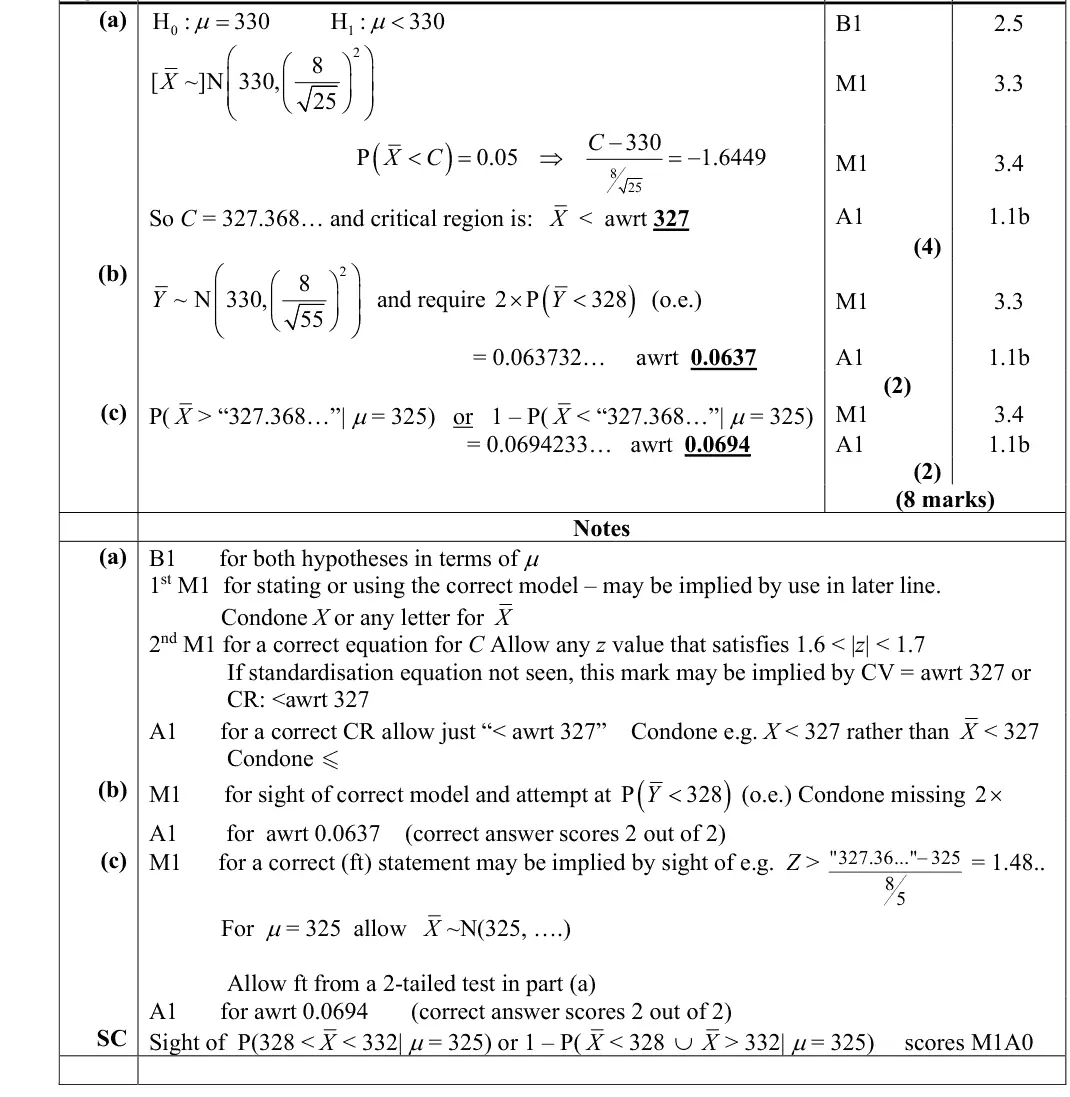
A-level normal mean test as the setting: H0: μ = 330, H1: μ < 330
June 2023 · Paper 3B (Further Statistics 1) · Q5(b)2 marks
Mark scheme (whole question; this part is marked with the orange bar)
Examiner's comment
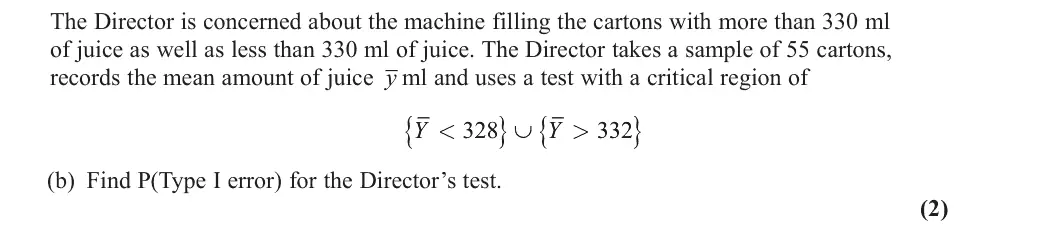
Though there were some good attempts seen here, premature rounding was the main issue. The concept of a Type I error was well known in part (b) and examiners frequently saw a correct answer of 0.063. Premature approximation did cause a sizeable number of candidates to lose the accuracy mark, writing 2 x 0.0319 = 0.0638 Although the concept of a Type II error was well known, there was an approximately equal split between those candidates who found P(Type II error) for part (a) and those who found this probability for the test in part (b). Of those who chose the requested option, premature rounding of 327.368... often spoilt an otherwise good solution. Occasionally, students mistakenly calculated the power of the test in part (a).
Key points from the mark scheme and examiner's report
Ȳ ~ N(330, 8²/55)
P(Type I) = 2P(Ȳ < 328) = 0.0637
premature rounding (2 × 0.0319)
June 2023 · Paper 3B (Further Statistics 1) · Q5(c)2 marks
Mark scheme (whole question; this part is marked with the orange bar)
Examiner's comment
Though there were some good attempts seen here, premature rounding was the main issue.
Key points from the mark scheme and examiner's report
test in (a), not (b): P(X̄ > 327.368… given μ = 325) = 0.0694
about half used the Director's test
power given instead
June 2022 · Paper 3B (Further Statistics 1) · Q7(a)4 marks
Mark scheme (whole question; this part is marked with the orange bar)
Examiner's comment
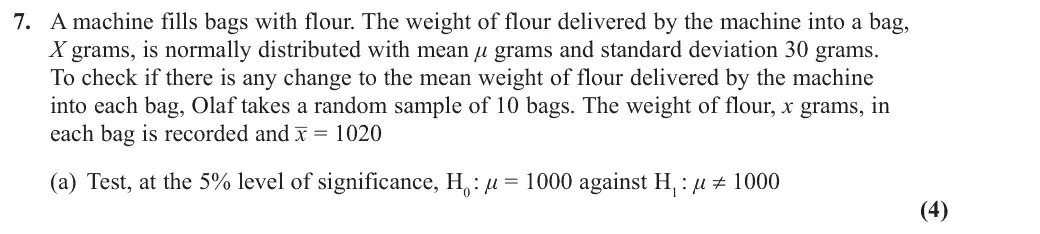
This was the most difficult question on the paper and just over 10% of candidates made no progress however nearly 30% did achieve 10 or more marks. A few students seemed surprised at seeing a normal distribution question on this paper (despite handling it comfortably in question 5) and one or two tried to change it to a discrete distribution. Most though realised that this was a standard hypothesis test from the A level specification and were able to find the correct probability and state that it was significant though some lost the last mark for
Key points from the mark scheme and examiner's report
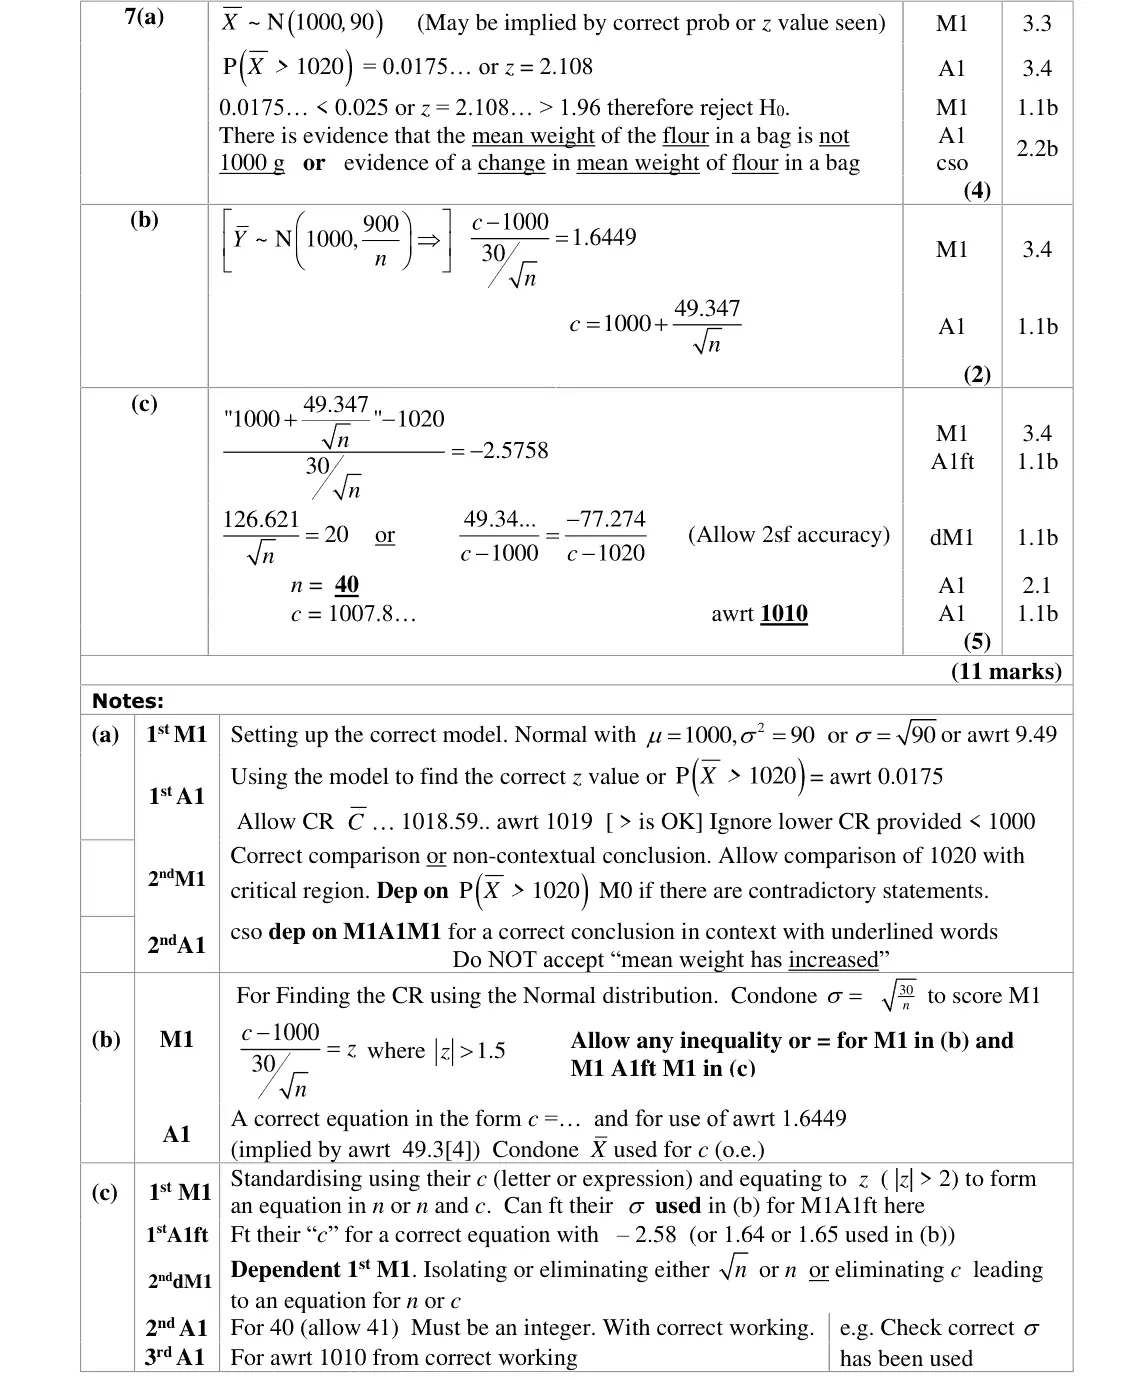
A-level normal mean test as the setting: X̄ ~ N(1000, 90)
P(X̄ > 1020) = 0.0175 < 0.025 (two-tailed) so reject H0: evidence the mean weight has changed (not "increased")
June 2022 · Paper 3B (Further Statistics 1) · Q7(b)2 marks
Mark scheme (whole question; this part is marked with the orange bar)
Examiner's comment
failing to express their conclusion precisely enough in context. Part (b) proved a little more difficult but a good number of students knew how to go about finding a critical value though sometimes the z- value used was not accurate enough (students should either use the value in the tables or show in their subsequent working that they have used a value that is at least as accurate as the tables). Some did not heed the requirement to find an equation for c in terms of n. The mention of a Type II error clearly stumped some and so part (c) was often not attempted. Those who knew what a Type II error
Key points from the mark scheme and examiner's report
(c − 1000)/(30/√n) = 1.6449 so c = 1000 + 49.347/√n
z must be accurate to table values
June 2022 · Paper 3B (Further Statistics 1) · Q7(c)5 marks
Mark scheme (whole question; this part is marked with the orange bar)
Examiner's comment
clearly stumped some and so part (c) was often not attempted. Those who knew what a Type II error was could usually make a correct start but the common problem was failing to appreciate that if P(Z < a) = 0.0050 then a must be negative and many solutions used a z-value of + 2.5758 rather than – 2.5758. A number struggled with the algebraic manipulation required to isolate n or c and a few did not realise that n needed to be an integer and some forgot to state their value of c.
Key points from the mark scheme and examiner's report
P(Type II) = P(X̄ < c given μ = 1020) = 0.0050 so (c − 1020)/(30/√n) = −2.5758
solve: n = 40, c = 1010
using +2.5758 was the commonest error
n must be an integer
Nov 2021 · Paper 3B (Further Statistics 1) · Q5(f)3 marks
Mark scheme (whole question; this part is marked with the orange bar)
Examiner's comment
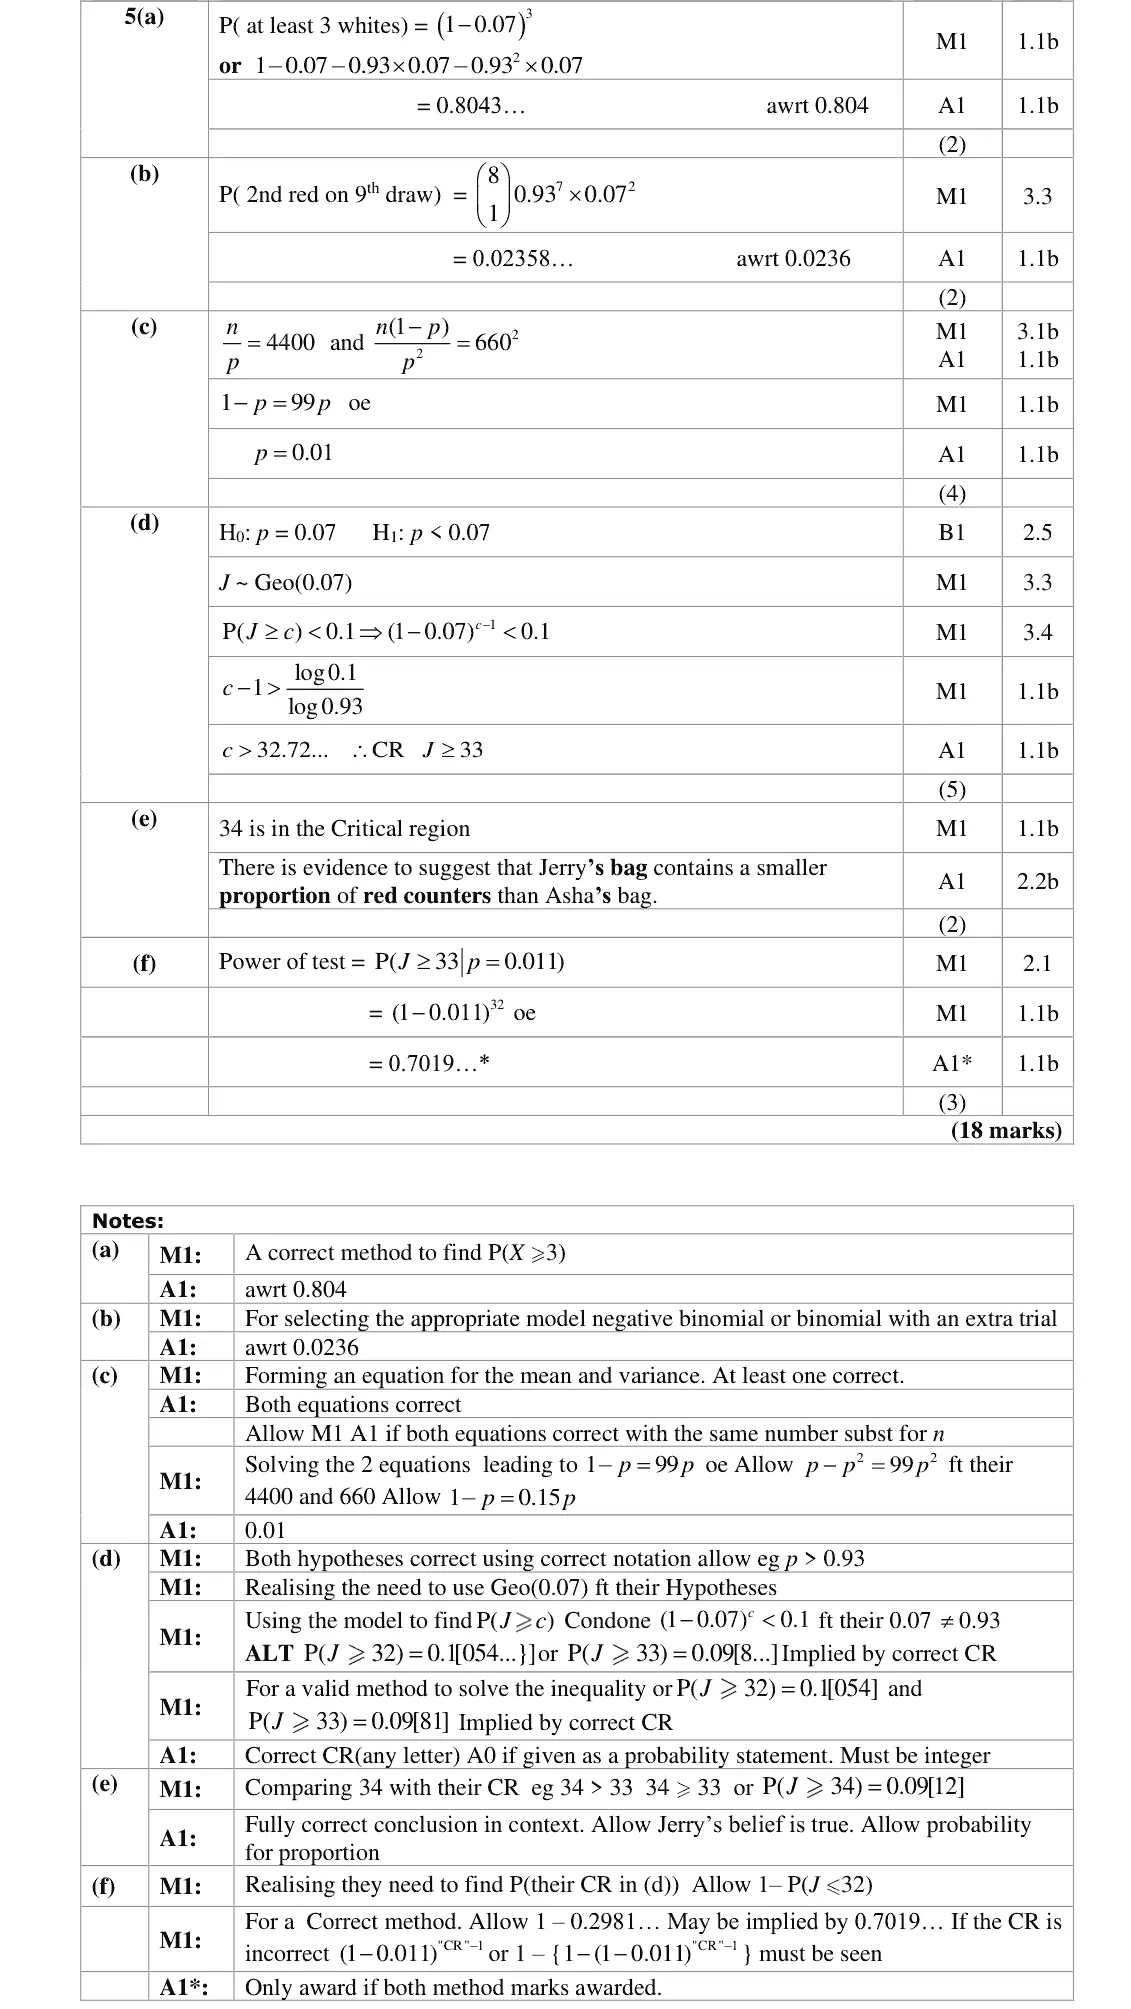
Those candidates who got the wrong critical region in part (d) were able to gain the method marks in part (f) if they showed their working clearly. When the answer is given in the question it is always wise for candidates to check that their calculation gives the required answer rather than just assume it does. As it is a "show that" question the method needs to be clear and in order to show that the answer given is 0.702 to 3 significant figures the answer should be given to at least 4 significant figures.
Key points from the mark scheme and examiner's report
power = P(J ≥ 33 given p = 0.011) = 0.989³² = 0.7019
give 4 s.f. to show 0.702
Nov 2021 · Paper 3B (Further Statistics 1) · Q7(a)1 mark
Mark scheme (whole question; this part is marked with the orange bar)
Examiner's comment
Candidates who answered part (a) knew what was required and gained the mark.
Key points from the mark scheme and examiner's report
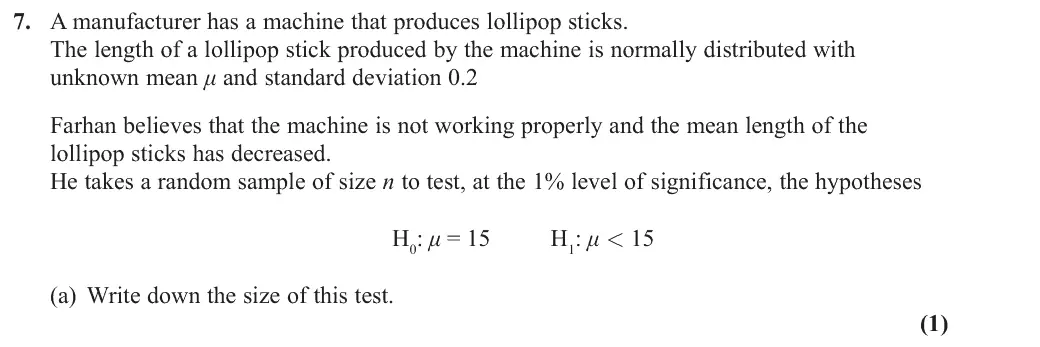
size = significance level = 0.01
Nov 2021 · Paper 3B (Further Statistics 1) · Q7(b)(i)6 marks
Mark scheme (whole question; this part is marked with the orange bar)
Examiner's comment
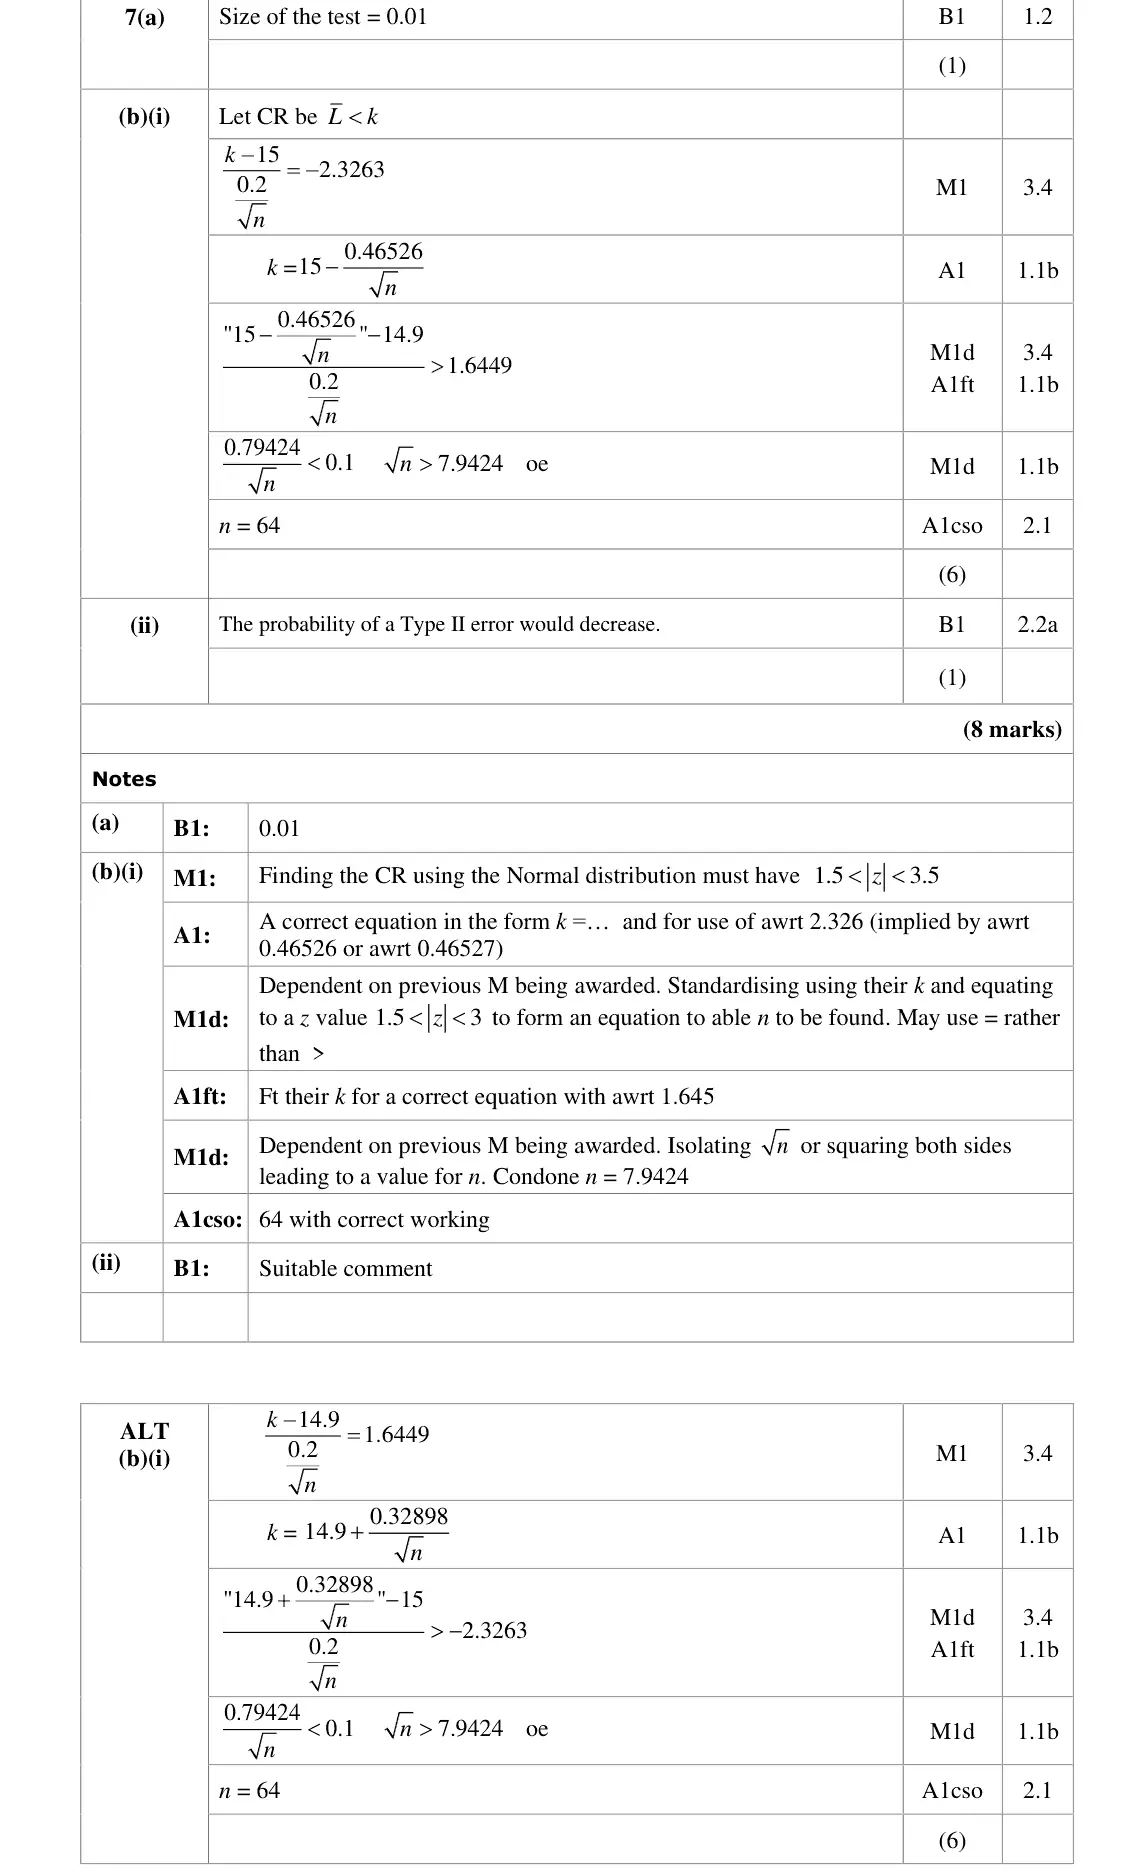
Part (b) was the most demanding question on the paper and very few candidates were able to form either equation needed to be able to find the value of n. The most common error was to15 14.9 - . Some also used 0.2 n rather than value z = 0.2 n 0.2 n Even if the candidate was not able to do part (b) they were able to attempt part(c). It was pleasing to see that many did attempt it but very few knew that it would decrease.
Key points from the mark scheme and examiner's report
CR L̄ < k with k = 15 − 2.3263 × 0.2/√n
P(Type II) = P(L̄ > k given μ = 14.9) < 0.05 gives 0.79424/√n < 0.1, n = 64
most demanding part, few formed either equation
Nov 2021 · Paper 3B (Further Statistics 1) · Q7(b)(ii)1 mark
Mark scheme (whole question; this part is marked with the orange bar)
Examiner's comment
Candidates who answered part (a) knew what was required and gained the mark. Part (b) was the most demanding question on the paper and very few candidates were able to form either equation needed to be able to find the value of n. The most common error was to15 14.9 - . Some also used 0.2 n rather than value z = 0.2 n 0.2 n Even if the candidate was not able to do part (b) they were able to attempt part(c). It was pleasing to see that many did attempt it but very few knew that it would decrease.
Key points from the mark scheme and examiner's report
larger significance level enlarges the CR, so P(Type II error) decreases
few said decrease
Oct 2020 · Paper 3B (Further Statistics 1) · Q1(c)5 marks
Mark scheme (whole question; this part is marked with the orange bar)
Examiner's comment
Part (c) was far more challenging for many. Most gained some access by understanding the need to use Po(4) as the true distribution but often they used this distribution to try and identify the critical region. Many looked for a right-hand critical region not realising that 1 in five minutes is a lower rate than 2 in five minutes. Many did not make their method clear. If they had more explicitly identified what they thought was the critical region, then further credit may have been gained. A few blank responses were seen here.
Key points from the mark scheme and examiner's report
common errors: finding the CR from Po(4) or using a right-hand CR
Oct 2020 · Paper 3B (Further Statistics 1) · Q7(c)3 marks
Mark scheme (whole question; this part is marked with the orange bar)
Examiner's comment
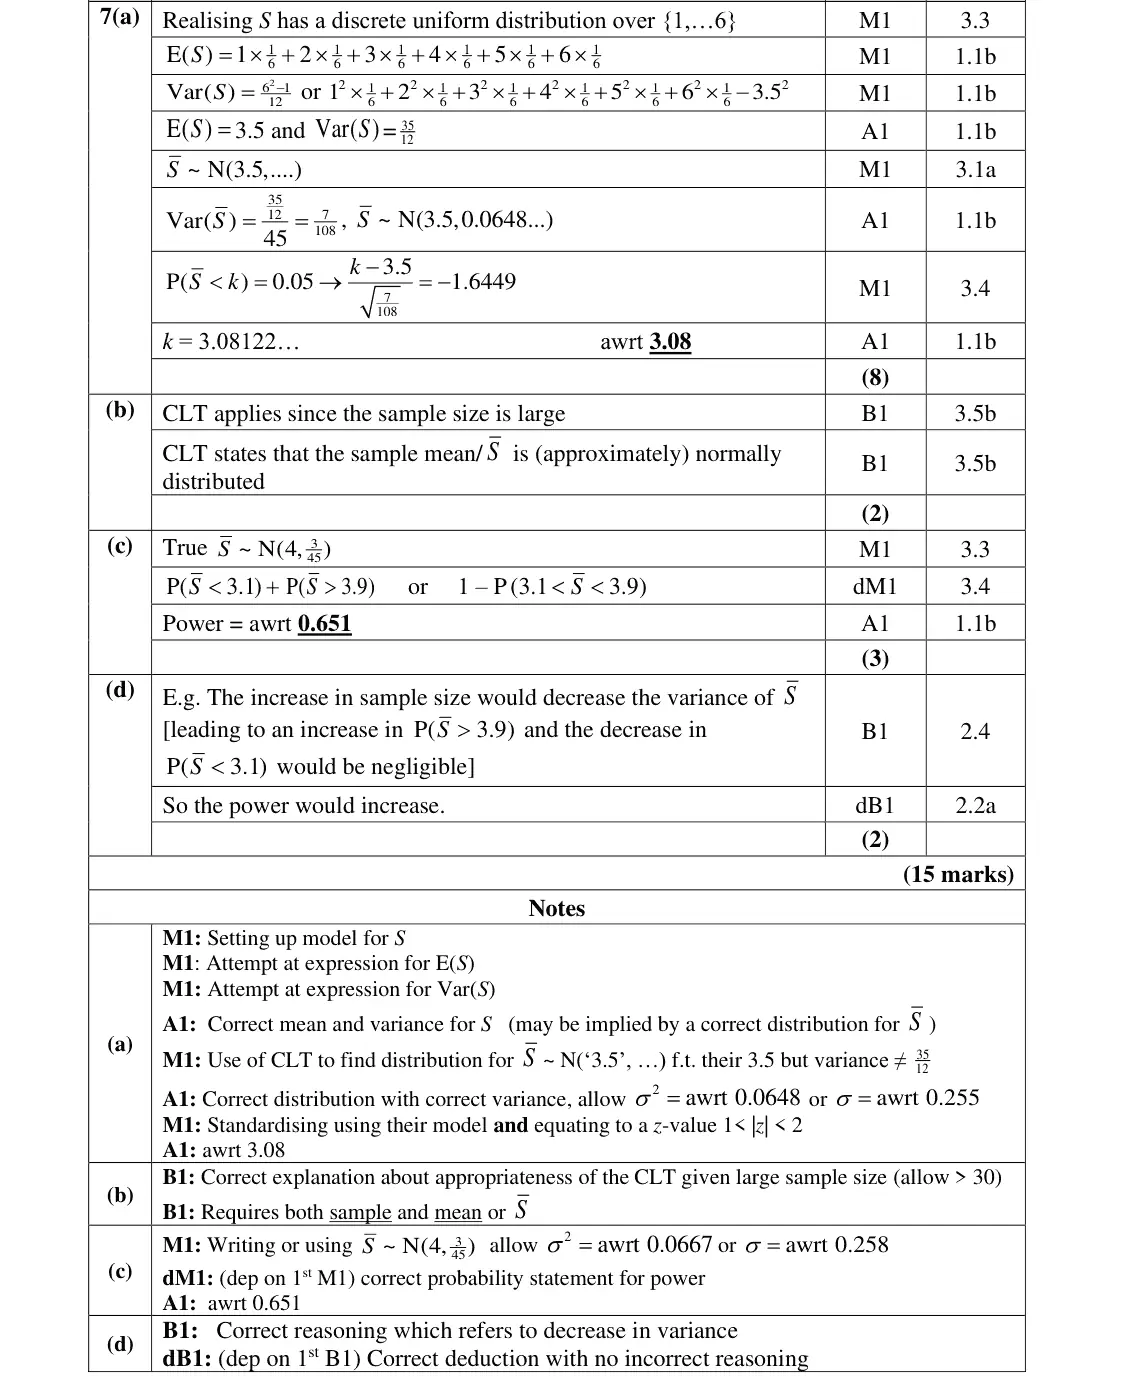
Part (c) was commonly successful although common errors were using the original variance or finding the complement of power. Whilst most correctly suggested the power would increase in part (d), many failed to
Key points from the mark scheme and examiner's report
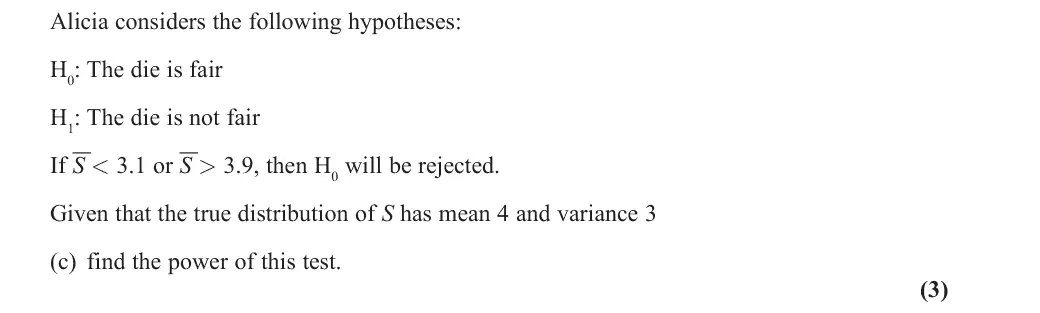
true S̄ ~ N(4, 3/45)
power = P(S̄ < 3.1) + P(S̄ > 3.9) = 0.651
using the unscaled variance or giving the complement
Oct 2020 · Paper 3B (Further Statistics 1) · Q7(d)2 marks
Mark scheme (whole question; this part is marked with the orange bar)
Examiner's comment
Whilst most correctly suggested the power would increase in part (d), many failed to refer to a reduction in variance as the reason, instead giving vague reasons such as ‘increasing number of rolls would make it more accurate’. Some gave as their reasoning that P(Type II) would decrease, without reference to variance.
Key points from the mark scheme and examiner's report
larger n reduces Var(S̄) so P(S̄ > 3.9) increases: power increases
vague "more accurate" answers did not score
June 2019 · Paper 3B (Further Statistics 1) · Q5(b)1 mark
Mark scheme (whole question; this part is marked with the orange bar)
Examiner's comment
knew how to find the probability in part (b). Many identified the binomial model in part (c) but some were confused about the appropriate value for n (3 being a common error) and others made rounding errors which meant that their final answer was not accurate enough. In the final part most knew what a
Key points from the mark scheme and examiner's report
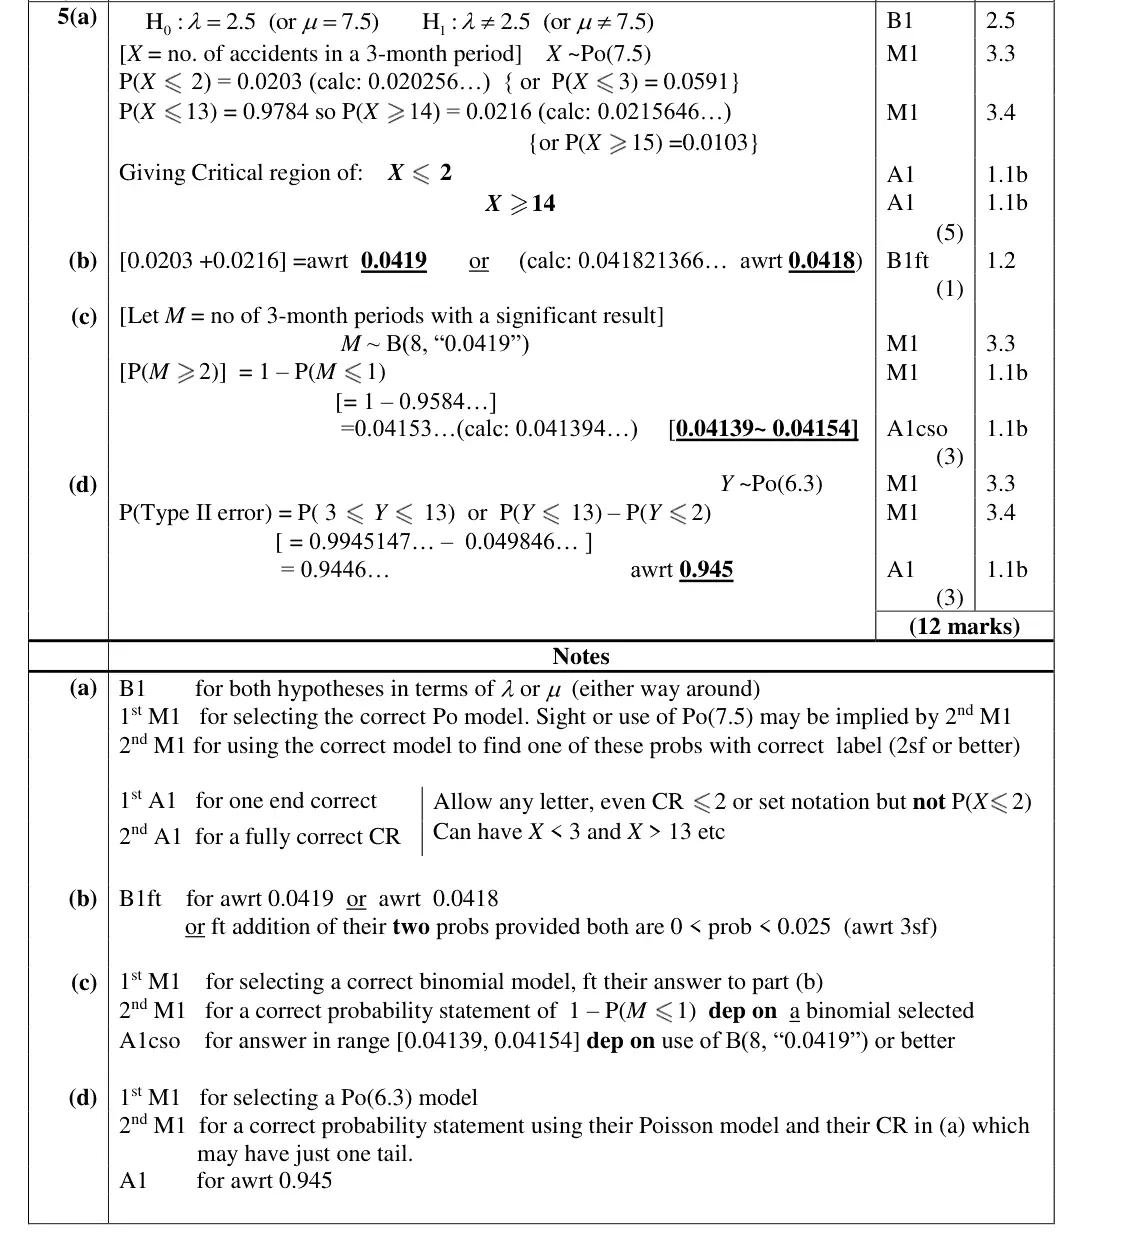
size = sum of tail probabilities 0.0419
June 2019 · Paper 3B (Further Statistics 1) · Q5(c)3 marks
Mark scheme (whole question; this part is marked with the orange bar)
Examiner's comment
knew how to find the probability in part (b). Many identified the binomial model in part (c) but some were confused about the appropriate value for n (3 being a common error) and others made rounding errors which meant that their final answer was not accurate enough. In the final part most knew what a
Key points from the mark scheme and examiner's report
2 years = 8 periods: B(8, 0.0419)
P(M ≥ 2) = 1 − P(M ≤ 1) = 0.0415
n = 3 was a common error, premature rounding
June 2019 · Paper 3B (Further Statistics 1) · Q5(d)3 marks
Mark scheme (whole question; this part is marked with the orange bar)
Examiner's comment
errors which meant that their final answer was not accurate enough. In the final part most knew what a Type II error was and how to find its probability but sometimes a Po(2.1) model was used rather than the required Po(6.3).
Key points from the mark scheme and examiner's report
Po(6.3) for 3 months
P(3 ≤ Y ≤ 13) = 0.945
Po(2.1) used in error
Find an Edexcel Further Maths tutor
Stuck on this? Book a trial lesson with our Further Maths tutor.