FS2.5.4 Hypothesis test for the difference between the means of two Normal…

Section
FS2.5 Estimation, confidence intervals and tests using a normal distribution
Level
A level only
Statement
Hypothesis test for the difference between the means of two Normal distributions with variances known.
Guidance
Use of [(X̄ − Ȳ) − (μ_x − μ_y)] / √(σ_x²/n_x + σ_y²/n_y) ~ N(0, 1).
Since 2018
6 parts, 22 marks · topic pages: Estimators, confidence intervals and tests using the normal distribution

Back to the checklist

June 2023 · Paper 4B (Further Statistics 2) · Q2(b) 1 mark
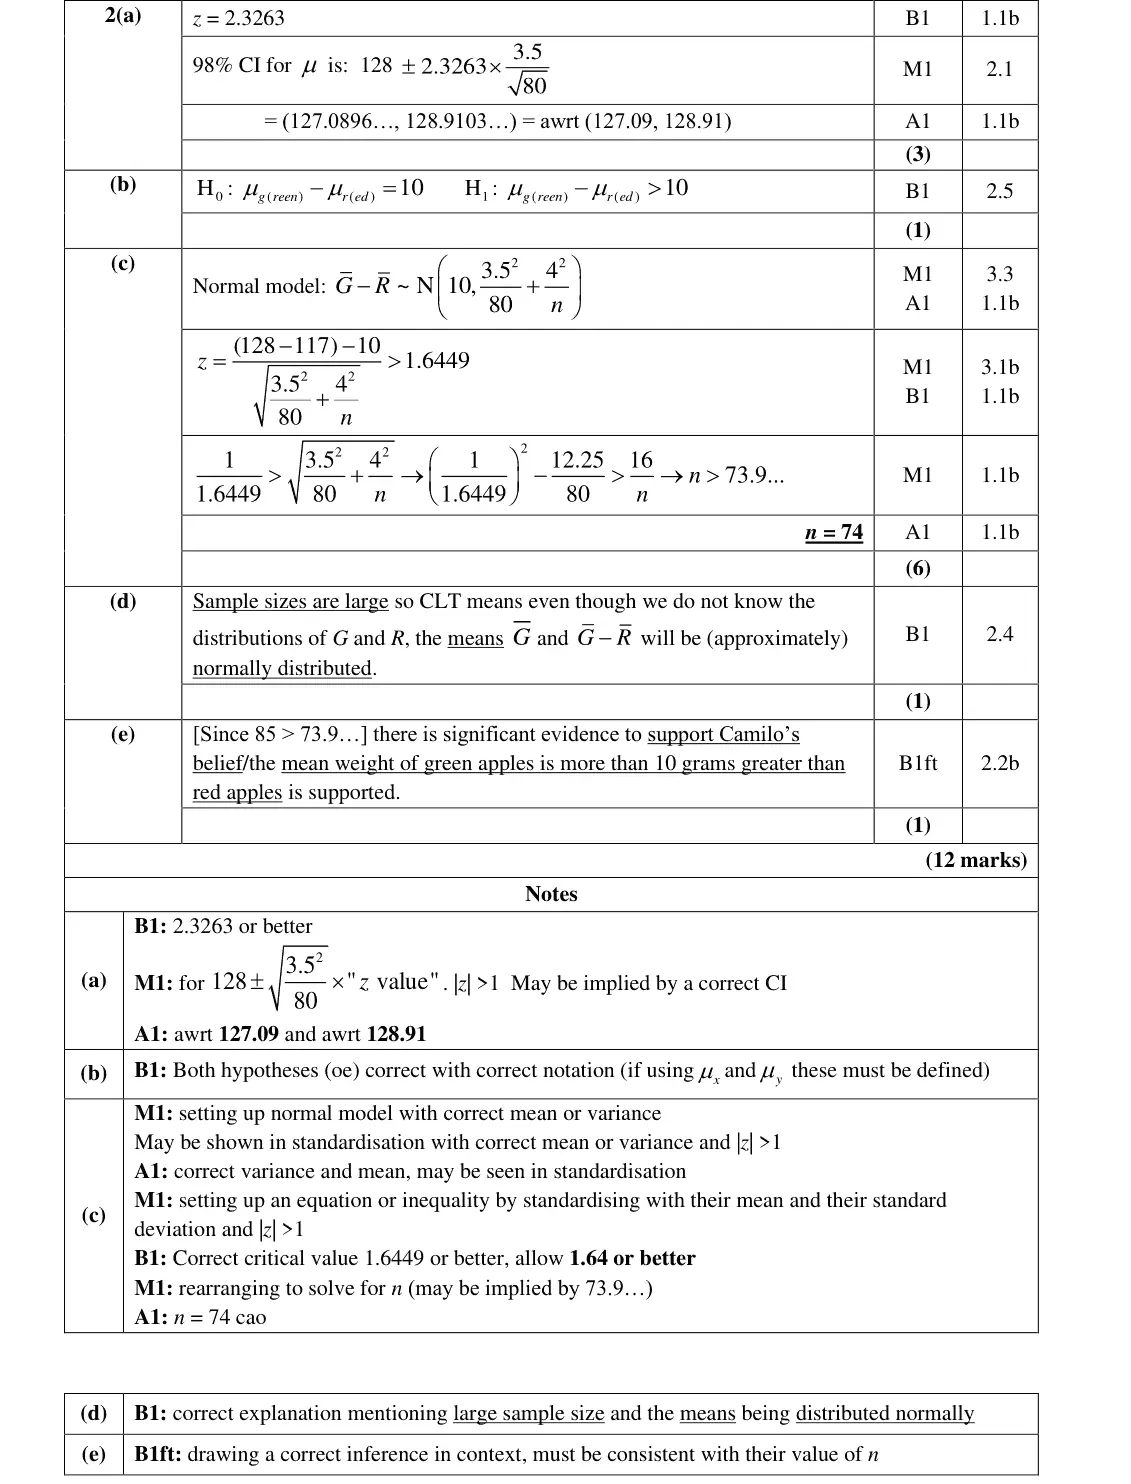
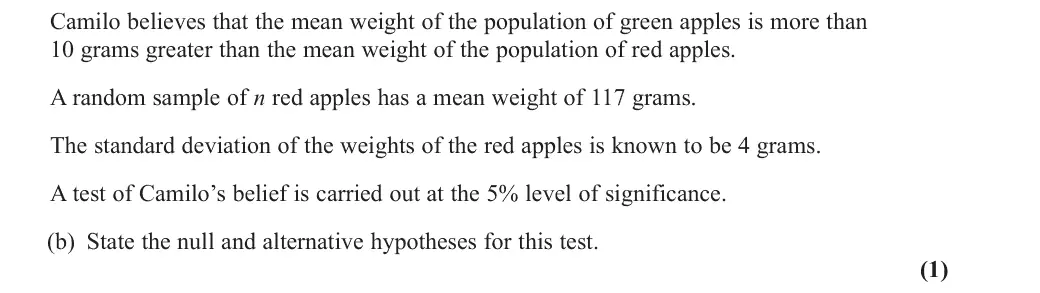
Camilo believes that the mean weight of the population of green apples is more than 10 grams greater than the mean weight of the population of red apples. A random sample of n red apples has a mean weight of 117 grams. The standard deviation of the weights of the red apples is known to be 4 grams. A test of Camilo’s belief is carried out at the 5% level of significance. (b) State the null and alternative hypotheses for this test. (1)
June 2023 · Paper 4B (Further Statistics 2) · Q2(c) 6 marks
(c) Find the smallest value of n for which the null hypothesis will be rejected. (6)
June 2023 · Paper 4B (Further Statistics 2) · Q2(e) 1 mark
(e) Given that n = 85, state the conclusion of the hypothesis test. (1)
June 2022 · Paper 4B (Further Statistics 2) · Q2(b)(i) 3 marks
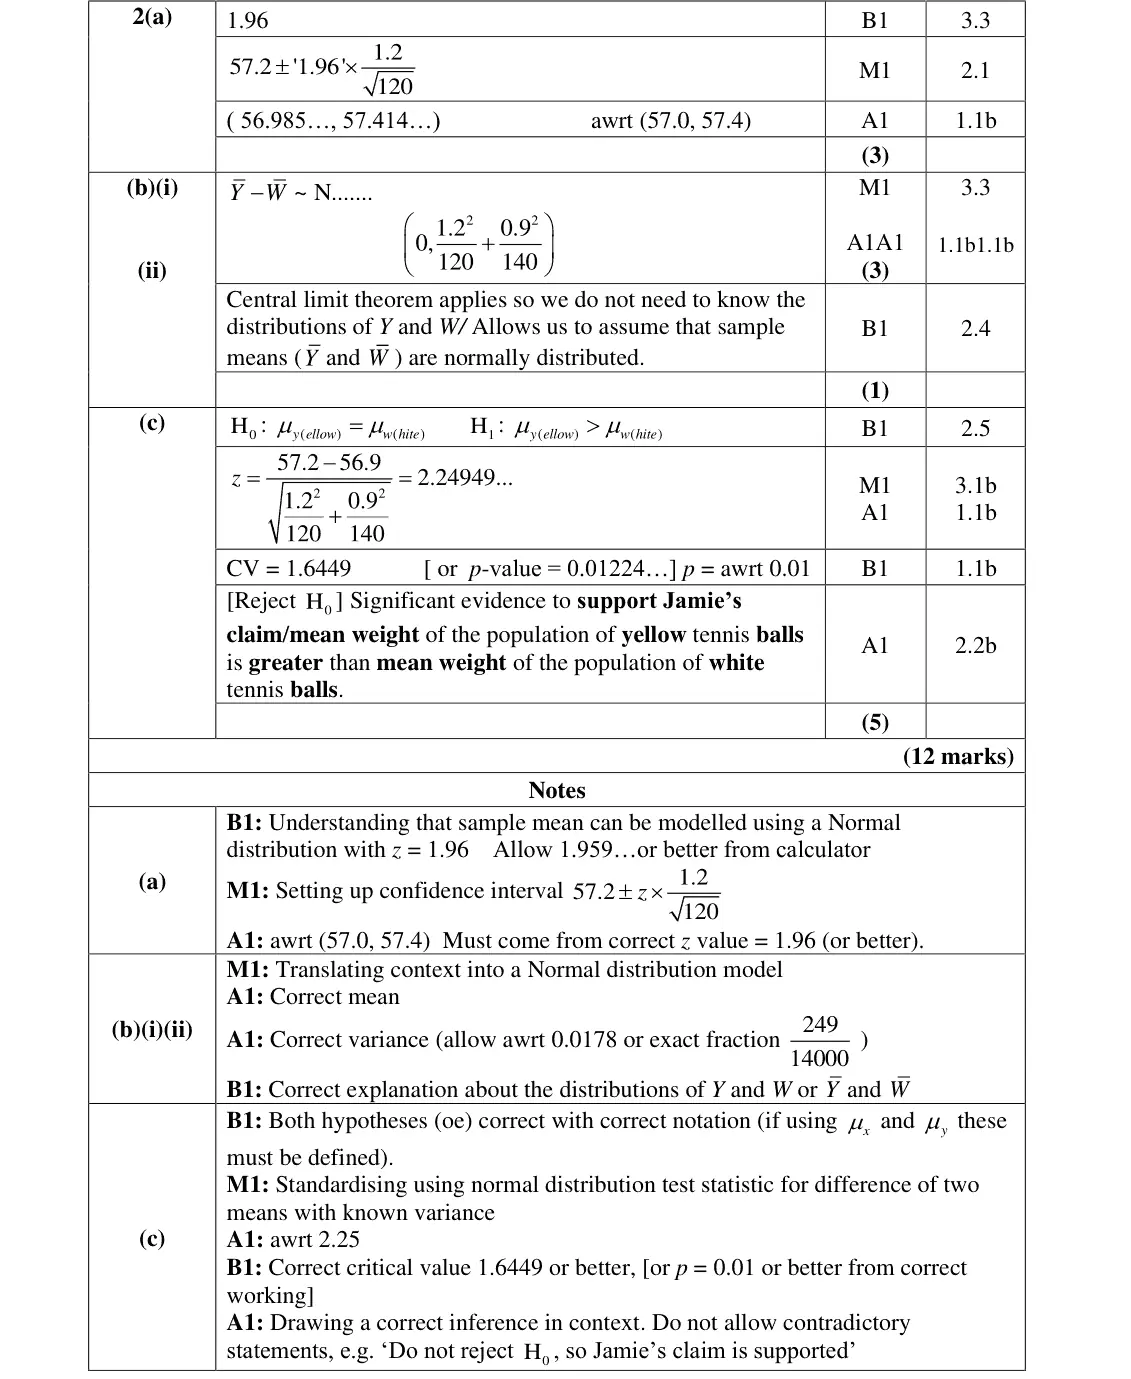
Jamie claims that the mean weight of the population of yellow tennis balls is greater than the mean weight of the population of white tennis balls. A test of Jamie’s claim is carried out. (b) (i) Specify the approximate distribution of Y– – W– under the null hypothesis of the test. (3)
June 2022 · Paper 4B (Further Statistics 2) · Q2(c) 5 marks
(c) Complete the hypothesis test using a 5% level of significance. You should state your hypotheses and the value of your test statistic clearly. (5)
Nov 2021 · Paper 4B (Further Statistics 2) · Q2(a) 6 marks
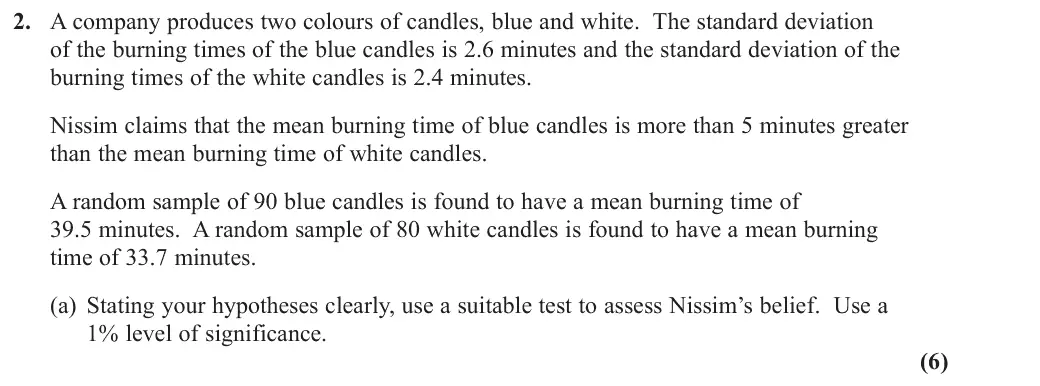
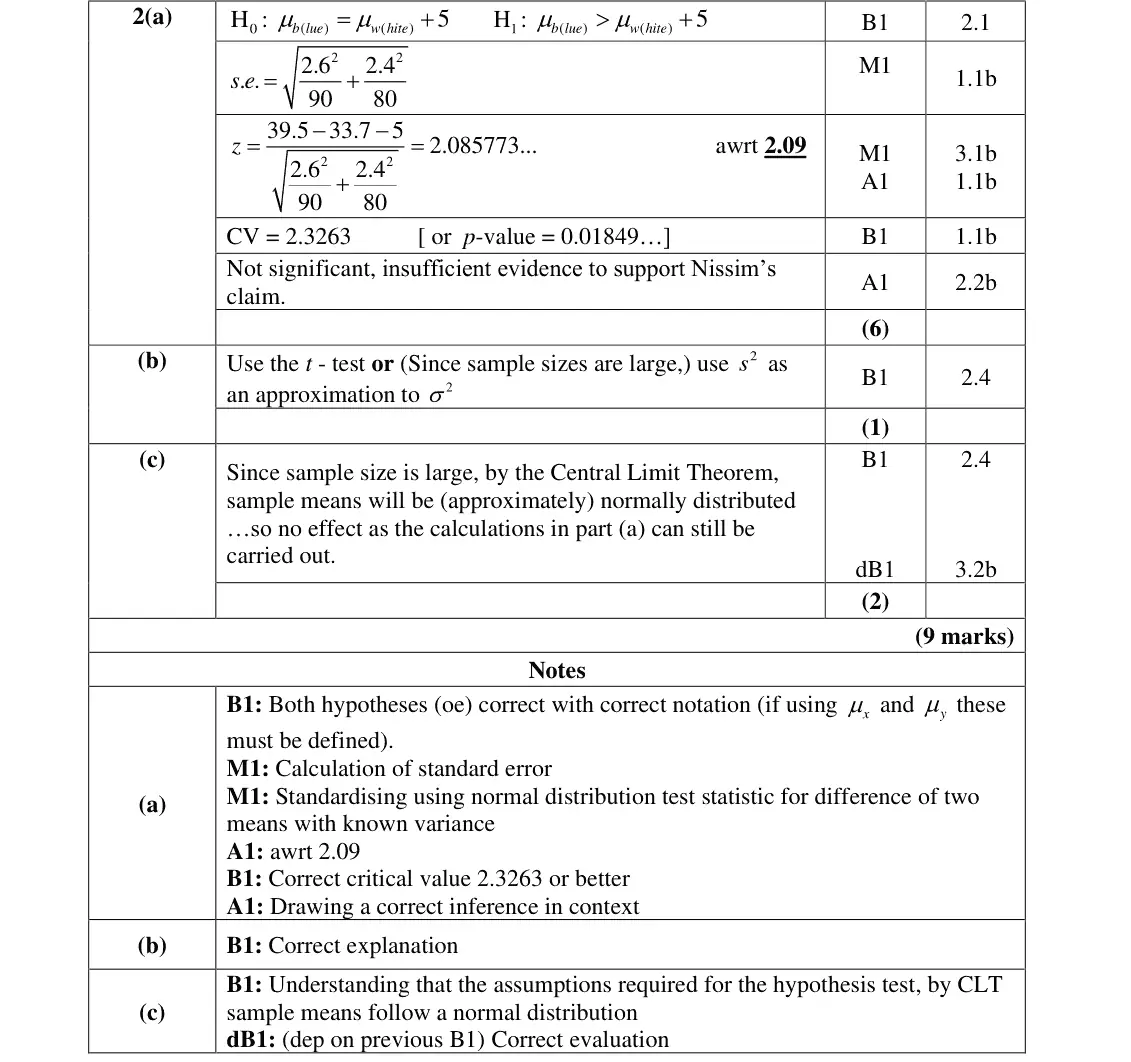
2. A company produces two colours of candles, blue and white. The standard deviation of the burning times of the blue candles is 2.6 minutes and the standard deviation of the burning times of the white candles is 2.4 minutes. Nissim claims that the mean burning time of blue candles is more than 5 minutes greater than the mean burning time of white candles. A random sample of 90 blue candles is found to have a mean burning time of 39.5 minutes. A random sample of 80 white candles is found to have a mean burning time of 33.7 minutes. (a) Stating your hypotheses clearly, use a suitable test to assess Nissim’s belief. Use a 1% level of significance. (6)

Find an Edexcel Further Maths tutor

Stuck on this? Book a trial lesson with our Further Maths tutor.

Prefer email? Send an enquiry

If you are under 18, please include a parent's contact details. Enquiries go to enquiries@alevelfurthermathstutor.com and are deleted once handled.