June 2018: AS Paper 24: Further Statistics 2

40 marks · 17 question parts · Question paper, mark scheme and examiner's report on Pearson's site

Question by question

QTopicMarksDifficulty
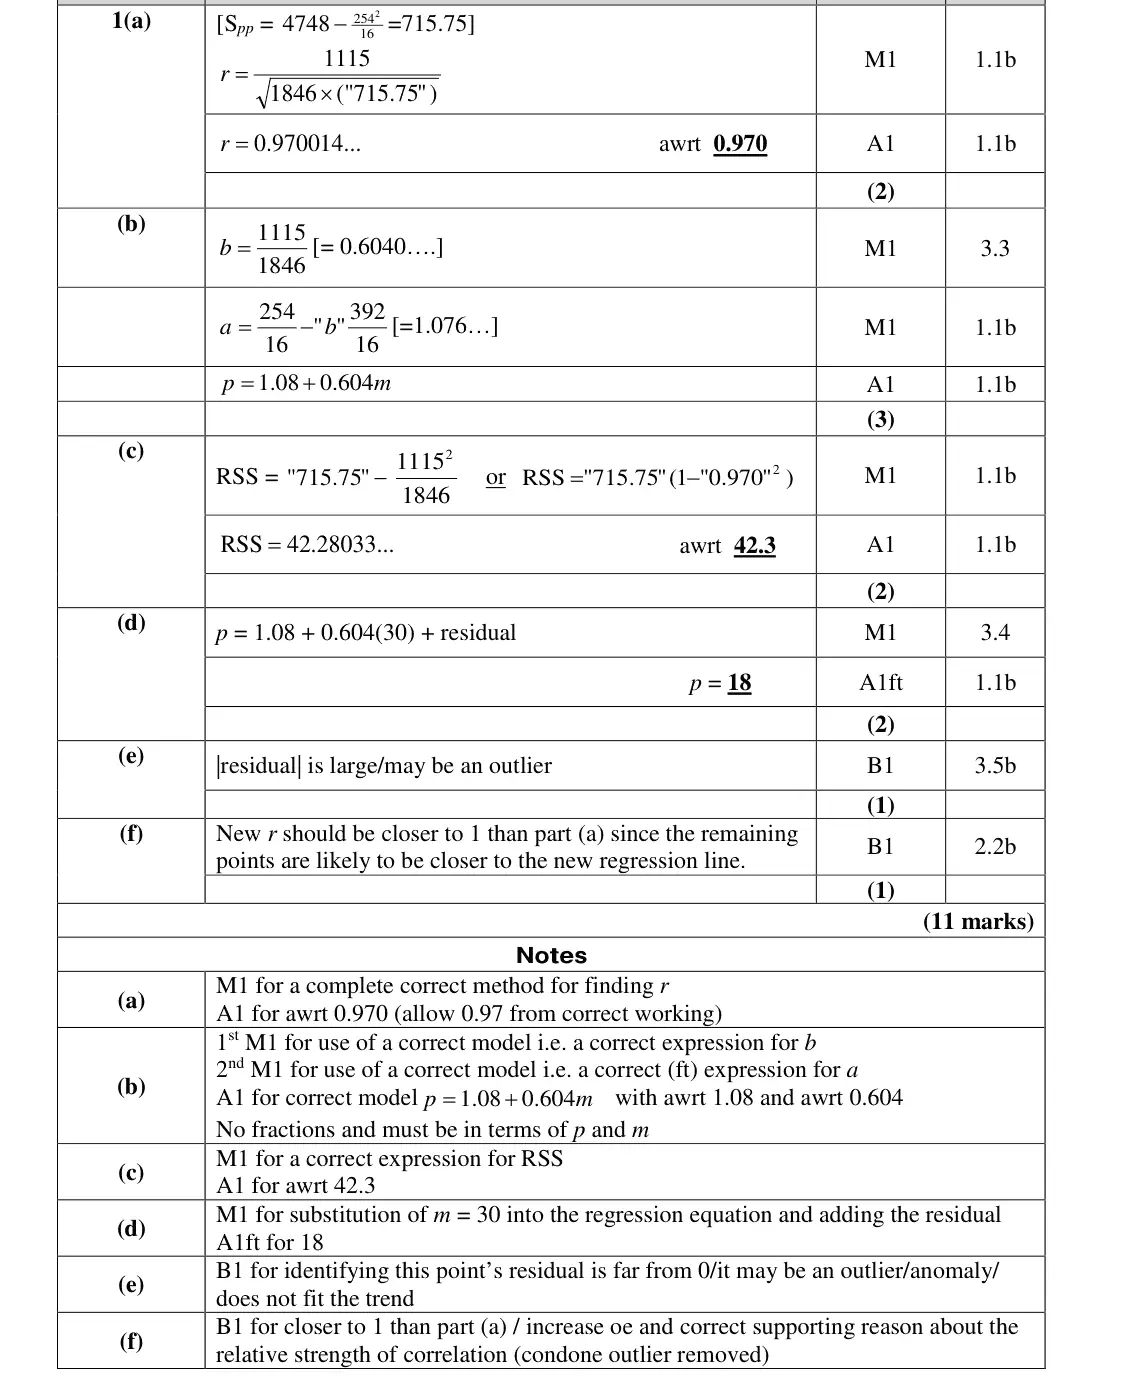
1(a) Correlation: PMCC, Spearman's rank and tests 2 —
1(b) Linear regression and residuals 3 —
1(c) Linear regression and residuals 2 —
1(d) Linear regression and residuals 2 —
1(e) Linear regression and residuals 1 —
1(f) Correlation: PMCC, Spearman's rank and tests 1 —
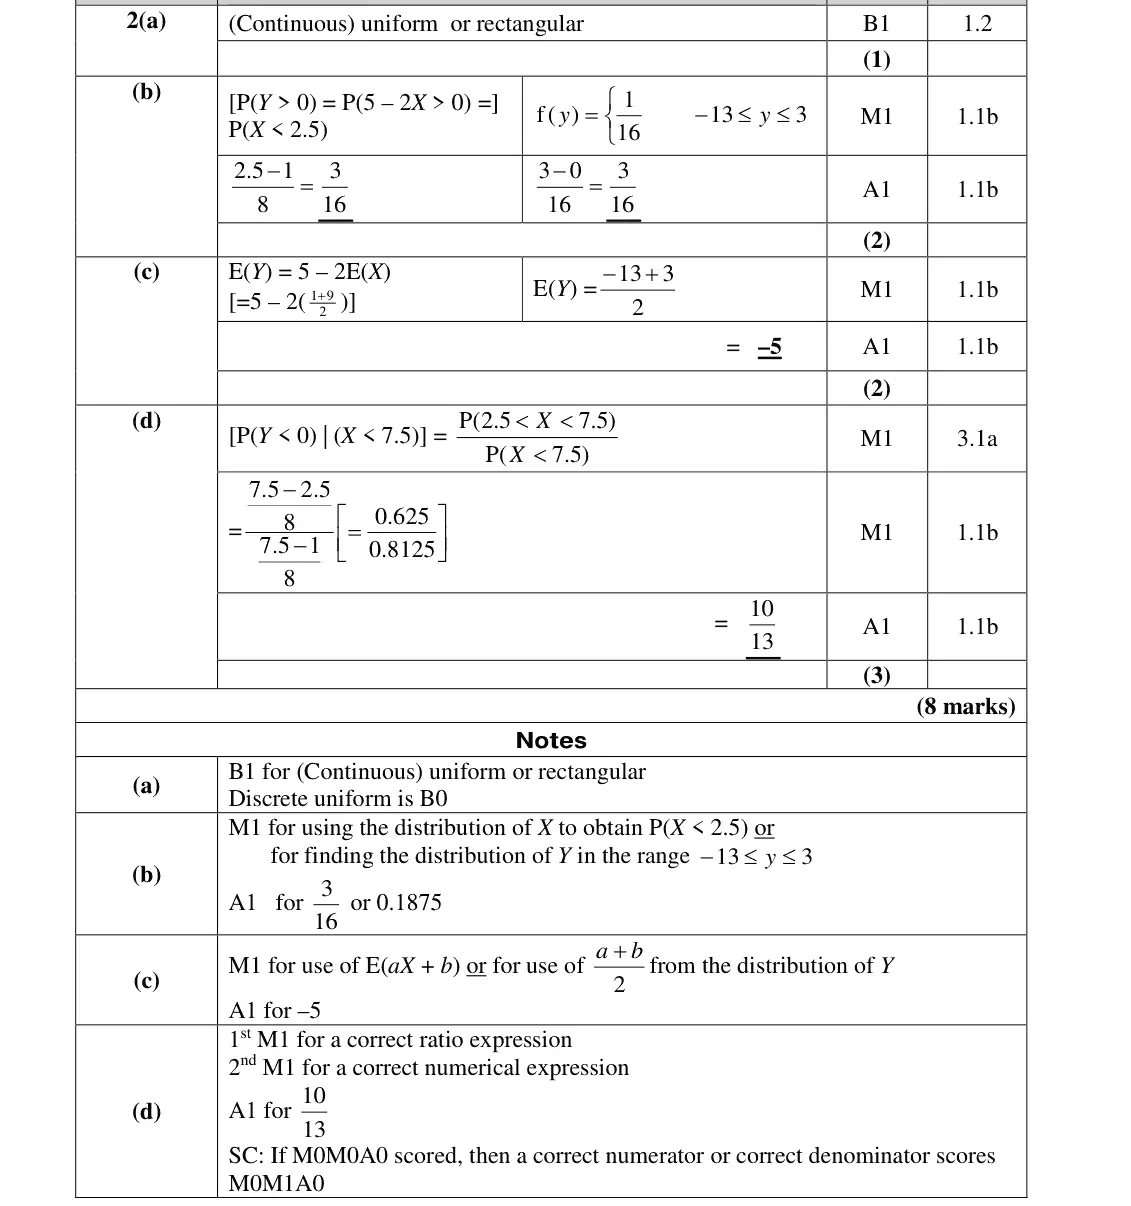
2(a) Continuous random variables and the uniform distribution 1 —
2(b) Continuous random variables and the uniform distribution 2 —
2(c) Continuous random variables and the uniform distribution 2 —
2(d) Continuous random variables and the uniform distribution 3 —
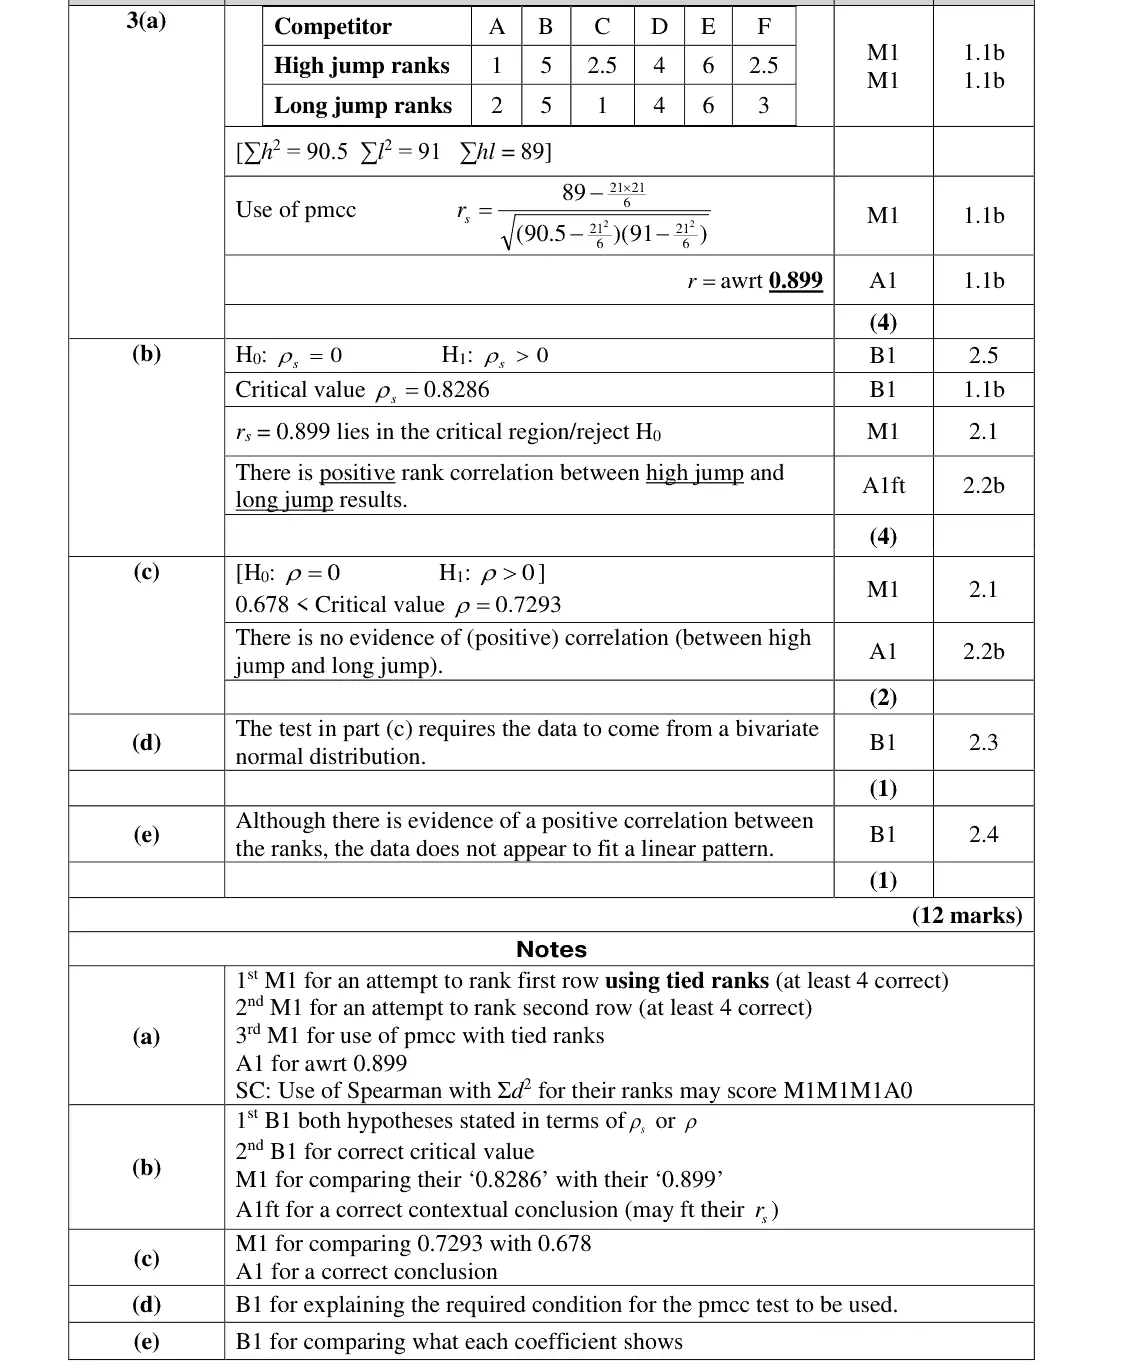
3(a) Correlation: PMCC, Spearman's rank and tests 4 —
3(b) Correlation: PMCC, Spearman's rank and tests 4 —
3(c) Correlation: PMCC, Spearman's rank and tests 2 —
3(d) Correlation: PMCC, Spearman's rank and tests 1 —
3(e) Correlation: PMCC, Spearman's rank and tests 1 —
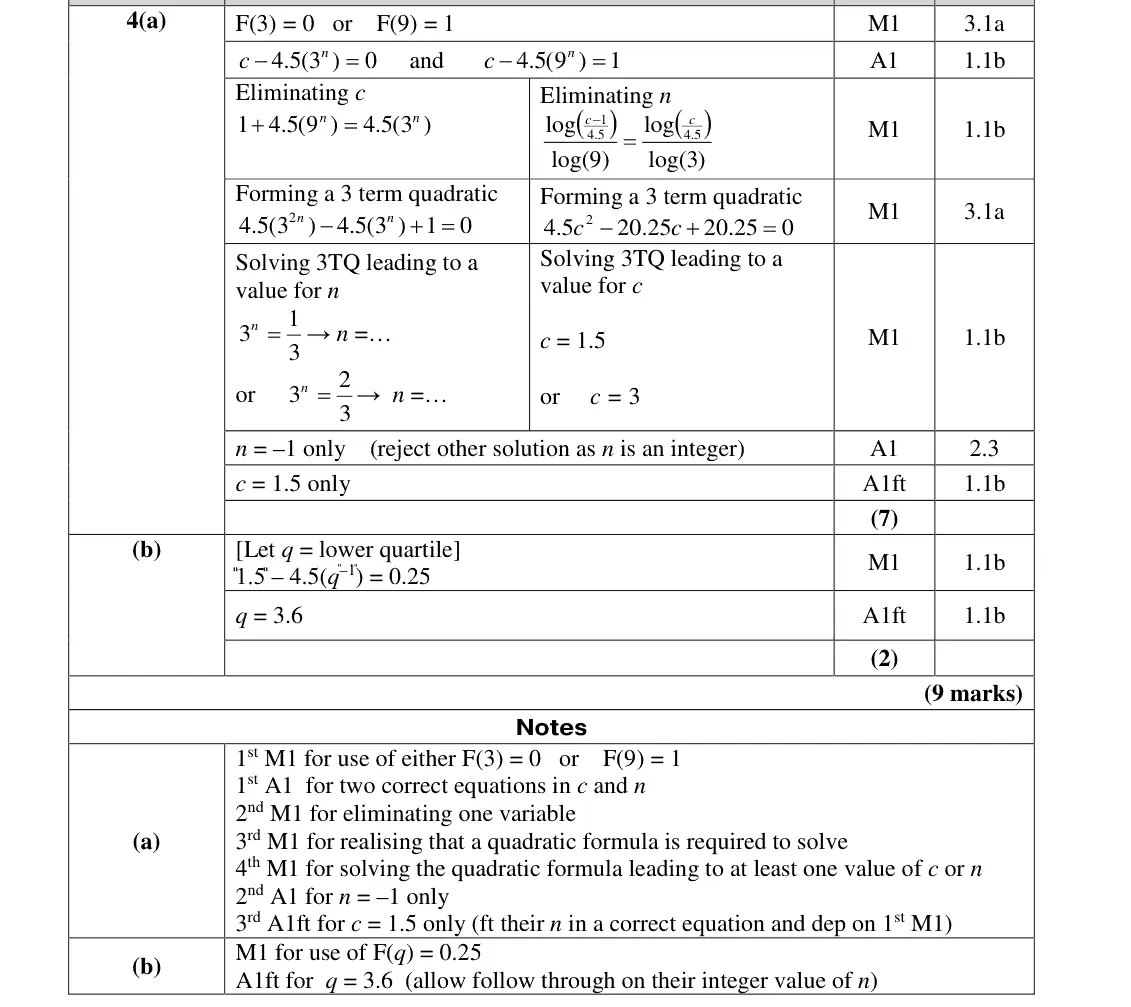
4(a) Continuous random variables and the uniform distribution 7 —
4(b) Continuous random variables and the uniform distribution 2 —

The questions

1(a)1(b)1(c)1(d)1(e)1(f)2(a)2(b)2(c)2(d)3(a)3(b)3(c)3(d)3(e)4(a)4(b)
June 2018 · AS Paper 2 (Further Statistics 2) · Q1(a) 2 marks correlation fs2
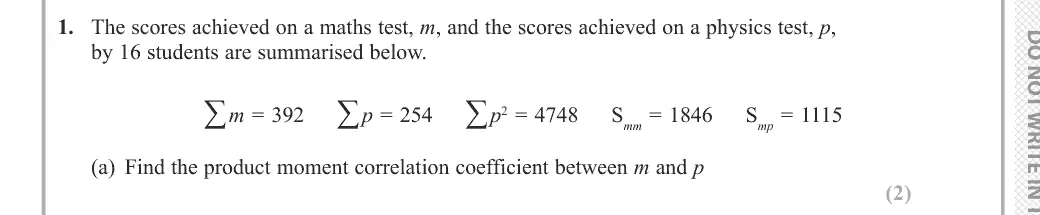
1. The scores achieved on a maths test, m, and the scores achieved on a physics test, p, by 16 students are summarised below. ∑ m = 392 ∑ p = 254 ∑ p2 = 4748 Smm = 1846 Smp = 1115 (a) Find the product moment correlation coefficient between m and p (2)
June 2018 · AS Paper 2 (Further Statistics 2) · Q1(b) 3 marks linear regression
(b) Find the equation of the linear regression line of p on m (3)
June 2018 · AS Paper 2 (Further Statistics 2) · Q1(c) 2 marks linear regression
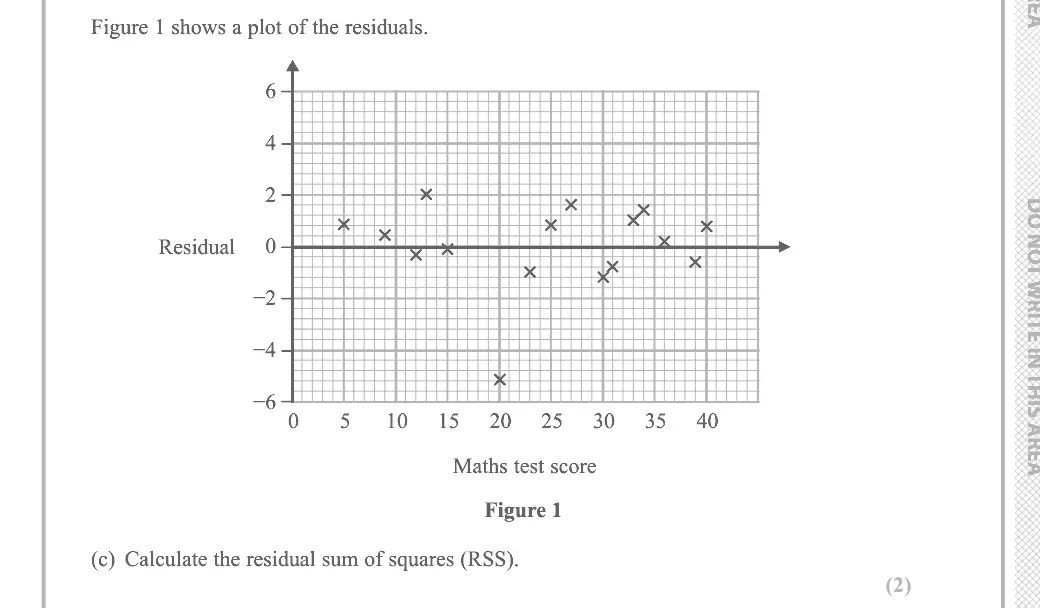
Figure 1 shows a plot of the residuals. Residual -2 -4 -6 Maths test score Figure 1 (c) Calculate the residual sum of squares (RSS). (2)
June 2018 · AS Paper 2 (Further Statistics 2) · Q1(d) 2 marks linear regression
For the person who scored 30 marks on the maths test, (d) find the score on the physics test. (2)
June 2018 · AS Paper 2 (Further Statistics 2) · Q1(e) 1 mark linear regression
The data for the person who scored 20 on the maths test is removed from the data set. (e) Suggest a reason why. (1)
June 2018 · AS Paper 2 (Further Statistics 2) · Q1(f) 1 mark correlation fs2
The product moment correlation coefficient between m and p is now recalculated for the remaining 15 students. (f) Without carrying out any further calculations, suggest how you would expect this recalculated value to compare with your answer to part (a). Give a reason for your answer. (1)
June 2018 · AS Paper 2 (Further Statistics 2) · Q2(a) 1 mark continuous random variables
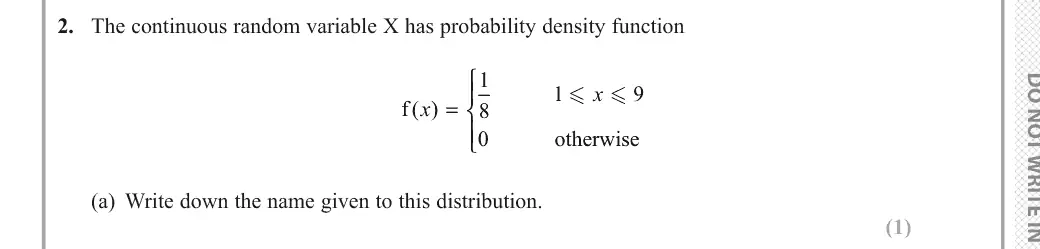
2. The continuous random variable X has probability density function x x = f ( ) otherwise (a) Write down the name given to this distribution. (1)
June 2018 · AS Paper 2 (Further Statistics 2) · Q2(b) 2 marks continuous random variables
The continuous random variable Y = 5 - 2X (b) Find P(Y > 0) (2)
June 2018 · AS Paper 2 (Further Statistics 2) · Q2(c) 2 marks continuous random variables
(c) Find E(Y ) (2)
June 2018 · AS Paper 2 (Further Statistics 2) · Q2(d) 3 marks continuous random variables
(d) Find P(Y < 0 | X < 7.5) (3)
June 2018 · AS Paper 2 (Further Statistics 2) · Q3(a) 4 marks correlation fs2
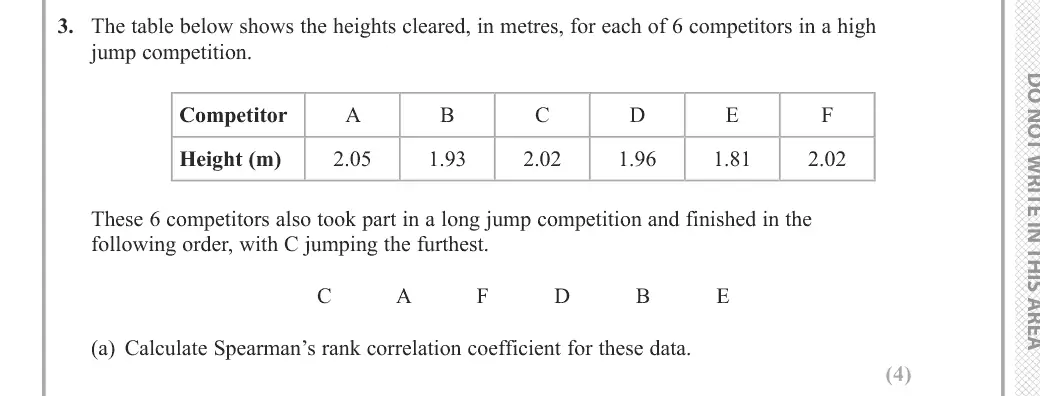
3. The table below shows the heights cleared, in metres, for each of 6 competitors in a high jump competition. Competitor A B C E F Height (m) 2.05 1.93 2.02 1.96 1.81 2.02 These 6 competitors also took part in a long jump competition and finished in the following order, with C jumping the furthest. C A F D B E (a) Calculate Spearman’s rank correlation coefficient for these data. (4)
June 2018 · AS Paper 2 (Further Statistics 2) · Q3(b) 4 marks correlation fs2
(b) Stating your hypotheses clearly, test at the 5% level of significance whether or not there is a positive correlation between results in the high jump and results in the long jump. (4)
June 2018 · AS Paper 2 (Further Statistics 2) · Q3(c) 2 marks correlation fs2
The product moment correlation coefficient between the height of the high jump and the length of the long jump for each competitor is found to be 0.678 (c) Use this value to test, at the 5% level of significance, for evidence of positive correlation between results in the high jump and results in the long jump. (2)
June 2018 · AS Paper 2 (Further Statistics 2) · Q3(d) 1 mark correlation fs2
(d) State the condition required for the test in part (c) to be valid. (1)
June 2018 · AS Paper 2 (Further Statistics 2) · Q3(e) 1 mark correlation fs2
(e) Explain what your conclusions in part (b) and part (c) suggest about the relationship between results in the high jump and results in the long jump. (1)
June 2018 · AS Paper 2 (Further Statistics 2) · Q4(a) 7 marks continuous random variables
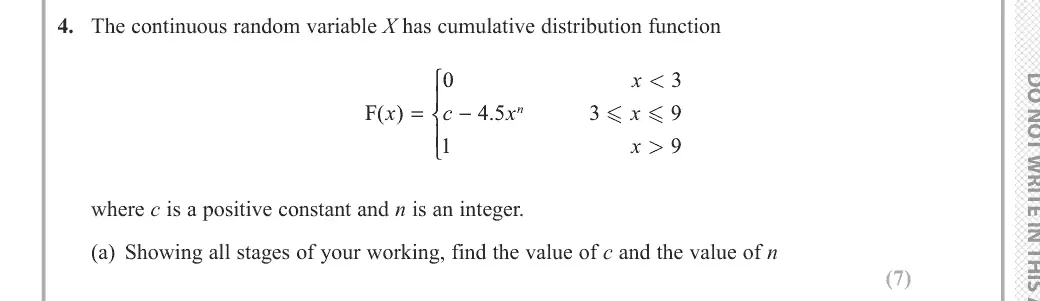
4. The continuous random variable X has cumulative distribution function x < x c x x = - n F( ) 4 5 x > where c is a positive constant and n is an integer. (a) Showing all stages of your working, find the value of c and the value of n (7)
June 2018 · AS Paper 2 (Further Statistics 2) · Q4(b) 2 marks continuous random variables
(b) Find the lower quartile of X (2)

Find an Edexcel Further Maths tutor

Want this paper marked and gone through with a Further Maths tutor? Message us.

Prefer email? Send an enquiry

If you are under 18, please include a parent's contact details. Enquiries go to enquiries@alevelfurthermathstutor.com and are deleted once handled.