The PMCC, Spearman's coefficient and the critical-values table for both are given.
Since 2018
52 question parts, 137 marks
Notes, worked examples and practice for this topic are being written by our tutors. The past-paper questions below are ready now: work each one on paper, then open the mark scheme and the examiner's comment.
Tap a question to zoom it. Mark scheme and examiner's comment open under each question.
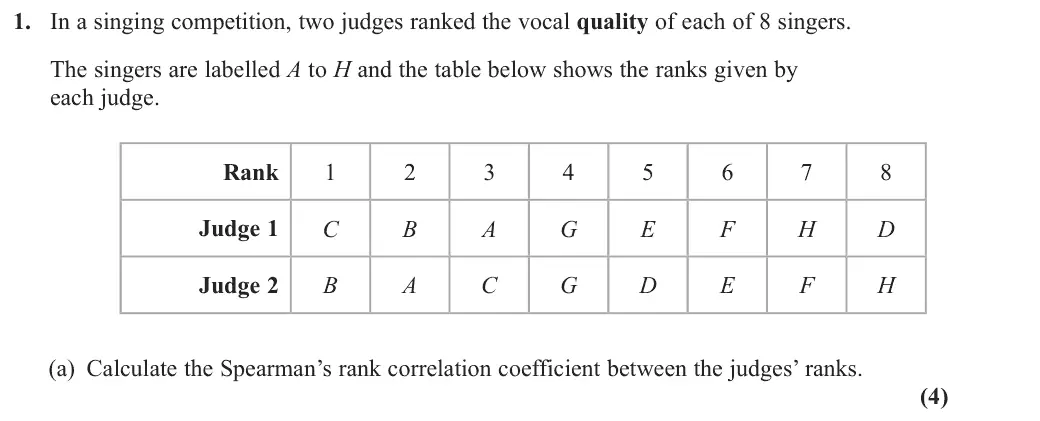
June 2025 · AS Paper 2 (Further Statistics 2) · Q1(a)4 marks
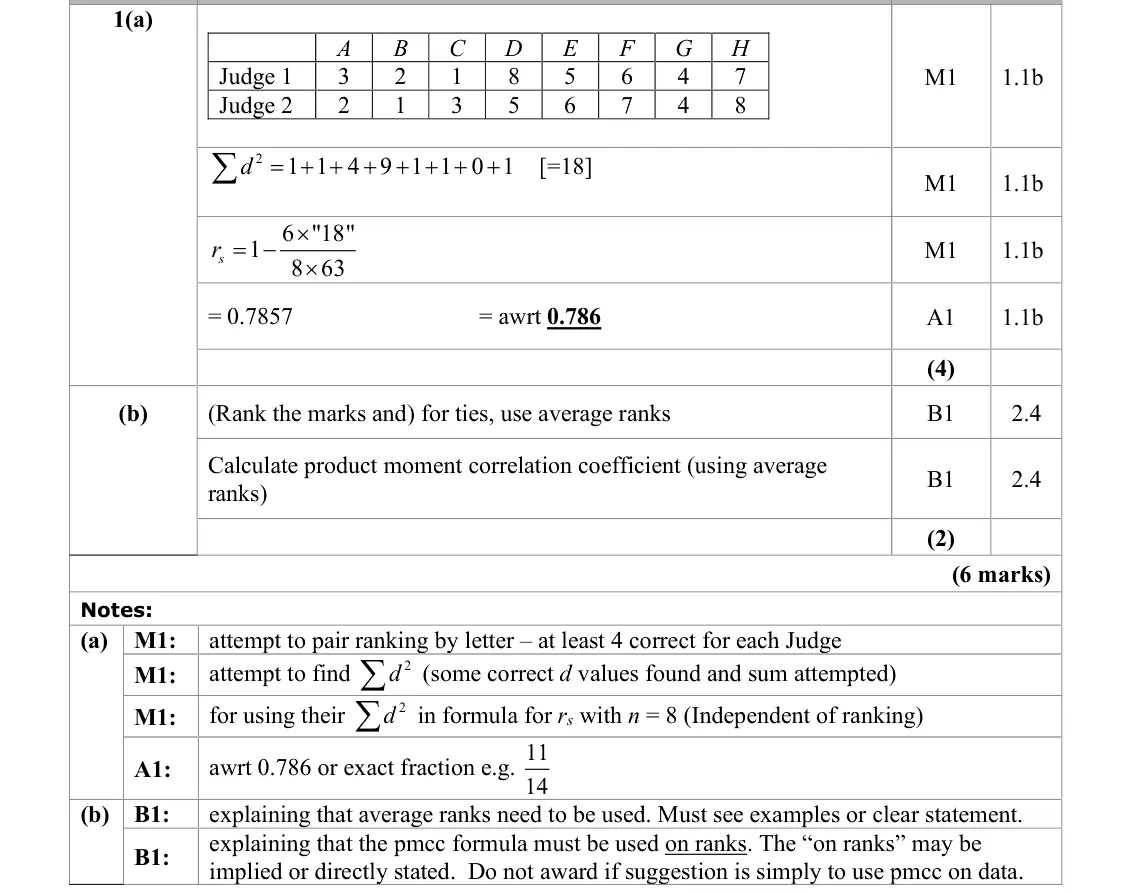
Mark scheme (whole question; this part is marked with the orange bar)
Examiner's comment
Part (a) was answered very well with many correct answers seen. Some made slips in their ranks and a few didn’t use the correct formula. In part (b) many identified that there were
Key points from the mark scheme and examiner's report
convert the table of positions into each singer's rank for each judge first (pair by letter)
Σd² = 18
rs = 1 − 6(18)/(8 × 63) = 0.786 (11/14)
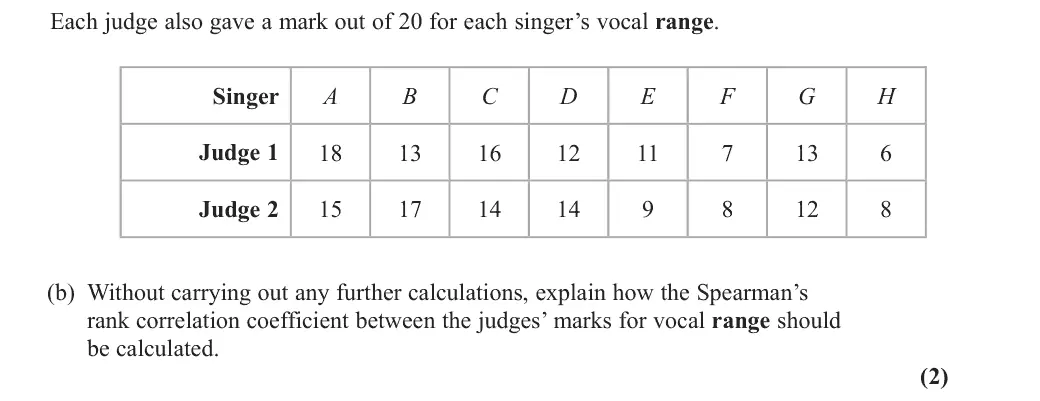
June 2025 · AS Paper 2 (Further Statistics 2) · Q1(b)2 marks
Mark scheme (whole question; this part is marked with the orange bar)
Examiner's comment
ranks and a few didn’t use the correct formula. In part (b) many identified that there were some tied ranks but they didn’t always explain how to deal with these. Many learners knew that for tied ranks one should use the product moment correlation coefficient formula but they didn’t always clearly state that this formula should be used on the ranks not on the original data.
Key points from the mark scheme and examiner's report
the marks have ties (Judge 1: 13, 13
Judge 2: 14, 14 and 8, 8): rank the marks using average ranks, then apply the pmcc formula to the ranks (not to the raw marks)
the "on ranks" point was often missing
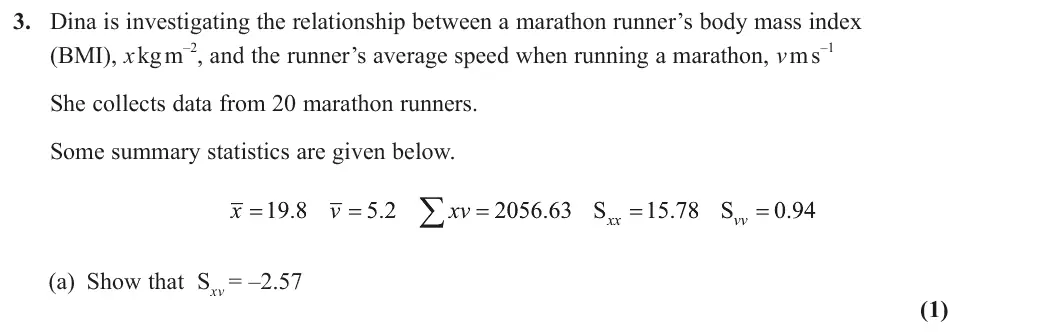
June 2025 · AS Paper 2 (Further Statistics 2) · Q3(a)1 mark
Mark scheme (whole question; this part is marked with the orange bar)
Examiner's comment
This question was answered well by virtually all the learners. In part (a) very few learners failed to show us some working before arriving at the printed answer and most used this value, along with the other values in the question to complete part (b) correctly too.
Key points from the mark scheme and examiner's report
June 2025 · AS Paper 2 (Further Statistics 2) · Q3(b)2 marks
Mark scheme (whole question; this part is marked with the orange bar)
Examiner's comment
value, along with the other values in the question to complete part (b) correctly too. For the hypothesis test in part (c) some didn’t give their hypotheses in terms of ρ but very
Key points from the mark scheme and examiner's report
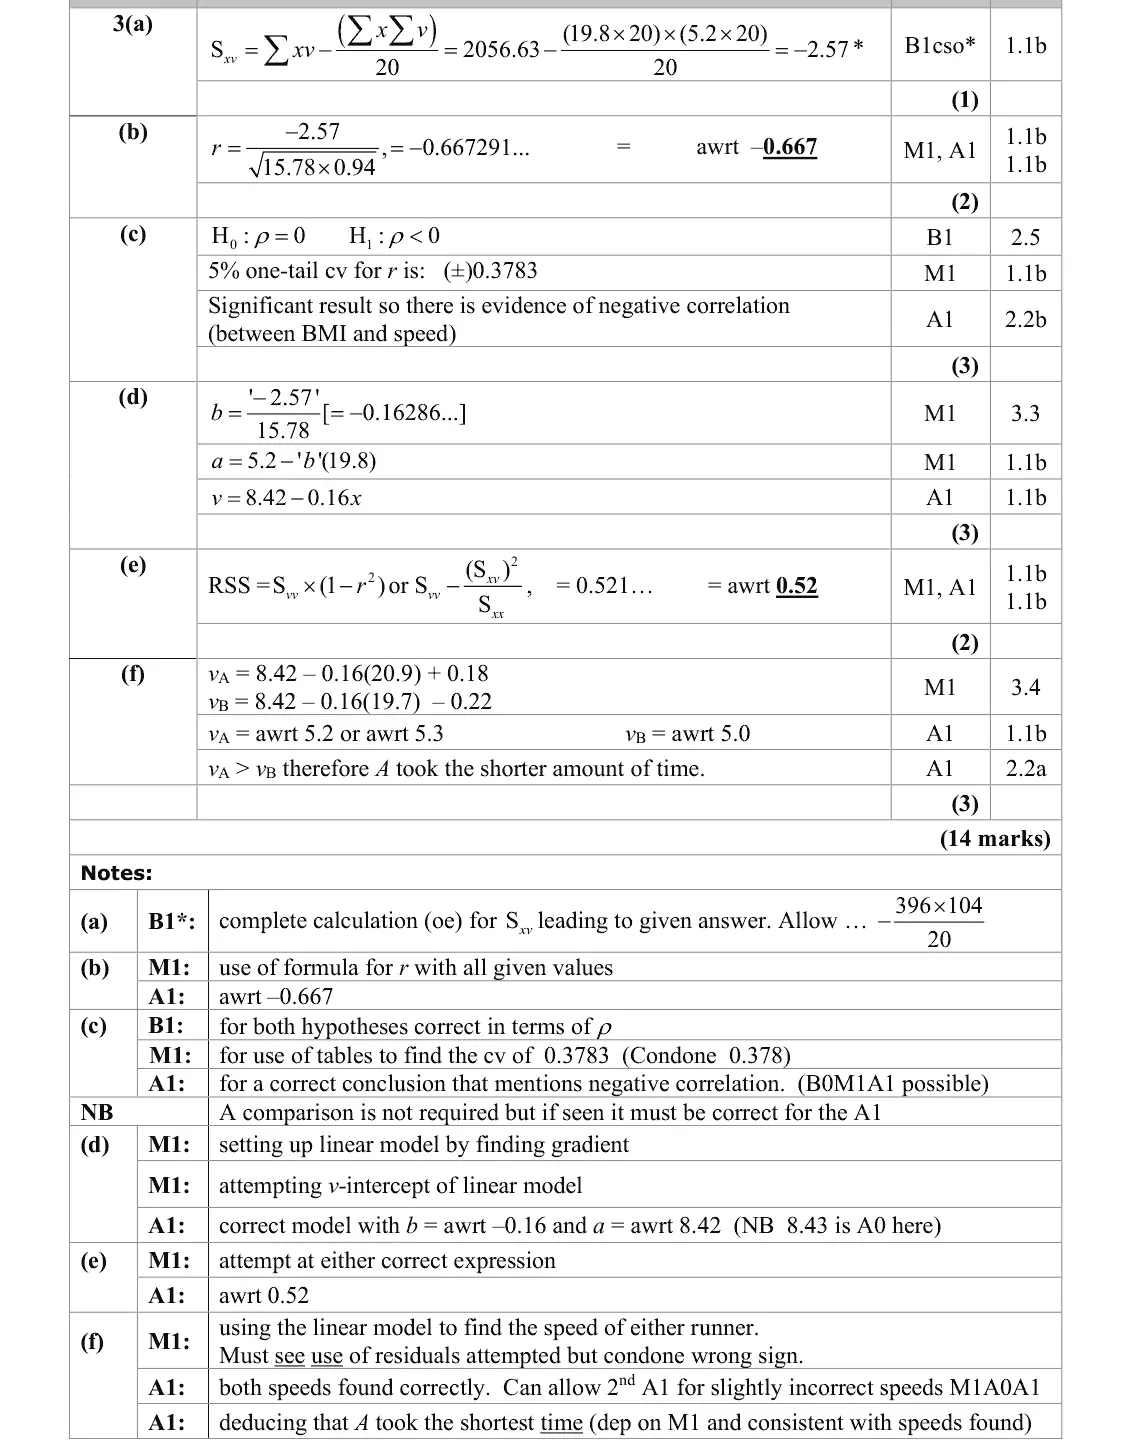
r = −2.57/√(15.78 × 0.94) = −0.667
June 2025 · AS Paper 2 (Further Statistics 2) · Q3(c)3 marks
Mark scheme (whole question; this part is marked with the orange bar)
Examiner's comment
For the hypothesis test in part (c) some didn’t give their hypotheses in terms of ρ but very few attempted a tw-tail test. Most used the correct critical value from the tables with only a small minority giving the Spearman’s critical value. The most frequent cause for losing marks here was over the conclusion. Many gave a correct comparison such as – 0.667 < – 0.3783 and went on to state that there was evidence of a negative correlation. Such a comparison was not required but if attempted it should be correct so those who stated – 0.667 < 0.3783 for example lost the final mark.
Key points from the mark scheme and examiner's report
H0: ρ = 0, H1: ρ < 0 (in terms of ρ)
one-tailed 5% pmcc cv for n = 20 is −0.3783 (not Spearman's)
significant: evidence of negative correlation between BMI and speed
any comparison written must be correct
June 2025 · Paper 4B (Further Statistics 2) · Q2(a)4 marks
Mark scheme (whole question; this part is marked with the orange bar)
Examiner's comment
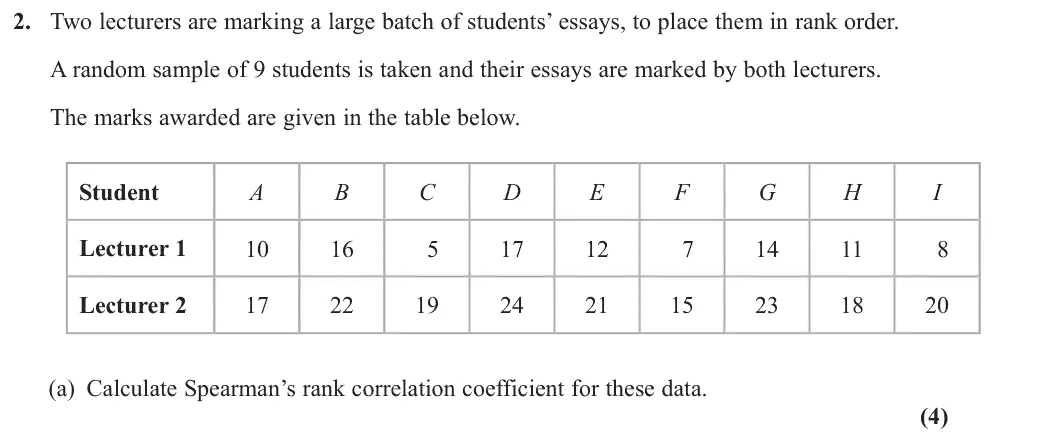
This question was on Spearman’s rank and testing for correlation and most candidates found this a very accessible question and were able to score most, if not all, of the marks. In part (a), candidates were usually successful in calculating Spearman’s rank correlation coefficient. This was assisted by the data already being ranked which meant that candidates were less likely to make an initial error with ranking the data and doing this consistently for both sets. The occasional error occurred when finding the distances, not squaring the differences in the ranks or using an incorrect formula (often by omitting the 1 – at the beginning).
Key points from the mark scheme and examiner's report
rank each lecturer's marks
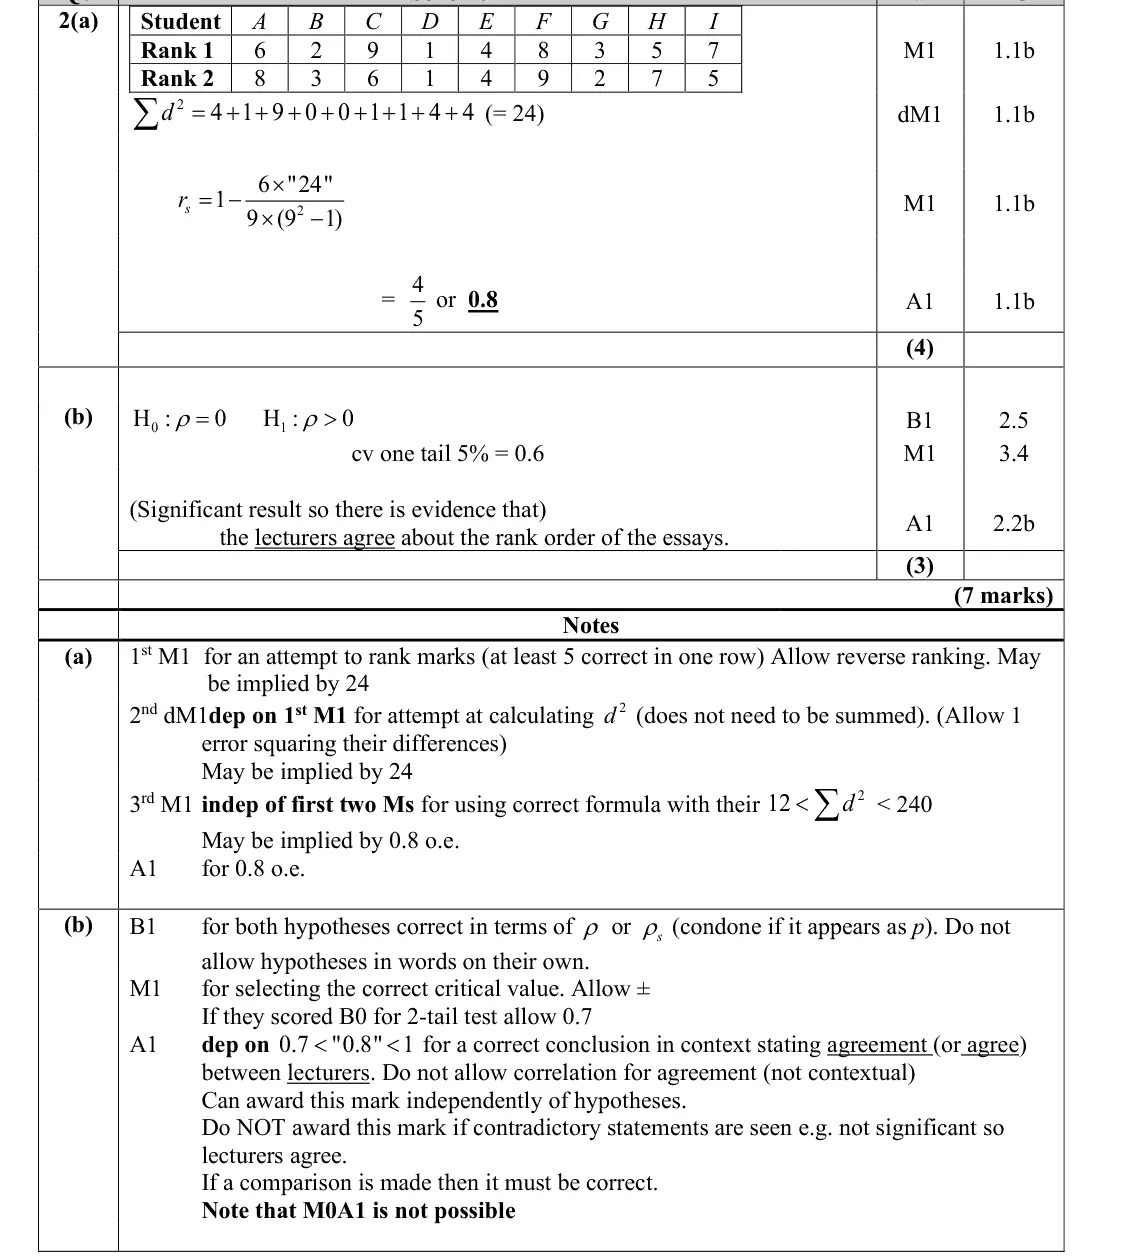
Σd² = 24
rs = 1 − 6 × 24/(9 × 80) = 0.8
omitting the '1 −' or not squaring d were the usual slips
June 2025 · Paper 4B (Further Statistics 2) · Q2(b)3 marks
Mark scheme (whole question; this part is marked with the orange bar)
Examiner's comment
This question was on Spearman’s rank and testing for correlation and most candidates found this a very accessible question and were able to score most, if not all, of the marks. In part (b), candidates were usually successful in setting up correct null and alternative hypotheses. The most common errors were using r instead of ρ with some incorrectly deducing that agreement meant a two-tailed instead of a one-tailed test. Candidates usually found the correct critical value and made a correct comparison and those who did set up a two- tailed test were able to score this mark for a correct critical value under that test. Others lost the final mark for not mentioning the context in the conclusion.
Key points from the mark scheme and examiner's report
H₀: ρs = 0, H₁: ρs > 0 (one-tailed for agreement)
CV (n = 9, 5%) = 0.6
0.8 > 0.6, evidence the lecturers agree about the rank order
using r instead of ρ, two-tailed tests, no context
June 2024 · AS Paper 2 (Further Statistics 2) · Q27 marks
Mark scheme (whole question; this part is marked with the orange bar)
Examiner's comment
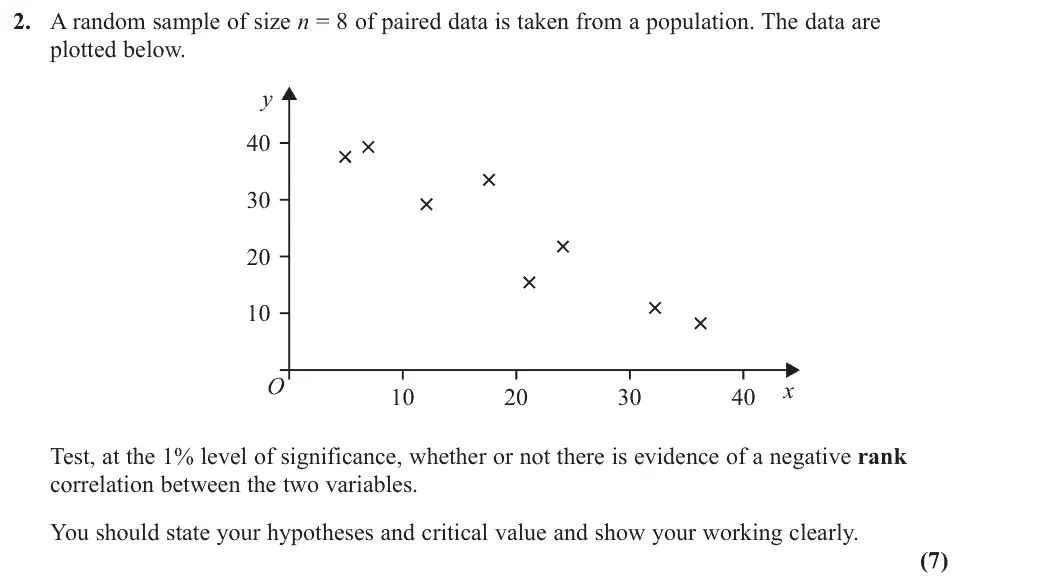
Usually, the calculation of Spearman’s rank correlation coefficient is a good source of marks for all students. It was unfortunate here that some could not see how to get started and there were attempts to write down coordinates for each of the 8 points and this made the question unnecessarily difficult. Those who didn’t even try this could often obtain a mark for writing the hypotheses in terms of ρ or ρs and usually the correct critical value was written down from the tables. Those who did realise that they could simply order the ranks often did so correctly and were able to find the correct value for rs and usually make a correct conclusion for the test. A few students used their coordinates to find the product moment correlation coefficient which used up precious time and usually scored no marks.
Key points from the mark scheme and examiner's report
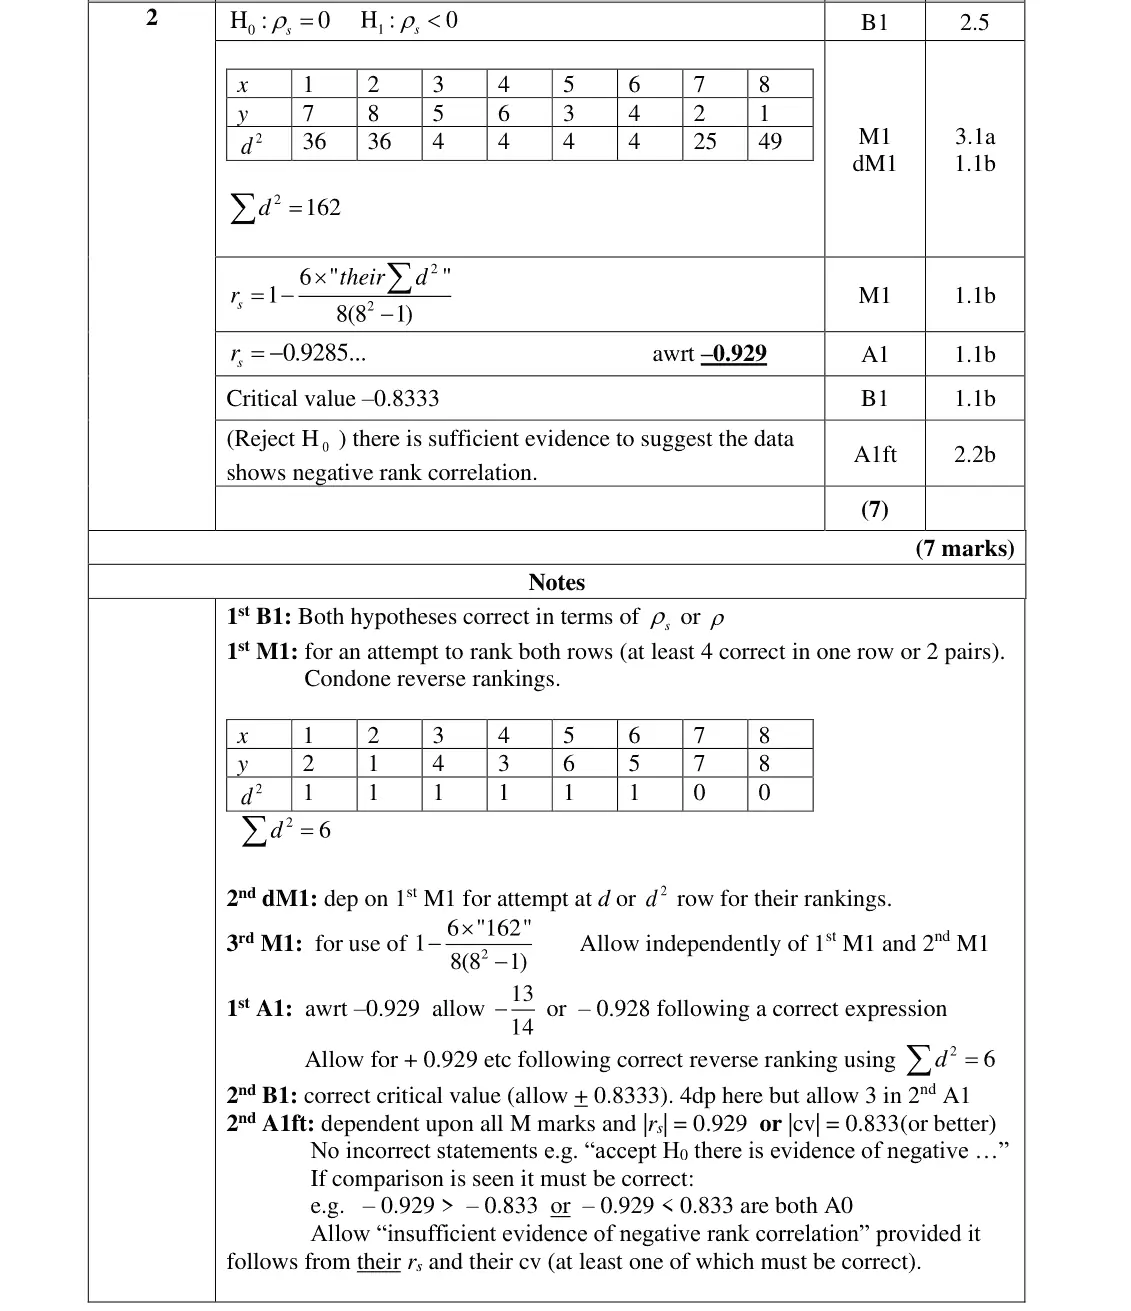
read the ranks from the scatter diagram (no need for coordinates): Σd² = 162, rs = −0.929
H0: ρs = 0, H1: ρs < 0
cv −0.8333
reject H0: evidence of negative rank correlation
comparisons like −0.929 > −0.833 lose the final mark
June 2024 · AS Paper 2 (Further Statistics 2) · Q5(a)3 marks
Mark scheme (whole question; this part is marked with the orange bar)
Examiner's comment
In part (a) most knew that they needed to find Sss and usually they realised this could be found using the gradient of the regression line. The correct value for r normally followed.
Key points from the mark scheme and examiner's report
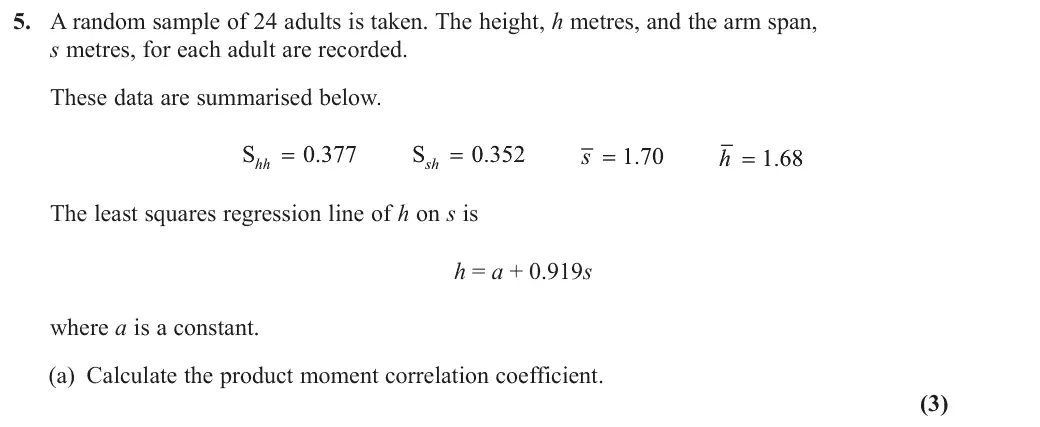
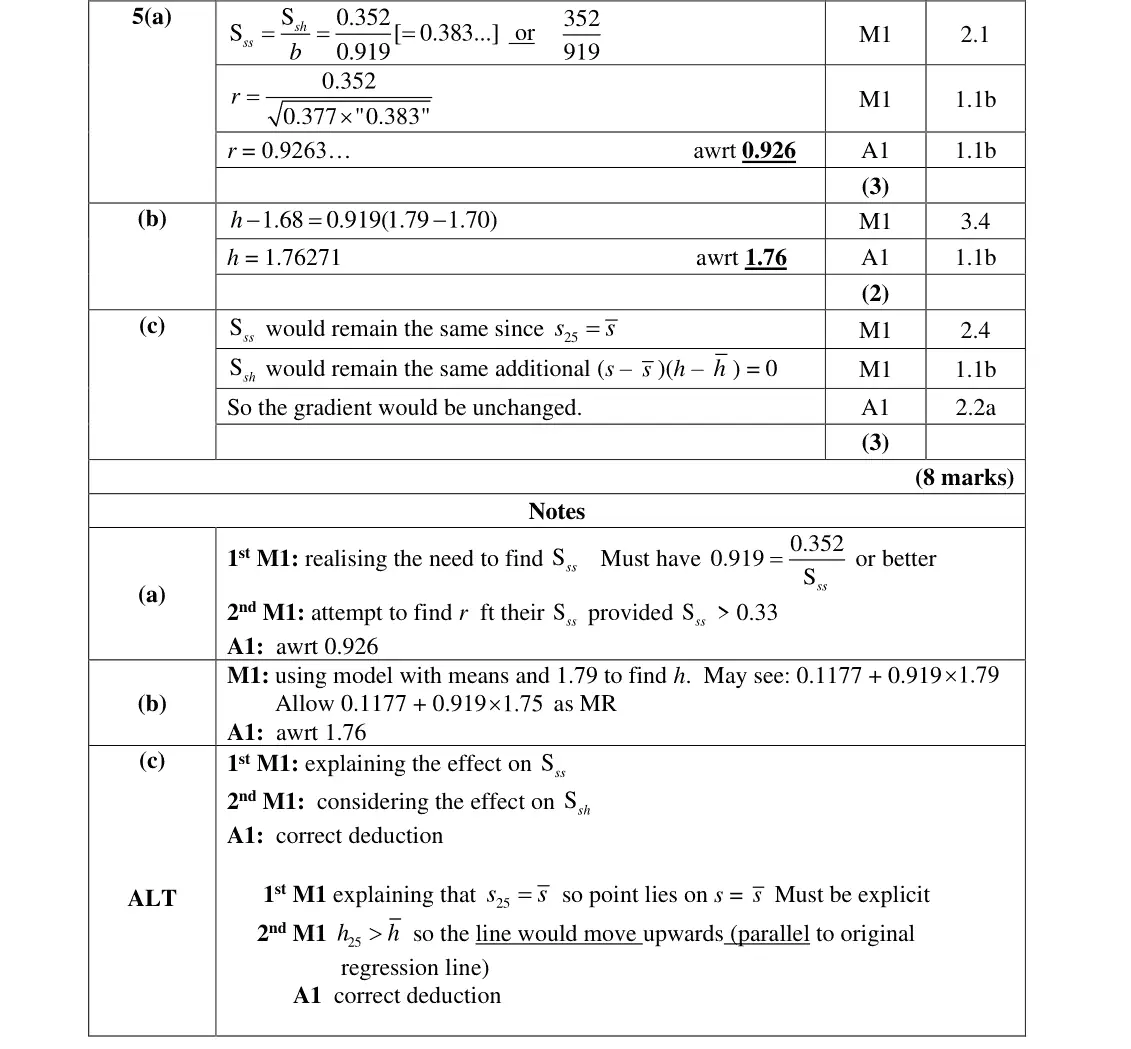
use the gradient b = Ssh/Sss to get Sss = 0.352/0.919 = 0.383
r = 0.352/√(0.377 × 0.383) = 0.926
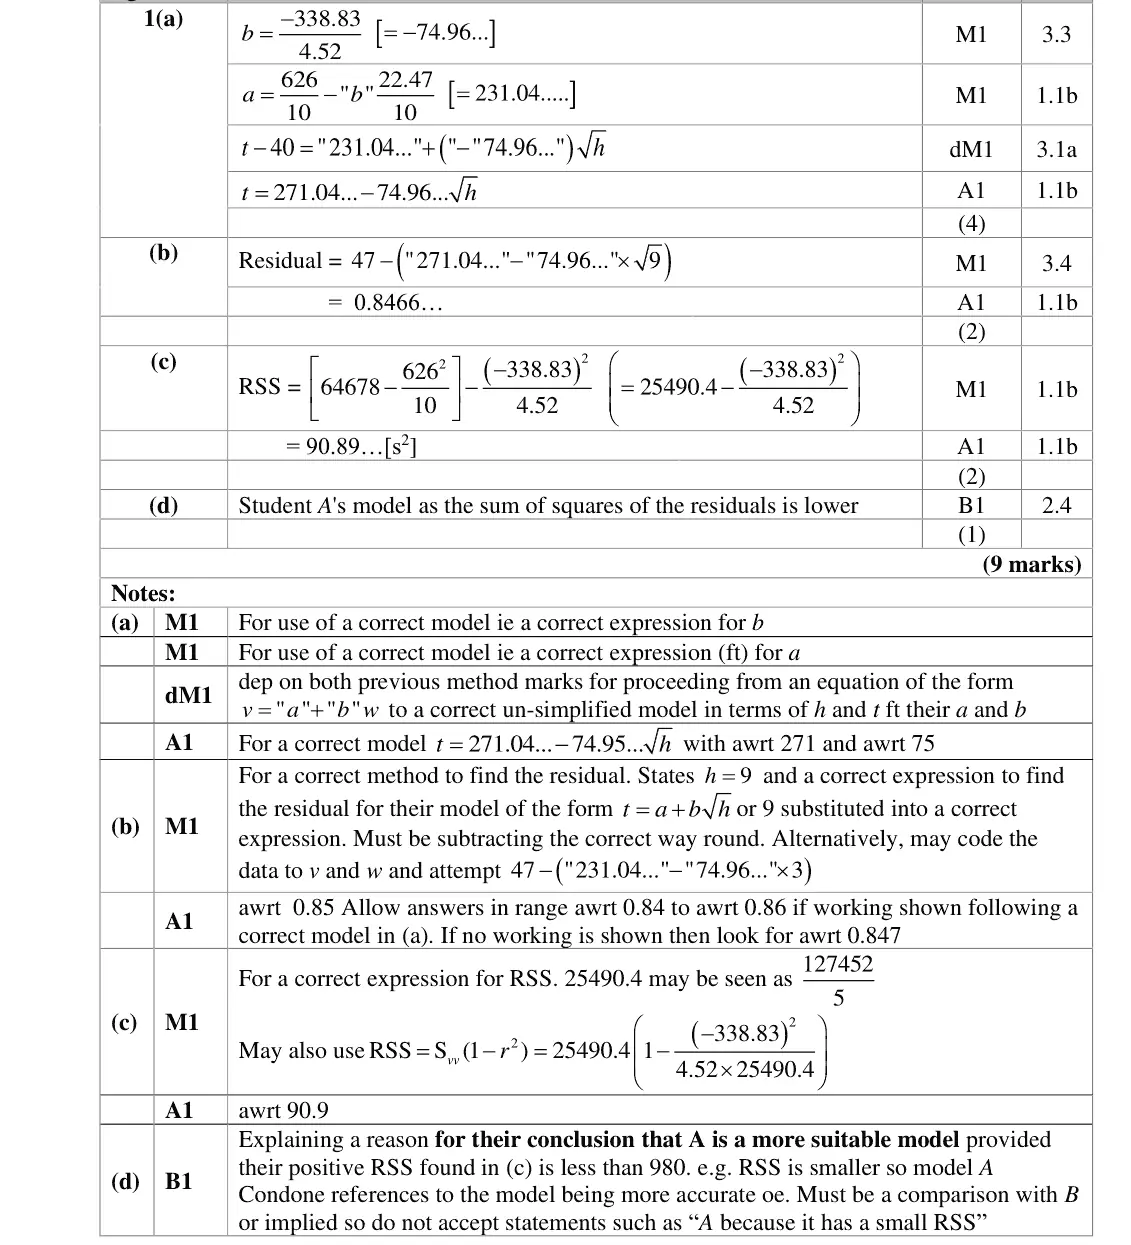
June 2024 · Paper 4B (Further Statistics 2) · Q1(a)4 marks
Mark scheme (whole question; this part is marked with the orange bar)
Examiner's comment
This opening question on the topic of linear regression brought more challenge than expected for some candidates. In part (a) candidates were required to find the regression line h on t having been given coded data in the form of two other variables, v and w. Whilst the majority of candidates made good progress on most of this question, with parts (a) and (c) the most commonly fully correct, there were some who got mixed up with the variables and attempted to find the line h on t. the coefficients obtained in part (a), and some compounded their error by failing to show full workings for finding the residual, and also lost the method mark. Some candidates showed their workings clearly but subtracted the wrong way round for the residual so gained no credit. Many of the candidates who were successful with (c) also went on to make, and adequately justify, the correct decision in (d).
Key points from the mark scheme and examiner's report
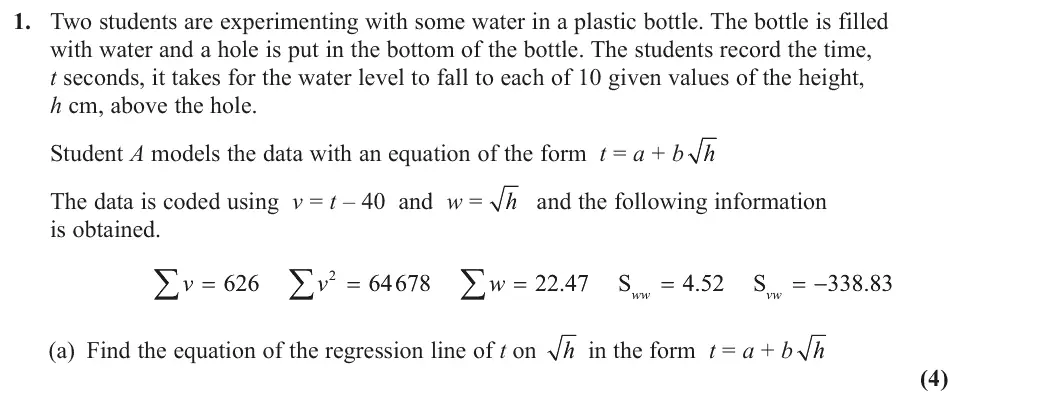
coded regression v on w: b = Svw/Sww = −74.96, a = v̄ − b w̄ = 231.04
decode v = t − 40, w = √h: t = 271.04 − 74.96√h
some found the line the wrong way round (h on t)
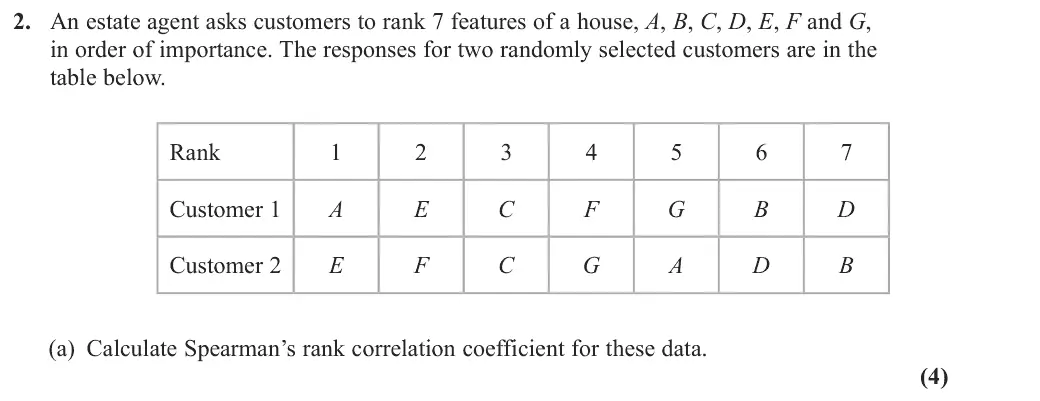
June 2024 · Paper 4B (Further Statistics 2) · Q2(a)4 marks
Mark scheme (whole question; this part is marked with the orange bar)
Examiner's comment
A = etc. Candidates did not always show their (a), instead treating the letters as ranks with 1 working, so it is important that present full solutions with the values in their calculations. reached a negative value in (a) which should have resulted in going back and realising that the method was incorrect. Others lost the final mark for not mentioning the context in the conclusion.
Key points from the mark scheme and examiner's report
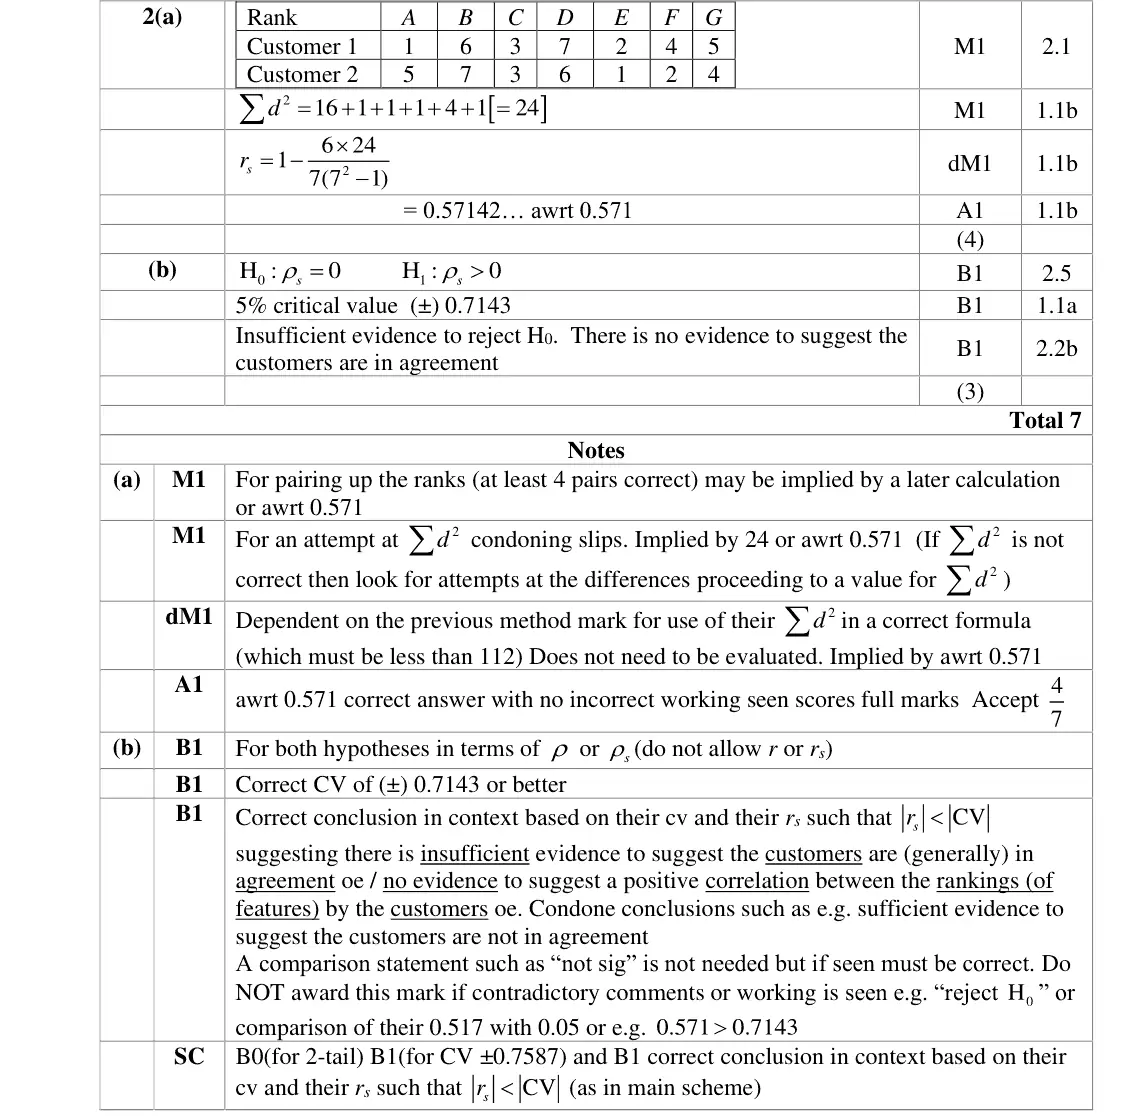
convert to ranks of each feature for each customer (A: 1 and 5, etc.)
Σd² = 24, rs = 1 − 6 × 24/(7 × 48) = 0.571
treating the letters' positions as ranks directly gave negative values
June 2024 · Paper 4B (Further Statistics 2) · Q2(b)3 marks
Mark scheme (whole question; this part is marked with the orange bar)
Examiner's comment
In part (b), candidates were usually successful in setting up correct null and alternative hypotheses. The most common errors were using r instead of with some incorrectly deducing that agreement meant a two-tailed instead of a one-tailed test. Candidates usually found the correct critical value and made a correct comparison, although some candidates had reached a negative value in (a) which should have resulted in going back and realising that the
Key points from the mark scheme and examiner's report
using r not ρ, or a two-tailed test, were common errors
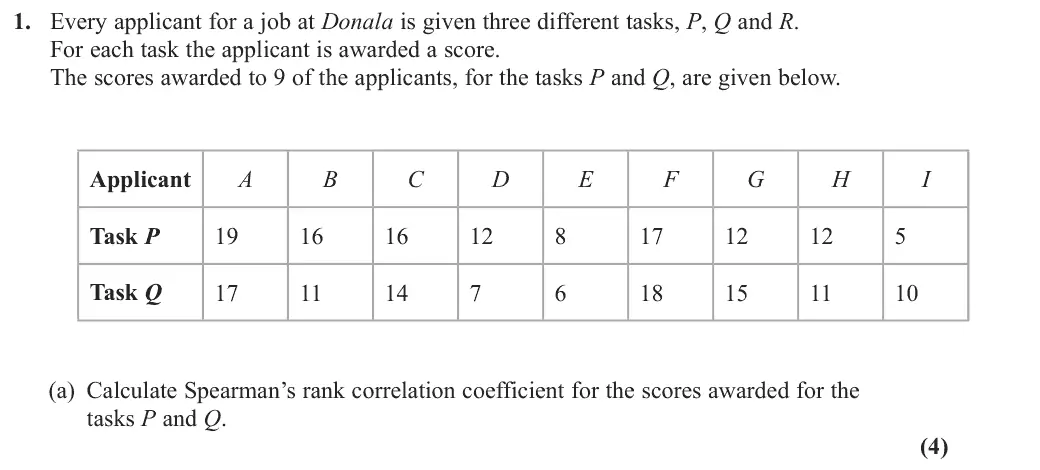
June 2023 · AS Paper 2 (Further Statistics 2) · Q1(a)4 marks
Mark scheme (whole question; this part is marked with the orange bar)
Examiner's comment
Most students could make a start on this question and started to rank the scores. A few didn’t know how to deal properly with the tied ranks, but many scored the first two 2 d method marks. Most went on to use their in the standard formula for Spearman’s rank correlation but a few realised that they should be using the product moment correlation coefficient (pmcc) formula on their ranks and usually went on to obtain the correct answer. A few simply used the pmcc formula on the scores but it was encouraging to see that only one or two students found their d 2 from the scores rather
Key points from the mark scheme and examiner's report
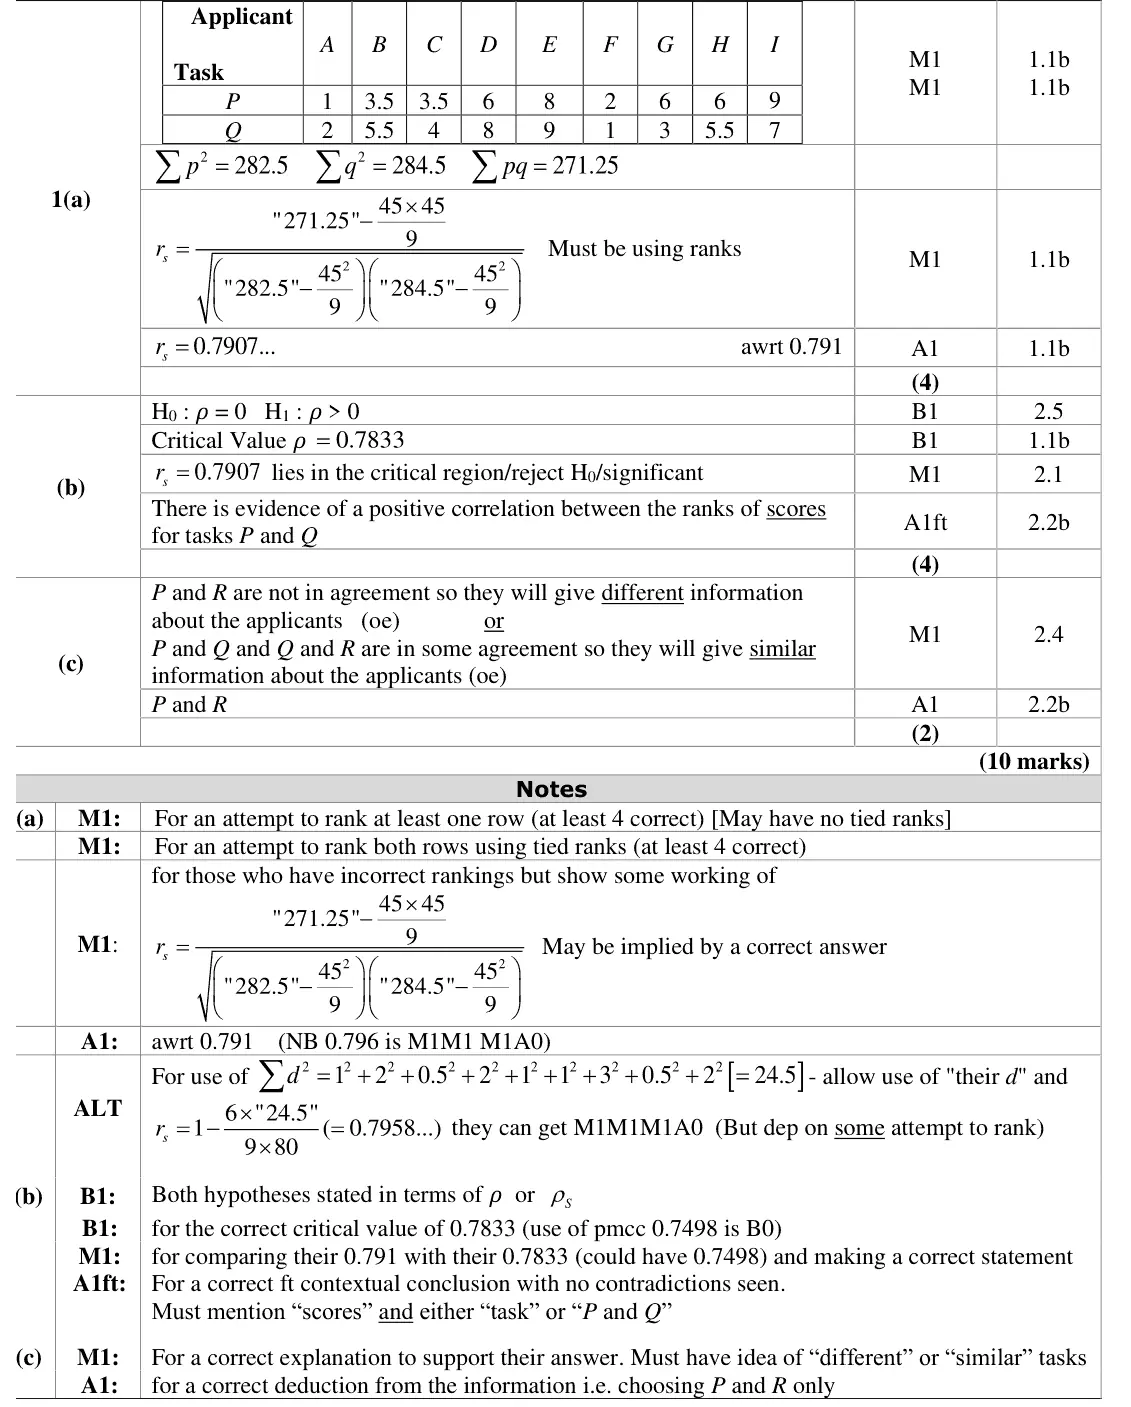
tied ranks in both rows (P: 3.5, 3.5 and 6, 6, 6
Q: 5.5, 5.5)
with ties use the pmcc formula on the ranks: rs = 0.791
using 1 − 6Σd²/(n(n² − 1)) gives 0.796 (3 of 4 marks)
June 2023 · AS Paper 2 (Further Statistics 2) · Q1(b)4 marks
Mark scheme (whole question; this part is marked with the orange bar)
Examiner's comment
than the ranks. In part (b) most gave correct hypotheses in terms of and the majority used the correct critical value of 0.7833. A correct statement about the significance of the test was almost always seen and many also interpreted this clearly mentioning “scores” and the “tasks”.
Key points from the mark scheme and examiner's report
H0: ρs = 0, H1: ρs > 0
Spearman cv 0.7833 at 1% for n = 9 (pmcc 0.7498 is B0)
reject H0: positive correlation between ranks of scores for tasks P and Q, mentioning scores and tasks
June 2023 · AS Paper 2 (Further Statistics 2) · Q1(c)2 marks
Mark scheme (whole question; this part is marked with the orange bar)
Examiner's comment
Part (c) was more discriminating. Most recommended that Q and R were used because they had the greatest correlation, but a few identified that because the correlation between P and R was closer to zero this suggested that these two tasks were identifying different skills and therefore Q could be omitted.
Key points from the mark scheme and examiner's report
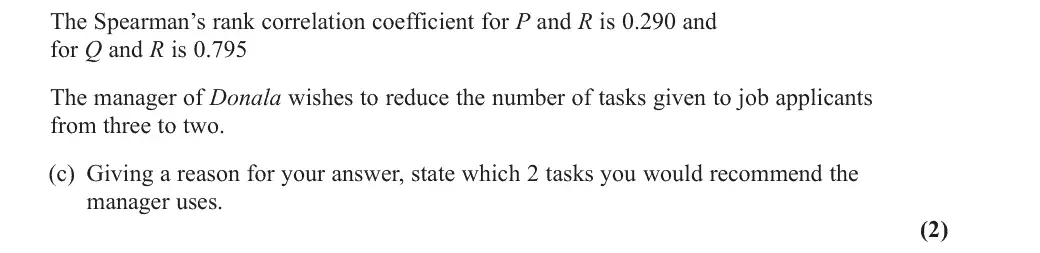
choose P and R: their low correlation (0.290) means they give different information, while Q agrees with both
most wrongly chose the most correlated pair Q and R
June 2023 · AS Paper 2 (Further Statistics 2) · Q3(a)2 marks
Mark scheme (whole question; this part is marked with the orange bar)
Examiner's comment
Part (a) was answered very well and almost all students scored both marks here. The responses to part (b) were more mixed. Many stated that it was consistent because the
Key points from the mark scheme and examiner's report
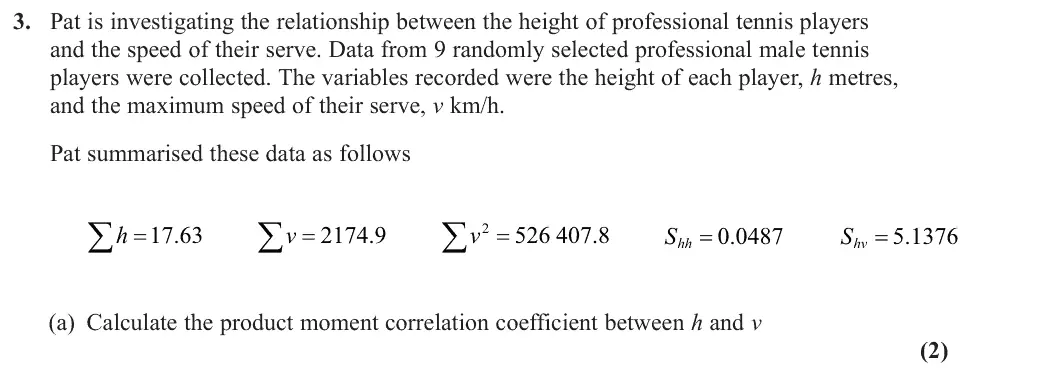
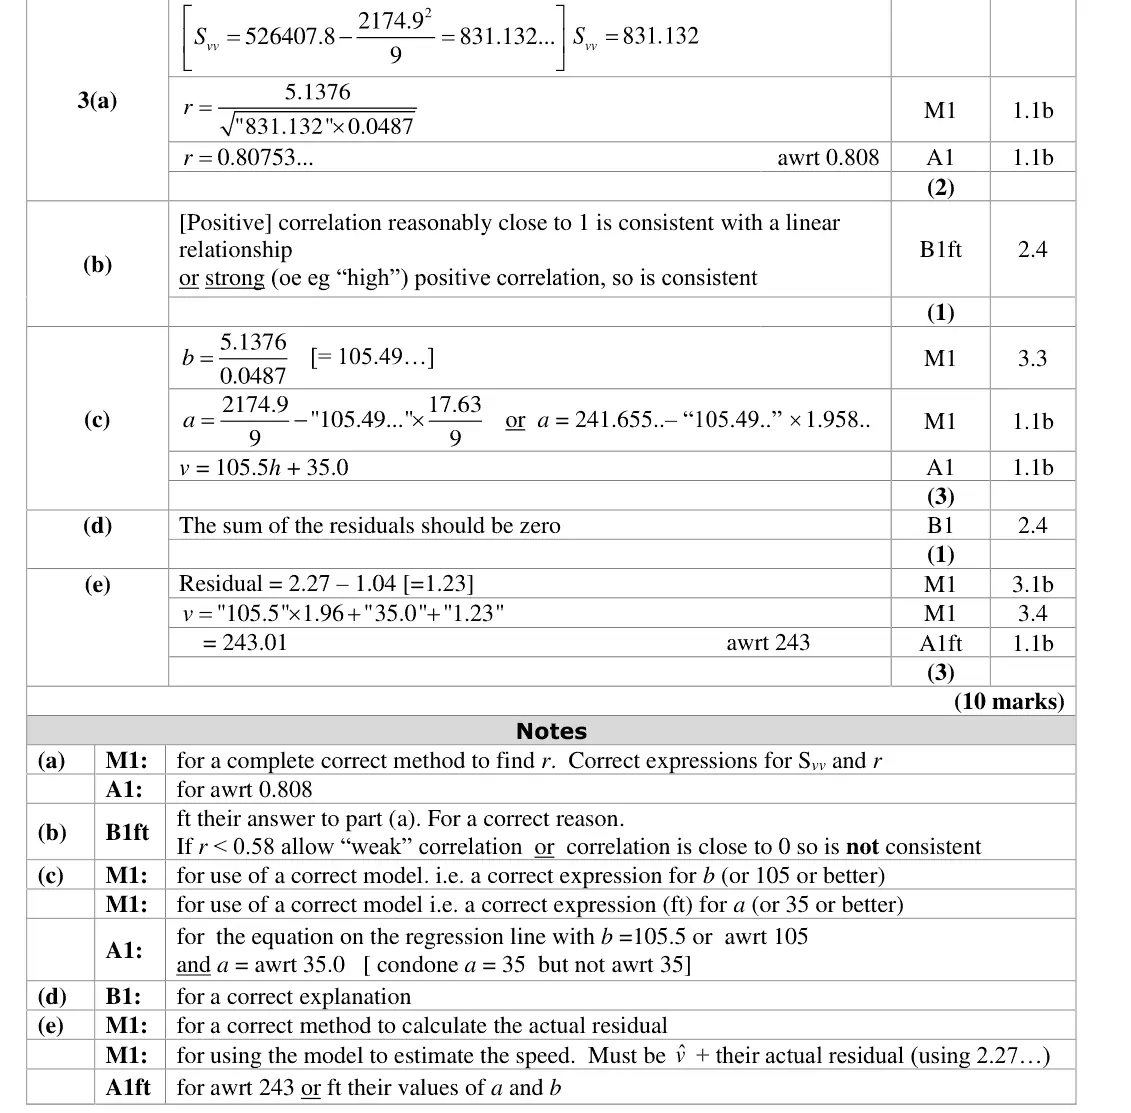
Svv = 526 407.8 − 2174.9²/9 = 831.13
r = 0.808
June 2023 · AS Paper 2 (Further Statistics 2) · Q3(b)1 mark
Mark scheme (whole question; this part is marked with the orange bar)
Examiner's comment
responses to part (b) were more mixed. Many stated that it was consistent because the value of r was “close to 1” or represented “strong” positive correlation. Some weaker students thought that because the value of r was between 1 and – 1 that represented suitable evidence. The calculations in part (c) were usually correct with only a handful
Key points from the mark scheme and examiner's report
strong positive correlation, reasonably close to 1, so consistent with a linear model
"r is between −1 and 1" is not a reason
June 2023 · Paper 4B (Further Statistics 2) · Q1(a)2 marks
Mark scheme (whole question; this part is marked with the orange bar)
Examiner's comment
This was a generally welcoming first question as the first six marks were procedural and very straightforward, allowing candidates a gentle introduction to the paper. Parts (a) and (b) were almost always done correctly. Many candidates subtracted the real and estimated value backwards to obtain a positive residual in
Key points from the mark scheme and examiner's report
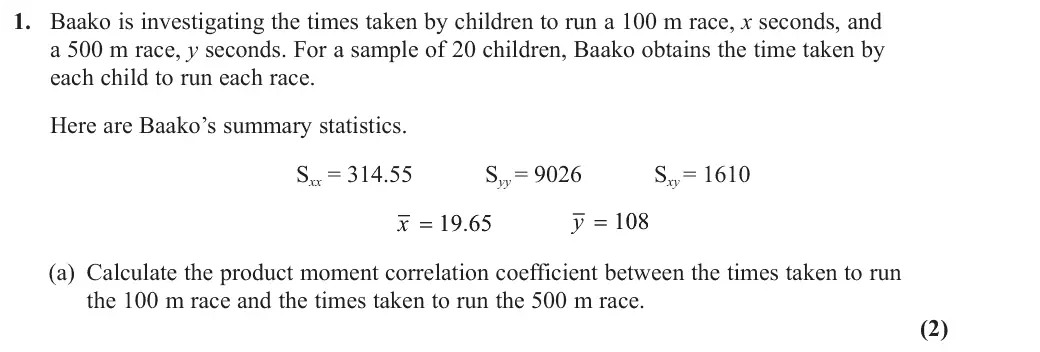
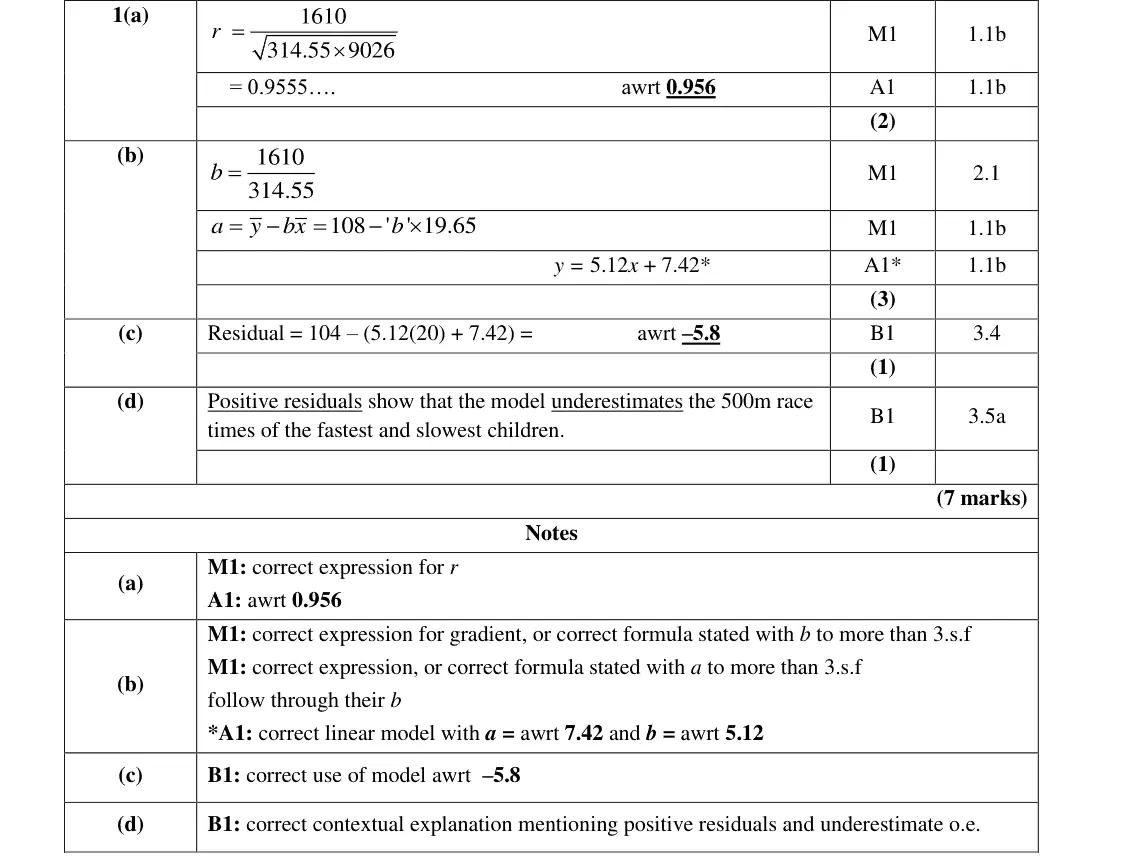
r = 1610/√(314.55 × 9026) = 0.956
June 2022 · AS Paper 2 (Further Statistics 2) · Q1(a)1 mark
Mark scheme (whole question; this part is marked with the orange bar)
Examiner's comment
The majority of candidates made a good start to the paper in part (a) by being able to use the given formulae to obtain the Spearman’s rank correlation coefficient to an appropriate degree of accuracy.
Key points from the mark scheme and examiner's report
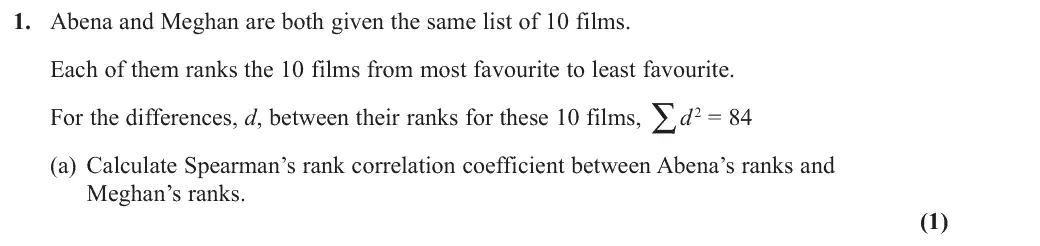
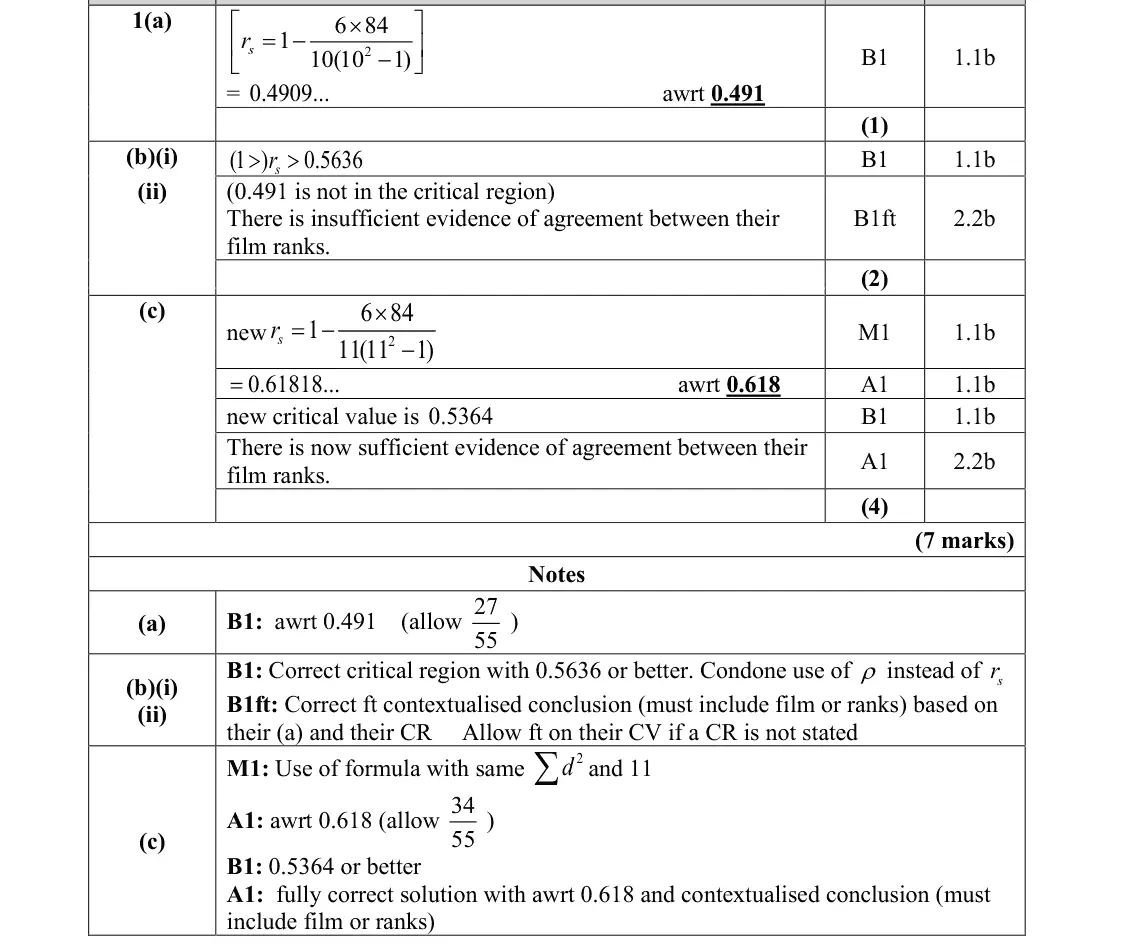
rs = 1 − 6(84)/(10(10² − 1)) = 0.491 (27/55)
June 2022 · AS Paper 2 (Further Statistics 2) · Q1(b)2 marks
Mark scheme (whole question; this part is marked with the orange bar)
Examiner's comment
Part (b)(i) was less successful with the majority of candidates stating a critical value rather than a critical region. A few candidates incorrectly used the PMCC table to find their critical value. In (b)(ii) candidates on the whole gave sufficient context in their conclusion stating there was not enough evidence to reject the null hypothesis, and hence not enough evidence of agreement in the film ranks.
Key points from the mark scheme and examiner's report
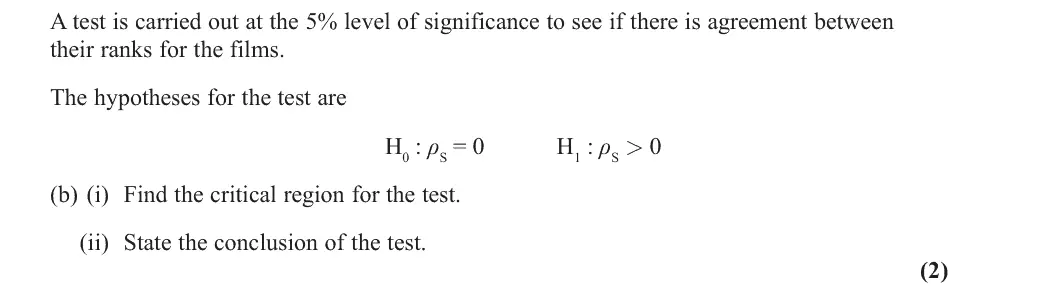
(i) critical region rs > 0.5636 (a region, not just a critical value
do not use the pmcc table)
(ii) not in the CR: insufficient evidence of agreement between their film ranks, in context
June 2022 · AS Paper 2 (Further Statistics 2) · Q1(c)4 marks
Mark scheme (whole question; this part is marked with the orange bar)
Examiner's comment
Part (c) was again well attempted with many demonstrating understanding of how the additional piece of data would affect the Spearman’s rank correlation coefficient. On a few occasions, ∑ 2 d candidates incorrectly believed that since the value of would be unchanged, so would the value of the correlation coefficient, not realising the fact that n was not equal to 11 instead of 10. A correct critical value found in most cases as was a correct contextualised conclusion.
Key points from the mark scheme and examiner's report
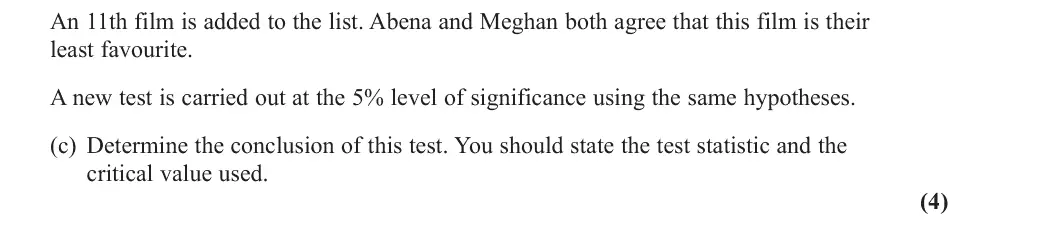
the new film adds d = 0 so Σd² stays 84 but n = 11: rs = 0.618
new cv 0.5364
now sufficient evidence of agreement
some wrongly kept rs unchanged
June 2022 · AS Paper 2 (Further Statistics 2) · Q3(a)3 marks
Mark scheme (whole question; this part is marked with the orange bar)
Examiner's comment
Part (a) of question three proved to be the most accessible part of the paper with the majority of candidates gaining full marks.
Key points from the mark scheme and examiner's report
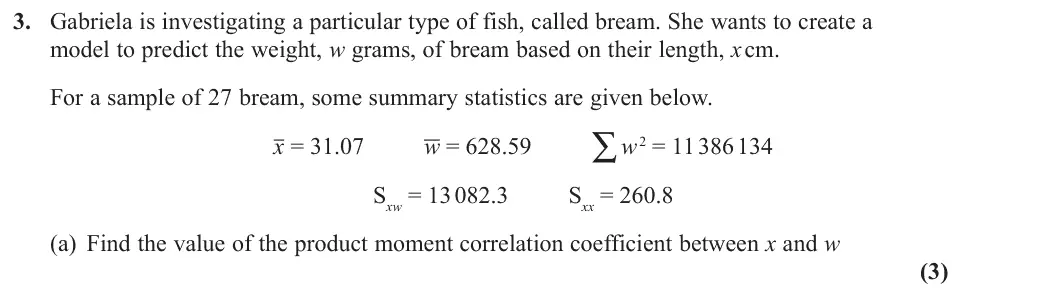
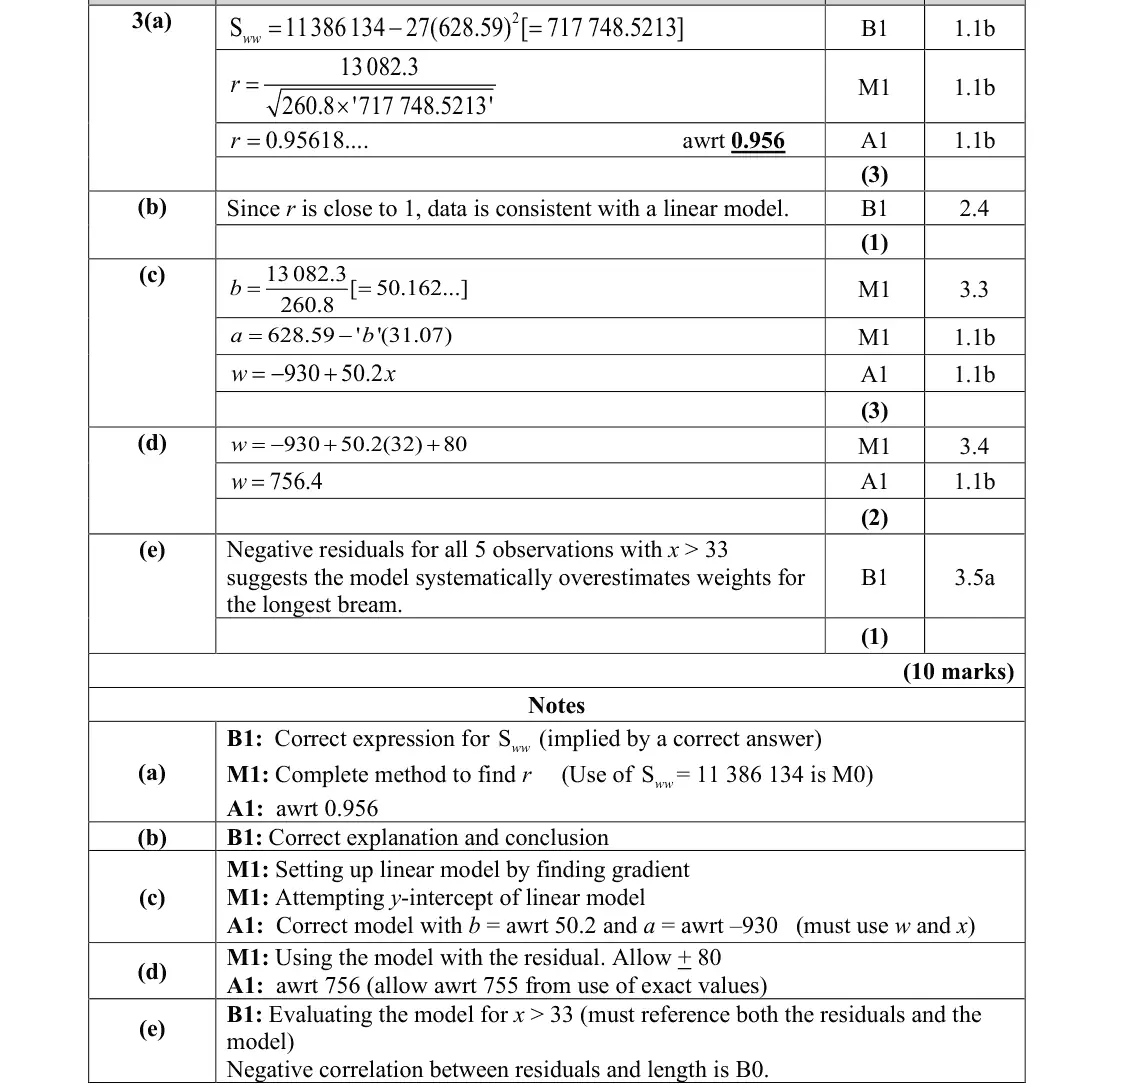
Sww = Σw² − 27(w̄)² = 717 748.5
r = 0.956
using Σw² as Sww scores M0
June 2022 · AS Paper 2 (Further Statistics 2) · Q3(b)1 mark
Mark scheme (whole question; this part is marked with the orange bar)
Examiner's comment
In part (b), the vast majority of candidates stated that since r was close to 1, the data was consistent with a linear model. A few just stated there was positive correlation, but this was not sufficient.
Key points from the mark scheme and examiner's report
r close to 1 so consistent with a linear model
"positive correlation" alone not enough
June 2022 · Paper 4B (Further Statistics 2) · Q1(c)2 marks
Mark scheme (whole question; this part is marked with the orange bar)
Examiner's comment
This question proved to be an accessible start for virtually all candidates. Nearly all made a Part (c) was again well attempted, though many lengthy attempts were seen at calculating the product moment correlation coefficient when candidates should have realised that they had all of the information to complete it in one step. It was not uncommon to see 2 significant figure answers given rather than 3 as instructed on the front cover of the examination paper.
Key points from the mark scheme and examiner's report
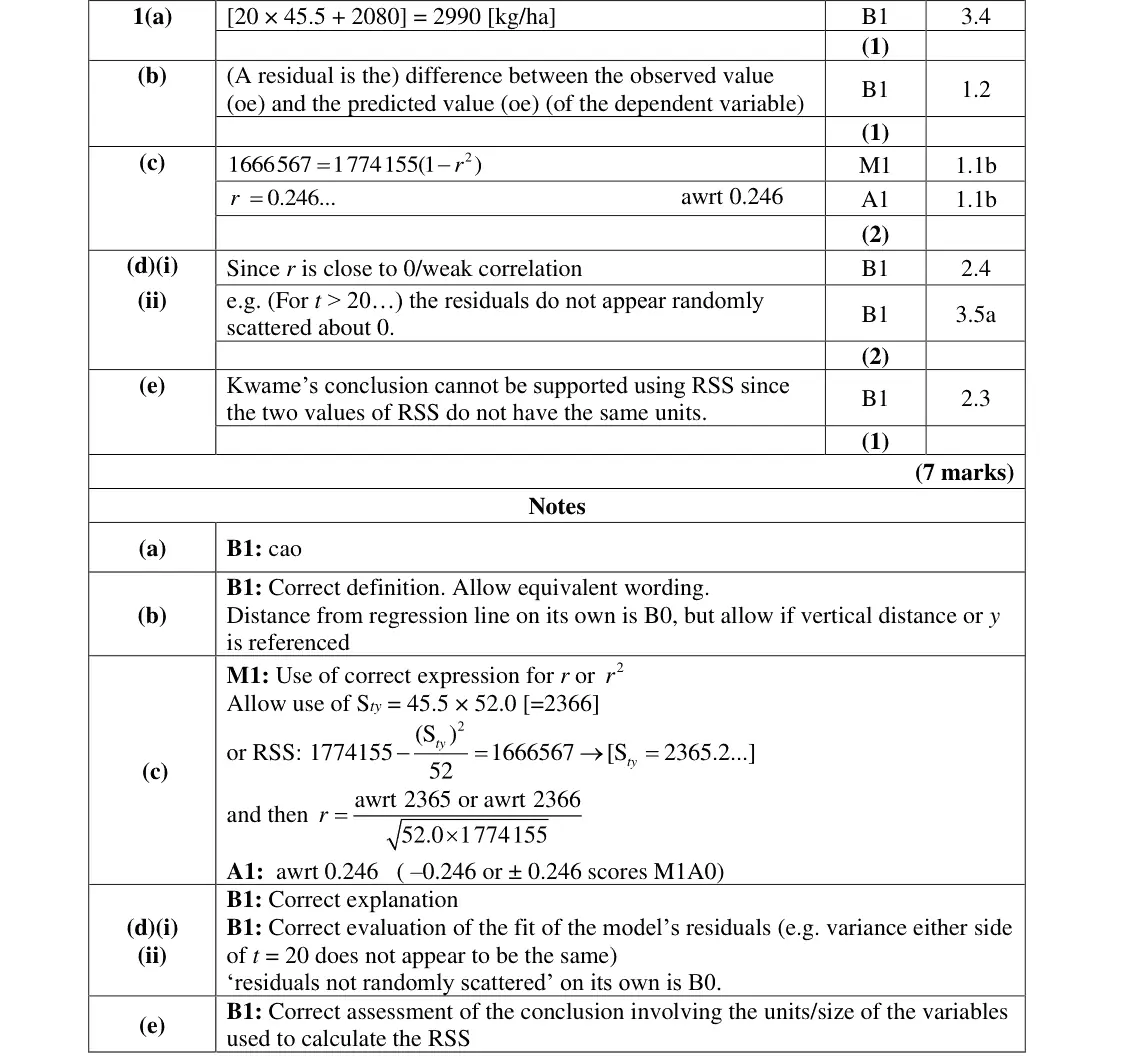
RSS = Syy(1 − r²) gives r = 0.246 in one step (or Sty = 45.5 × 52)
many took lengthy routes
give 3 s.f.
−0.246 scores M1A0
June 2022 · Paper 4B (Further Statistics 2) · Q1(d)2 marks
Mark scheme (whole question; this part is marked with the orange bar)
Examiner's comment
This question proved to be an accessible start for virtually all candidates. Nearly all made a (d)(i) was well accessed with most stating that there was weak correlation. Stating that the value of r was far from one was insufficient as candidates needed to make it clear that it is the proximity to 0 that makes it weak. Candidates struggled more in part (ii) to clearly express themselves, though a number of candidates did correctly identify that for values of t > 20 the residuals were no longer randomly scattered about 0.
Key points from the mark scheme and examiner's report
(i) r is close to 0, weak correlation ('far from 1' not enough)
(ii) for t > 20 the residuals are not randomly scattered about 0 / show a pattern
'not randomly scattered' alone scores 0
Nov 2021 · Paper 4B (Further Statistics 2) · Q1(a)2 marks
Mark scheme (whole question; this part is marked with the orange bar)
Key points from the mark scheme and examiner's report
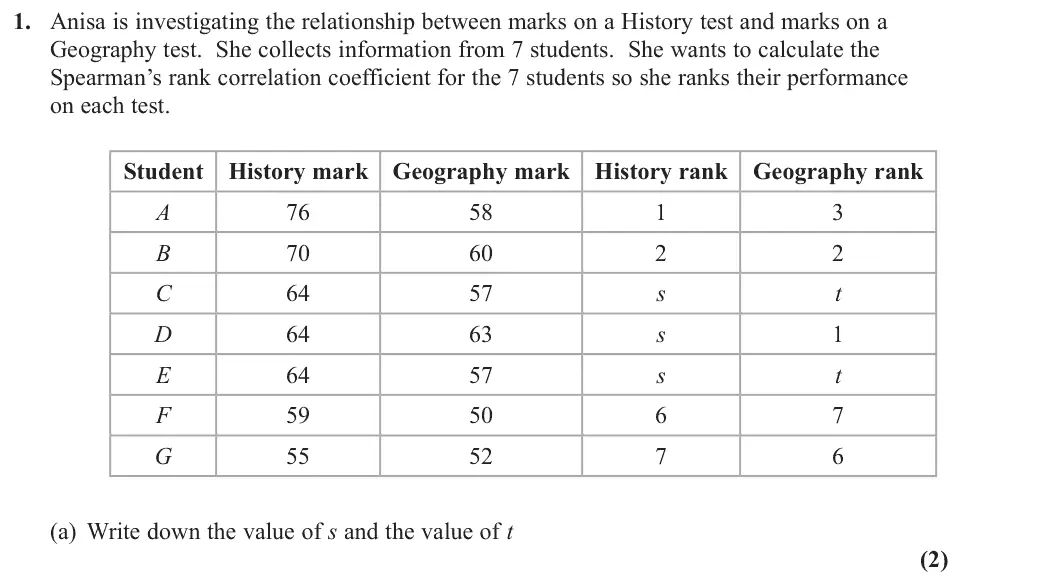
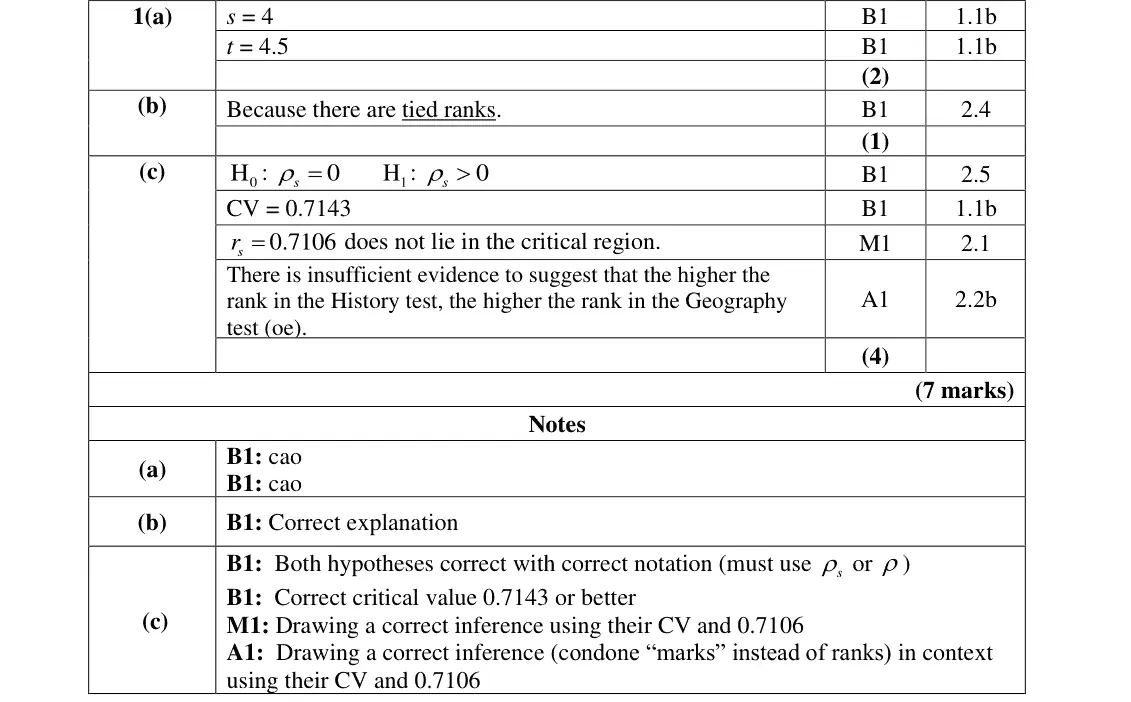
tied ranks share the mean rank: s = 4 (3rd, 4th, 5th), t = 4.5 (4th, 5th)
Nov 2021 · Paper 4B (Further Statistics 2) · Q1(b)1 mark
Mark scheme (whole question; this part is marked with the orange bar)
Key points from the mark scheme and examiner's report
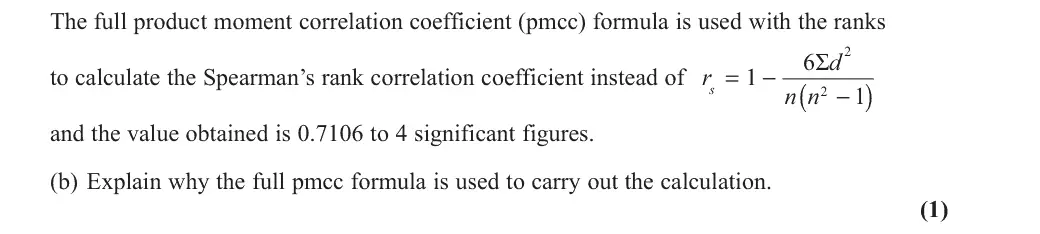
because there are tied ranks (the d² formula is only exact without ties)
Nov 2021 · Paper 4B (Further Statistics 2) · Q1(c)4 marks
Mark scheme (whole question; this part is marked with the orange bar)
Key points from the mark scheme and examiner's report
H₀: ρs = 0, H₁: ρs > 0
CV (n = 7, 5% one-tailed) = 0.7143
0.7106 is not in the critical region, insufficient evidence
conclusion in context of ranks
Nov 2021 · Paper 4B (Further Statistics 2) · Q4(a)1 mark
Mark scheme (whole question; this part is marked with the orange bar)
Key points from the mark scheme and examiner's report
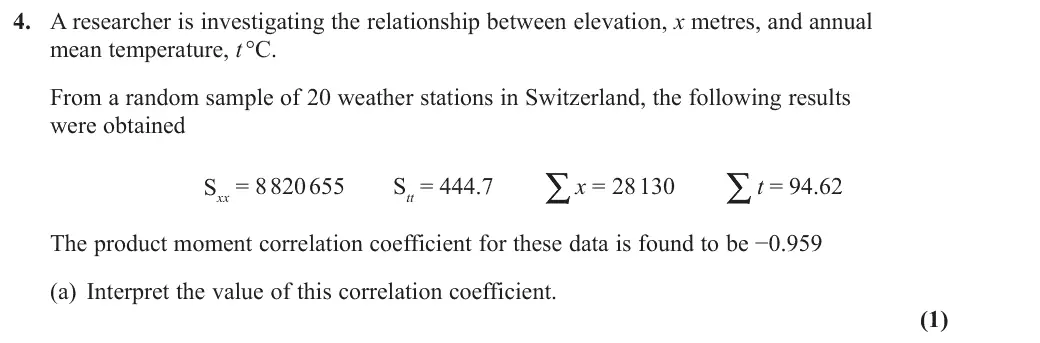
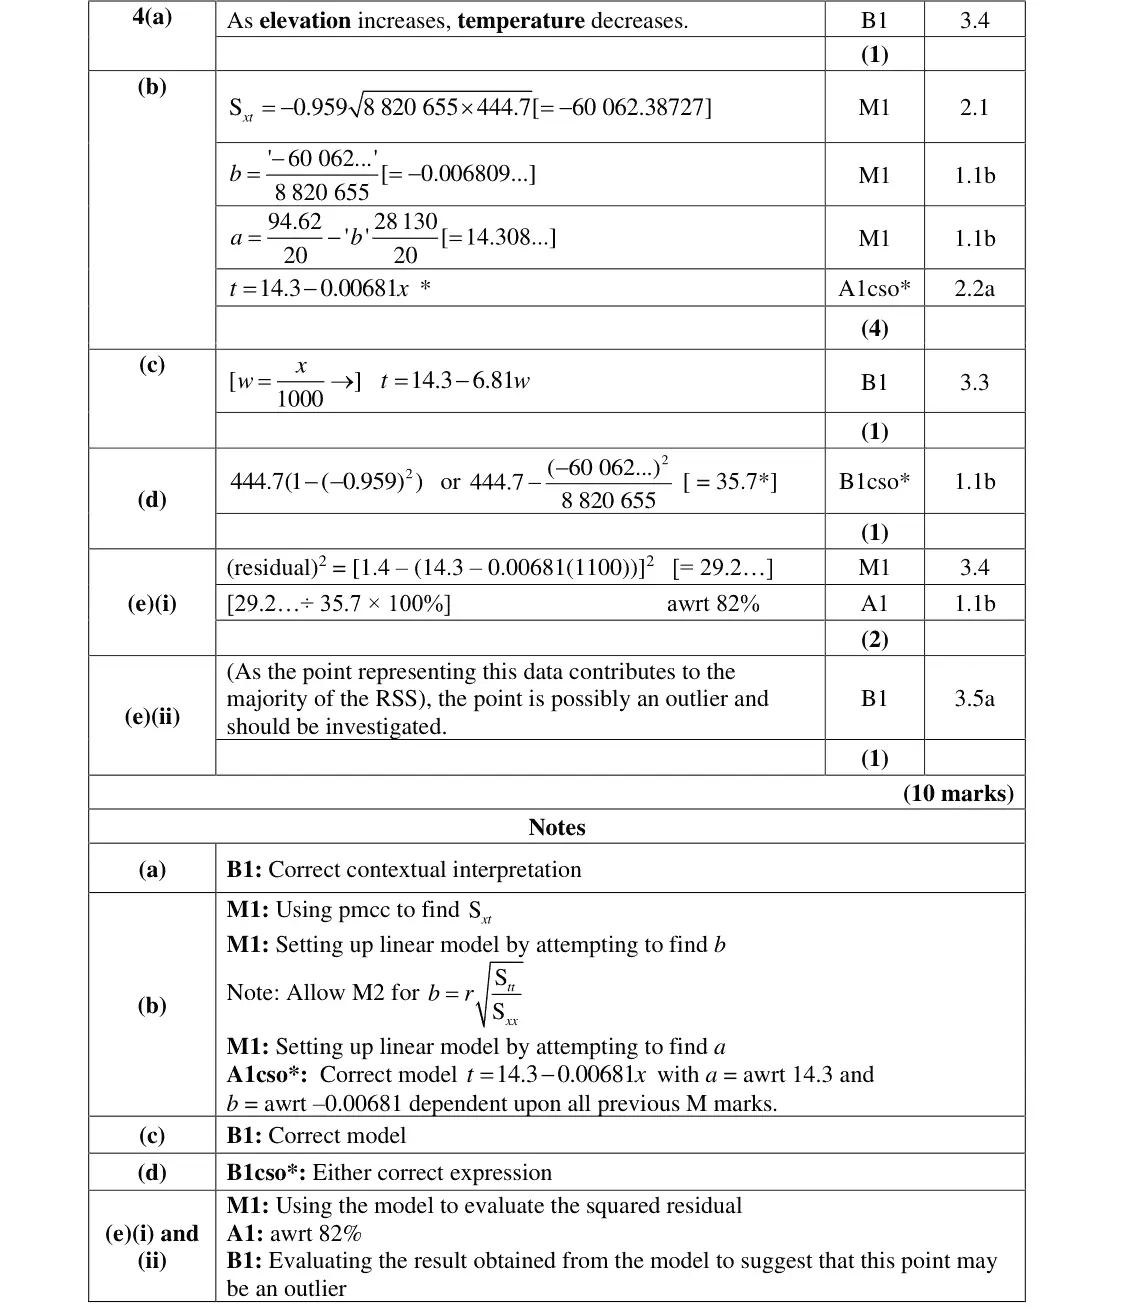
contextual: as elevation increases, temperature decreases (strong negative linear correlation)
Nov 2021 · Paper 4B (Further Statistics 2) · Q4(b)4 marks
Mark scheme (whole question; this part is marked with the orange bar)
Key points from the mark scheme and examiner's report
Sxt = r√(Sxx Stt) = −60062
b = Sxt/Sxx = −0.006809, a = t̄ − b x̄ = 14.308
printed answer t = 14.3 − 0.00681x so all steps shown
Nov 2021 · Paper 4B (Further Statistics 2) · Q4(c)1 mark
Mark scheme (whole question; this part is marked with the orange bar)
Key points from the mark scheme and examiner's report
x = 1000w so t = 14.3 − 6.81w (coding)
Oct 2020 · AS Paper 2 (Further Statistics 2) · Q13 marks
Mark scheme (whole question; this part is marked with the orange bar)
Key points from the mark scheme and examiner's report
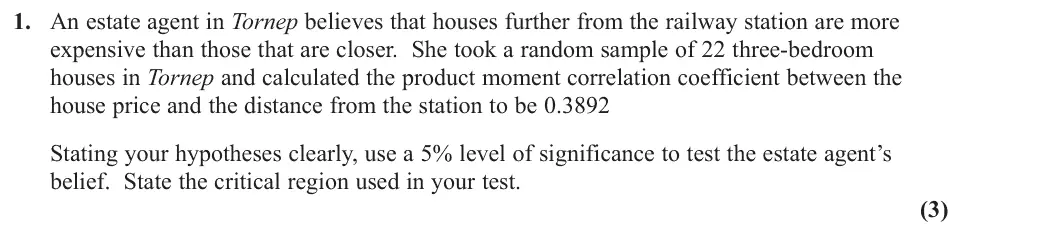
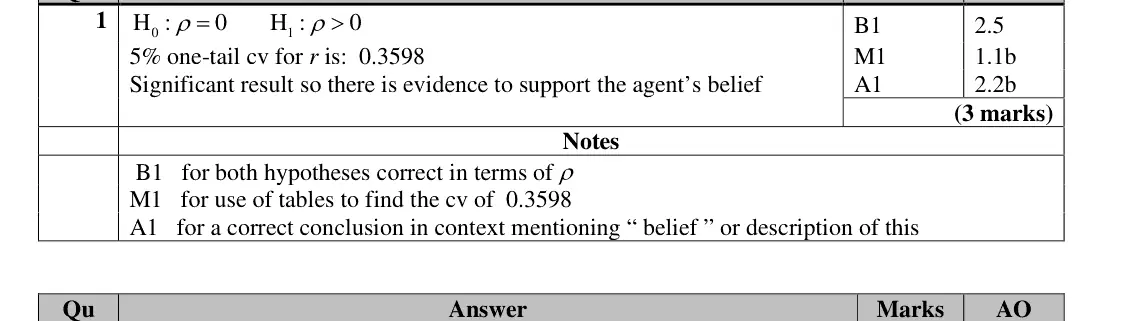
H0: ρ = 0, H1: ρ > 0 (in terms of ρ)
one-tailed 5% cv for n = 22 is 0.3598, critical region r > 0.3598
0.3892 is significant so evidence supports the agent's belief, in context
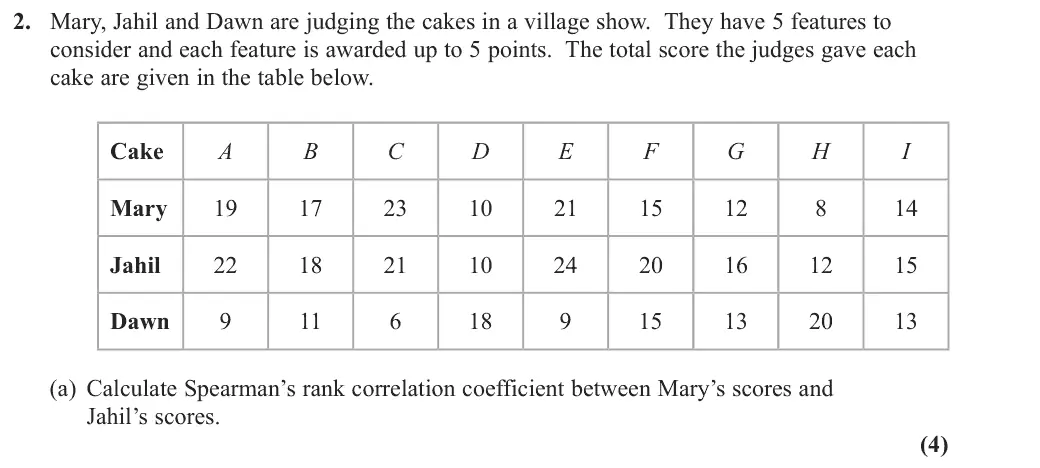
Oct 2020 · AS Paper 2 (Further Statistics 2) · Q2(a)4 marks
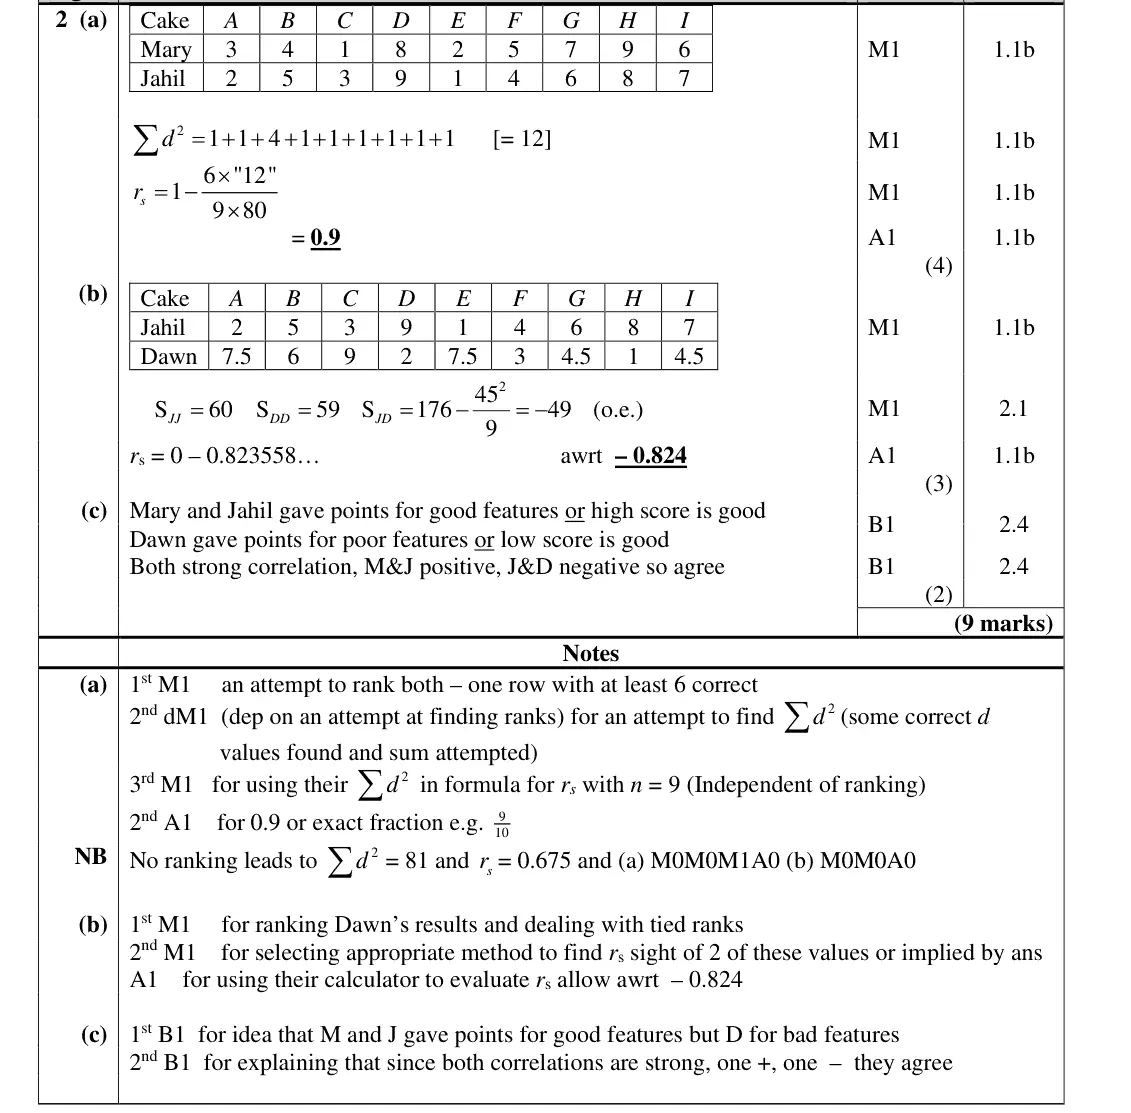
Mark scheme (whole question; this part is marked with the orange bar)
Key points from the mark scheme and examiner's report
rank both judges first (no ranking gives Σd² = 81, rs = 0.675, scoring 1 mark)
Σd² = 12
rs = 1 − 6(12)/(9 × 80) = 0.9
Oct 2020 · AS Paper 2 (Further Statistics 2) · Q2(b)3 marks
Mark scheme (whole question; this part is marked with the orange bar)
Key points from the mark scheme and examiner's report
Dawn has tied ranks (7.5, 7.5 and 4.5, 4.5) so use the pmcc on the ranks: SJJ = 60, SDD = 59, SJD = −49
rs = −0.824
Oct 2020 · AS Paper 2 (Further Statistics 2) · Q2(c)2 marks
Mark scheme (whole question; this part is marked with the orange bar)
Key points from the mark scheme and examiner's report
Mary and Jahil gave points for good features, Dawn for poor features (low score = good)
both correlations strong, one positive and one negative, so all three really agree
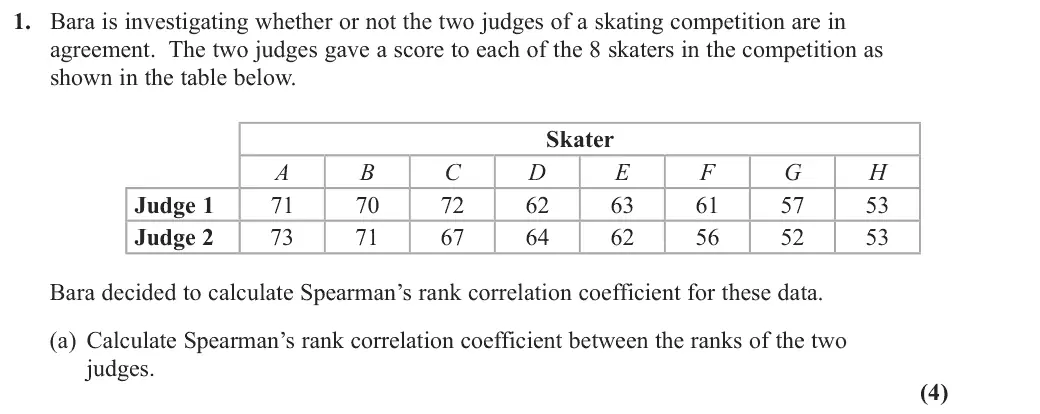
June 2019 · AS Paper 2 (Further Statistics 2) · Q1(a)4 marks
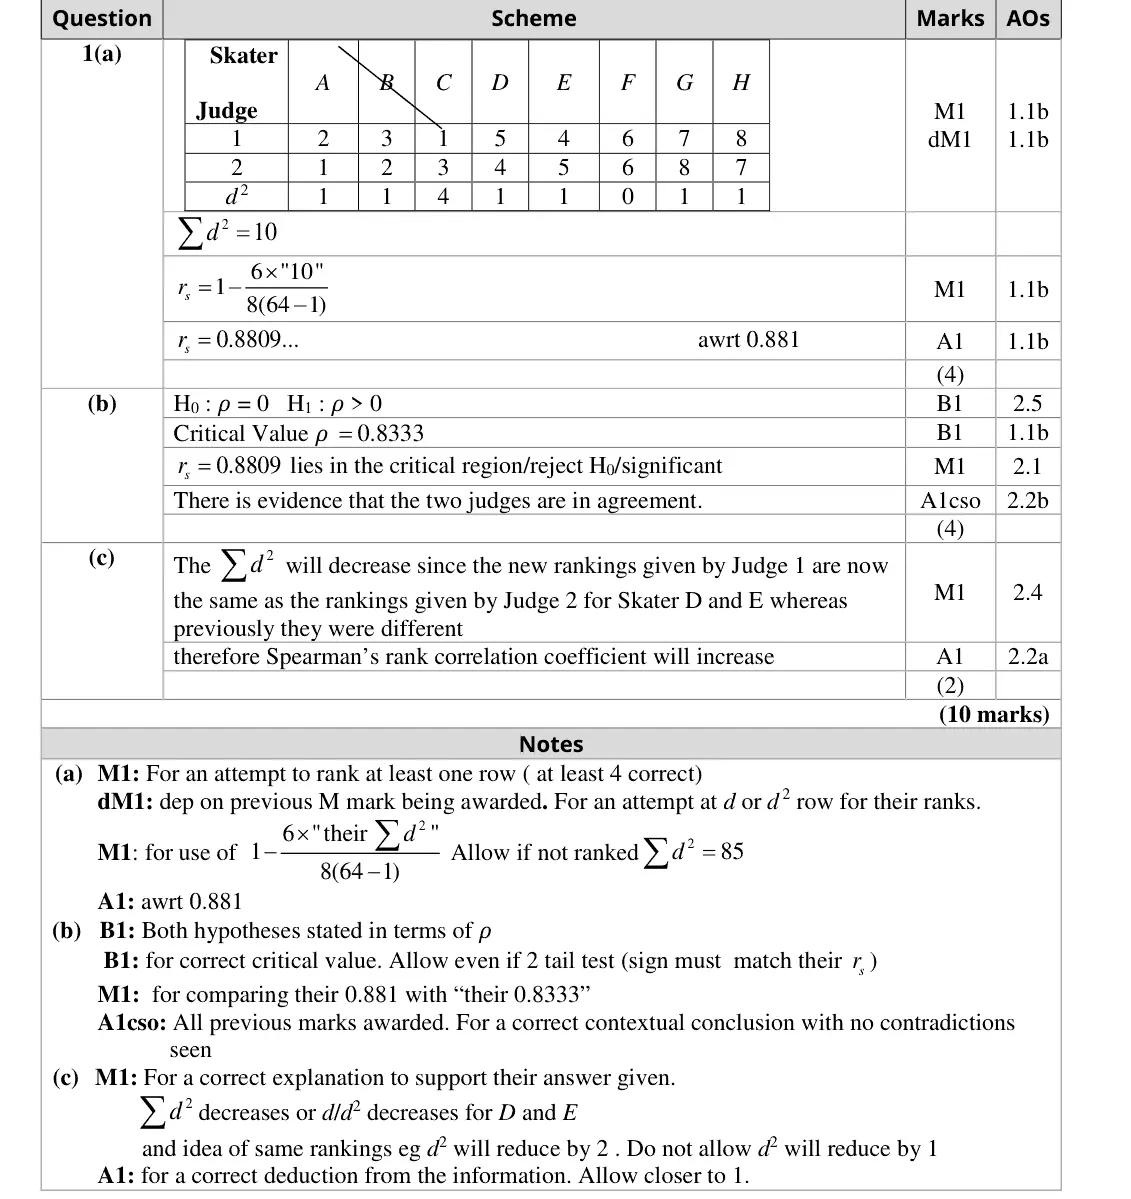
Mark scheme (whole question; this part is marked with the orange bar)
Examiner's comment
The majority of candidates made a good start to the paper in part (a) by being able to use the given formulae to obtain the product Spearman’s rank correlation coefficient. A minority of candidates forgot to rank the data and found the differences between the scores.
Key points from the mark scheme and examiner's report
rank each judge's scores first (some found differences of the raw scores)
Σd² = 10
rs = 1 − 6(10)/(8(64 − 1)) = 0.881
June 2019 · AS Paper 2 (Further Statistics 2) · Q1(b)4 marks
Mark scheme (whole question; this part is marked with the orange bar)
Examiner's comment
Part (b) was also well attempted with the majority of candidates being able to find the critical value and draw a correct conclusion. The main error that occurred was not writing the hypotheses in terms of Rho. would decrease although we allowed d or d2 decrease for D and E. The second part was to indicate that the ranks of D and E would be the same. The most common explanation given that did not have the required detail was “the judges are in more agreement therefore Spearman’s rank correlation coefficient would decrease”
Key points from the mark scheme and examiner's report
H0: ρs = 0, H1: ρs > 0 (hypotheses in terms of ρ, the commonest loss)
cv 0.8333 at 1%
reject H0: evidence the judges agree
June 2019 · AS Paper 2 (Further Statistics 2) · Q1(c)2 marks
Mark scheme (whole question; this part is marked with the orange bar)
Examiner's comment
Part (c) proved to be one of the more challenging parts of the paper. On the whole candidates knew that the correlation coefficient would increase but were unable to give a complete 2 d reason. The required reason consisted of two parts. The first was to realise that to the would decrease although we allowed d or d2 decrease for D and E. The second part was to
Key points from the mark scheme and examiner's report
swapping D and E makes Judge 1's ranks match Judge 2's for D and E, so Σd² decreases (by 2) and rs increases
"judges agree more" alone was not enough
June 2019 · AS Paper 2 (Further Statistics 2) · Q3(a)2 marks
Mark scheme (whole question; this part is marked with the orange bar)
Examiner's comment
Part (a) of question three proved to be the most accessible part of the paper with the majority of candidates gaining full marks. In part (b) whilst most candidates realised that the product moment correlation coefficient would be the same as part (a) a minority of candidates either forgot or were unable to give a suitable reason. The nearly all candidates were able to gain some marks in part (c) with those using the
Key points from the mark scheme and examiner's report
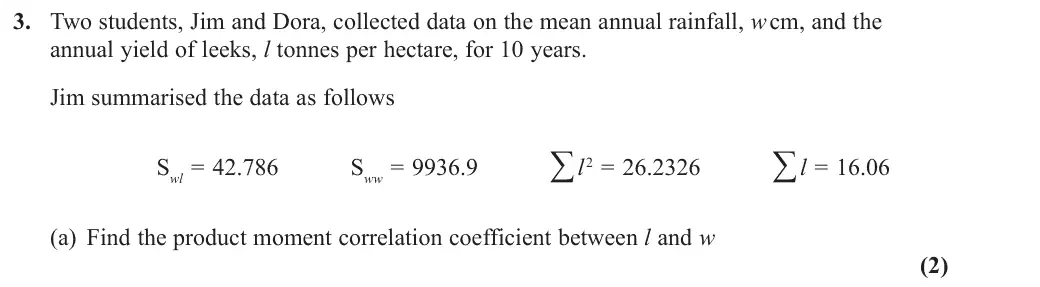
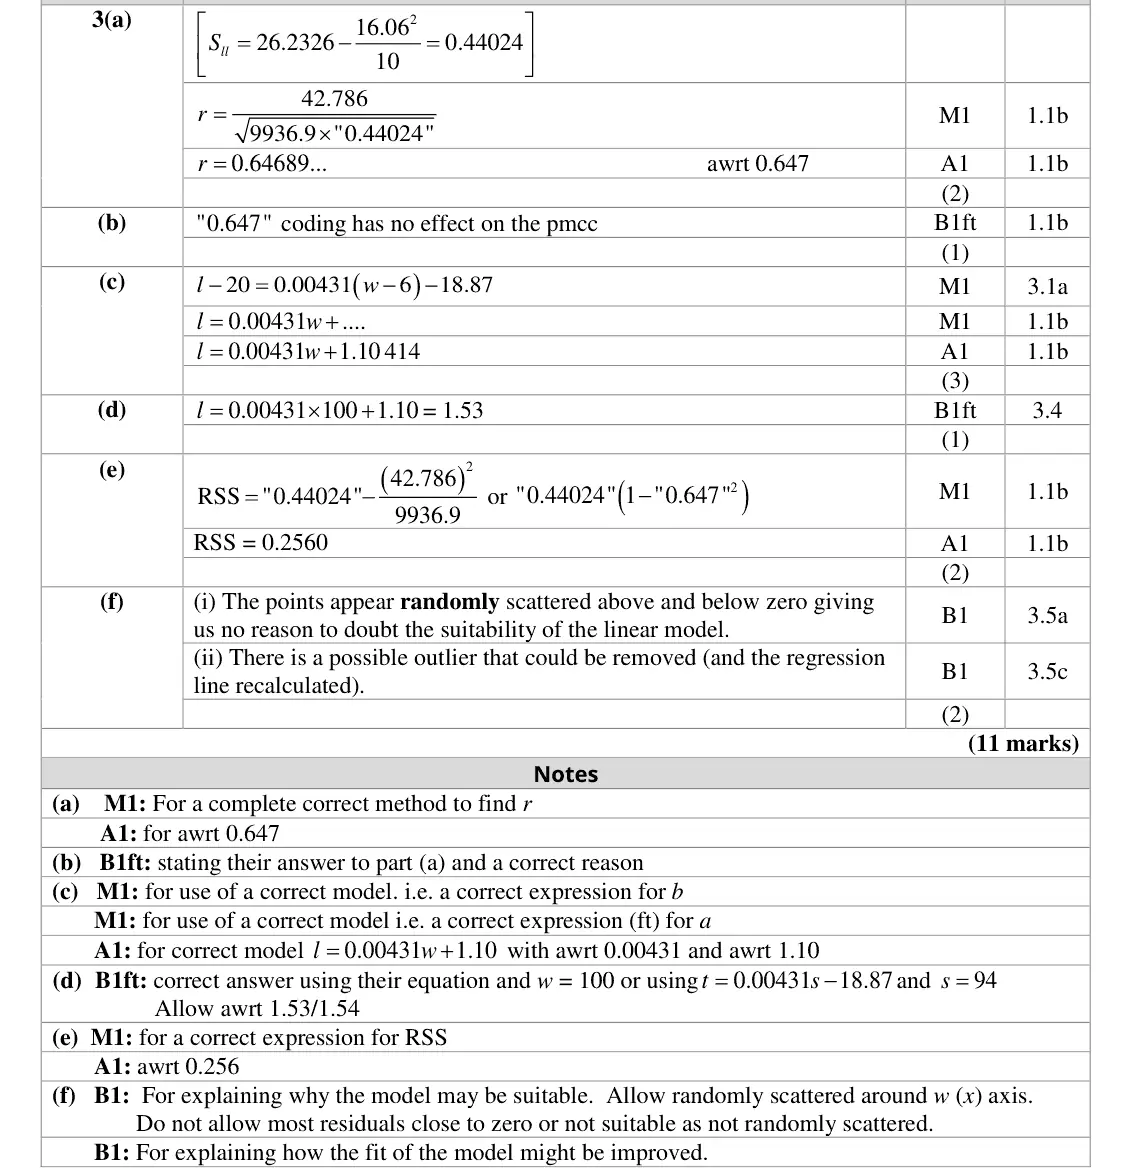
Sll = 26.2326 − 16.06²/10 = 0.44024
r = 0.647
well answered
June 2019 · AS Paper 2 (Further Statistics 2) · Q3(b)1 mark
Mark scheme (whole question; this part is marked with the orange bar)
Examiner's comment
of candidates gaining full marks. In part (b) whilst most candidates realised that the product moment correlation coefficient would be the same as part (a) a minority of candidates either
Key points from the mark scheme and examiner's report
0.647 (same as (a)) because linear coding does not affect the pmcc
reason often missing
June 2019 · Paper 4B (Further Statistics 2) · Q2(a)2 marks
Mark scheme (whole question; this part is marked with the orange bar)
Examiner's comment
This question was well answered with the majority of candidates gaining the marks in the first four parts.
Key points from the mark scheme and examiner's report
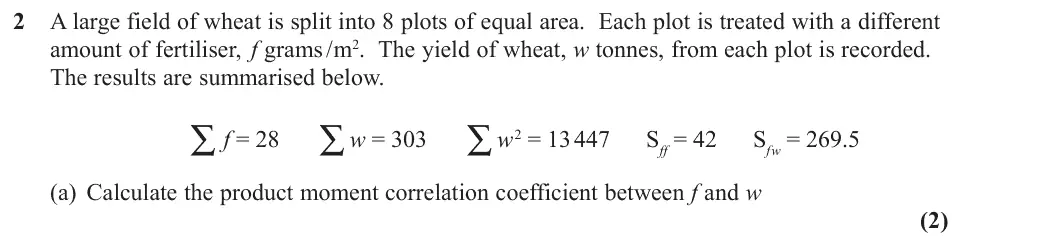
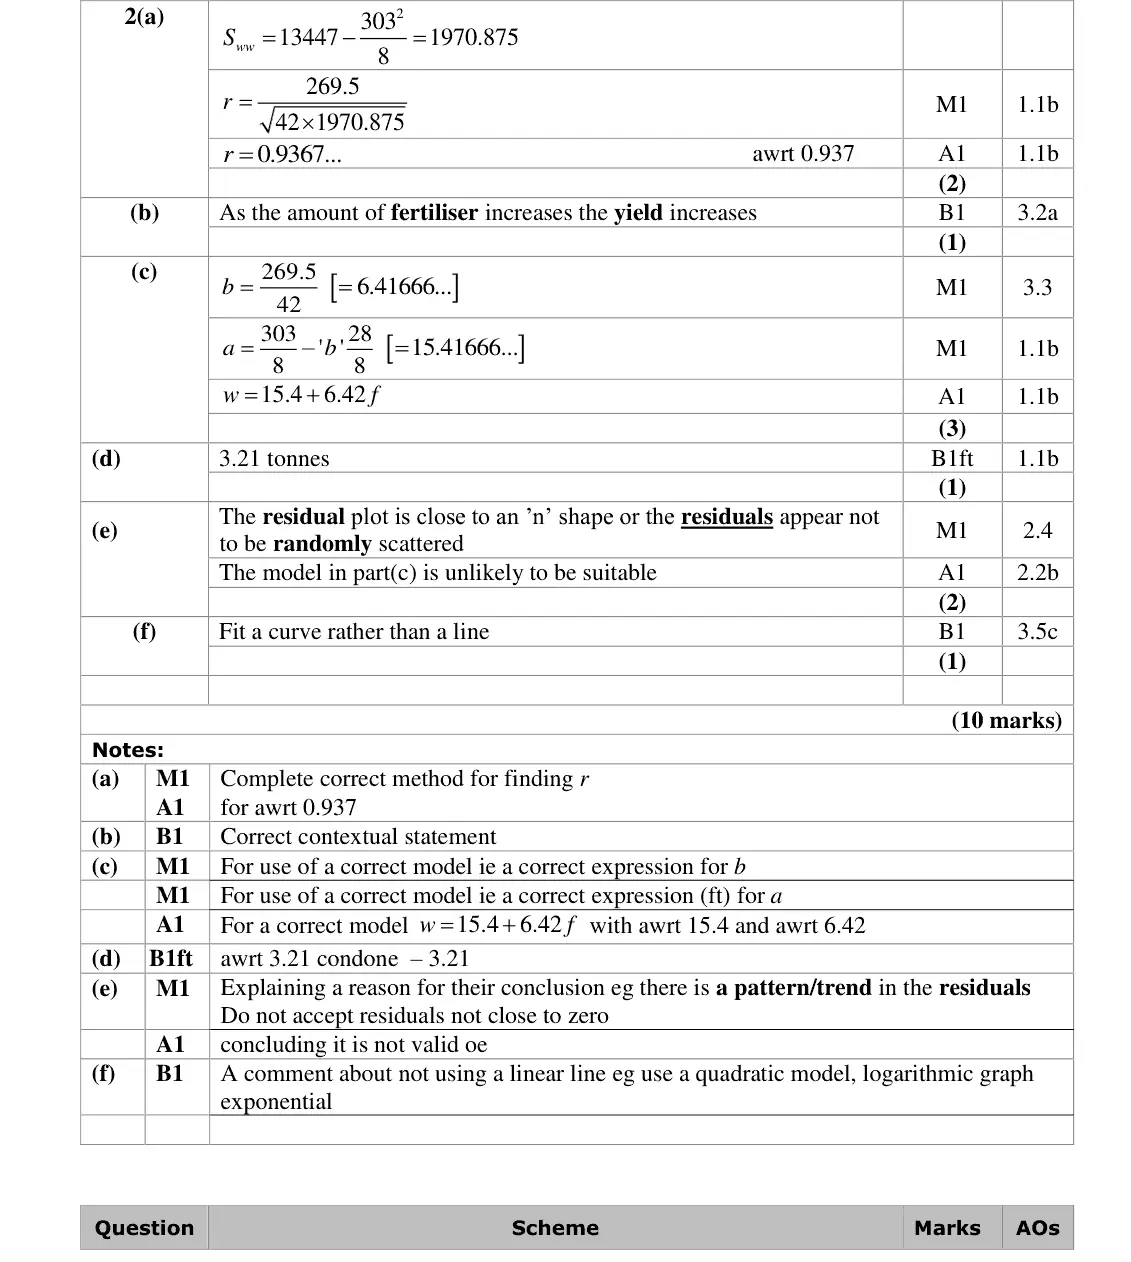
Sww = 13447 − 303²/8 = 1970.875
r = 269.5/√(42 × 1970.875) = 0.937
June 2019 · Paper 4B (Further Statistics 2) · Q2(b)1 mark
Mark scheme (whole question; this part is marked with the orange bar)
Examiner's comment
This question was well answered with the majority of candidates gaining the marks in the first four parts.
Key points from the mark scheme and examiner's report
contextual: as the amount of fertiliser increases the yield increases
June 2019 · Paper 4B (Further Statistics 2) · Q8(a)4 marks
Mark scheme (whole question; this part is marked with the orange bar)
Examiner's comment
Part (a) was well answered with only a minority of candidates using the critical value for the pmcc rather than for Spearman’s. In part (b) it was pleasing to see that the majority of
Key points from the mark scheme and examiner's report
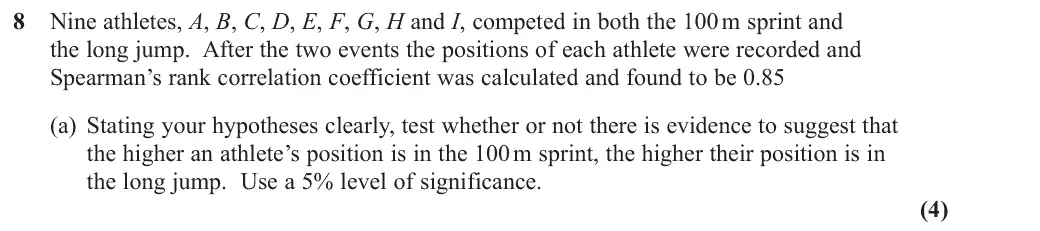
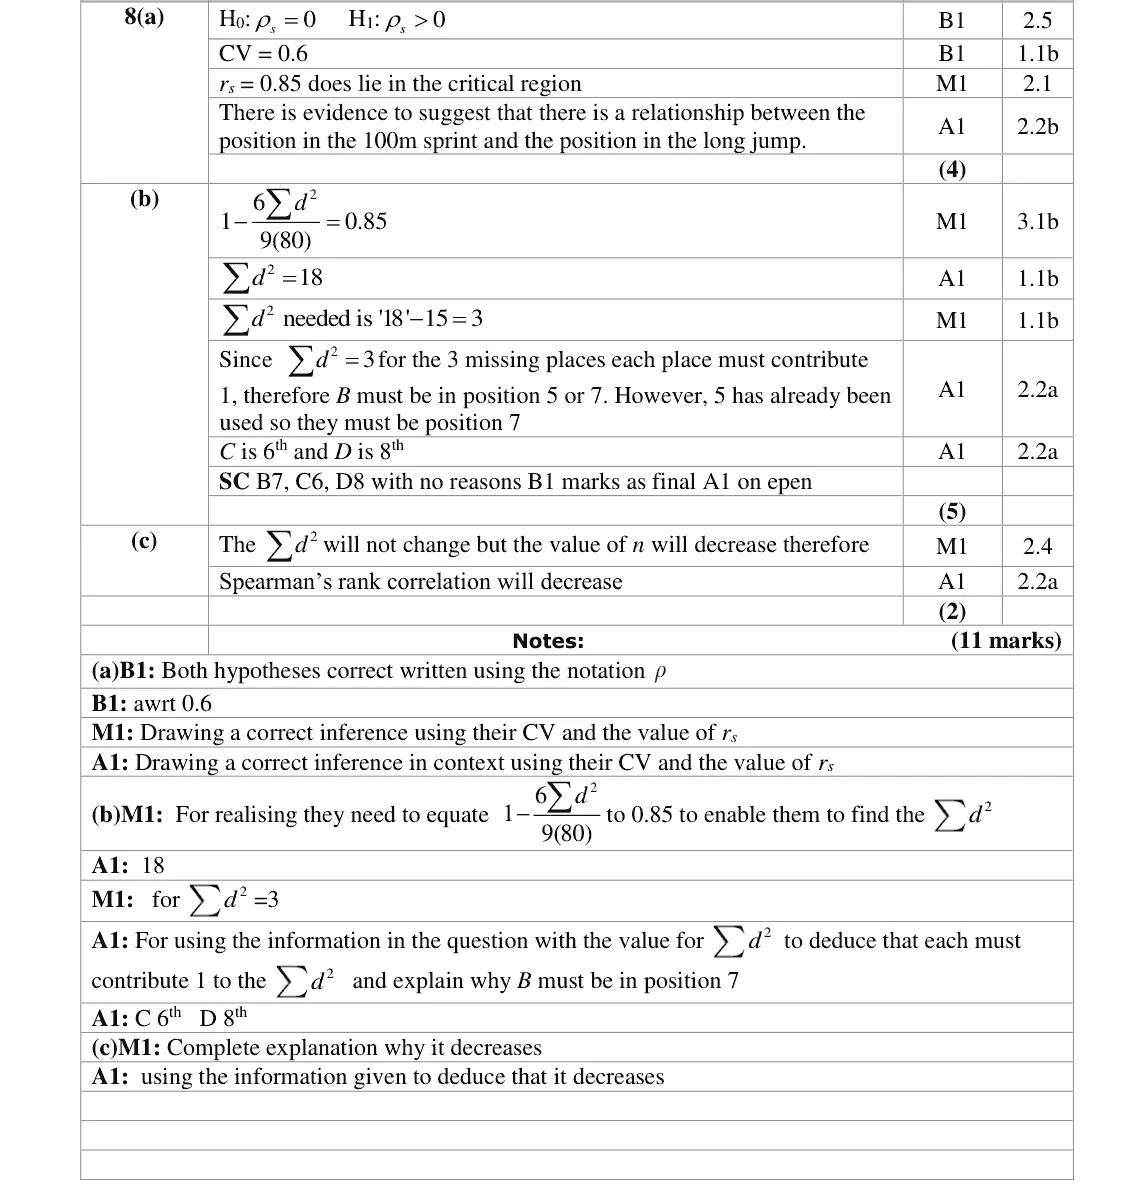
H₀: ρs = 0, H₁: ρs > 0
CV (n = 9, 5% one-tailed) = 0.6
0.85 is in the critical region, evidence of positive correlation
some used the pmcc critical value
June 2019 · Paper 4B (Further Statistics 2) · Q8(b)5 marks
Mark scheme (whole question; this part is marked with the orange bar)
Examiner's comment
pmcc rather than for Spearman’s. In part (b) it was pleasing to see that the majority of candidates showed their working clearly and attempted to give a reason for their answer. Very few candidates gave a satisfactory reason as to why B must be in position 7 or alternatively why D was in 8th although the majority did allocate the positions correctly.
Key points from the mark scheme and examiner's report
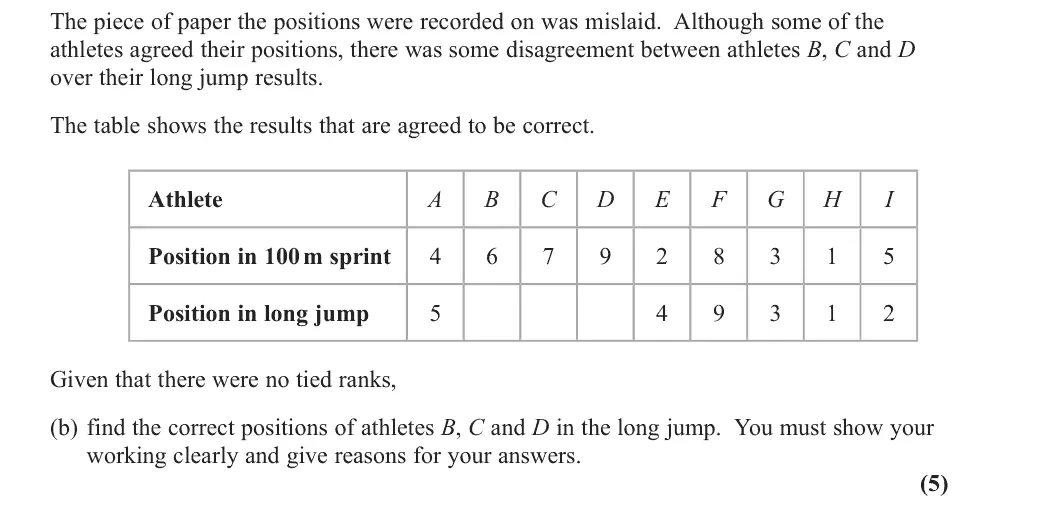
1 − 6Σd²/(9 × 80) = 0.85 gives Σd² = 18
known d² sum 15, so remaining 3 means each d² = 1
B is 7th (5 taken), C 6th, D 8th
reasons needed, few justified B in 7th
June 2019 · Paper 4B (Further Statistics 2) · Q8(c)2 marks
Mark scheme (whole question; this part is marked with the orange bar)
Examiner's comment
In part (c) we need to see a complete explanation. The most common explanation given was 2 d that d would not change however this needs to be linked to the not changing as this is what is used in the formulae.
Key points from the mark scheme and examiner's report
H's d = 0 so Σd² is unchanged but n falls from 9 to 8, so rs decreases
must link the unchanged Σd² to the formula
June 2018 · AS Paper 2 (Further Statistics 2) · Q1(a)2 marks
Mark scheme (whole question; this part is marked with the orange bar)
Examiner's comment
Virtually all students made a good start to the paper in part (a) by being able to use the given formulae to obtain the product moment correlation coefficient. Answers should be given to at least 3 significant figure accuracy (although here 0.97 was allowed following correct working).
Key points from the mark scheme and examiner's report
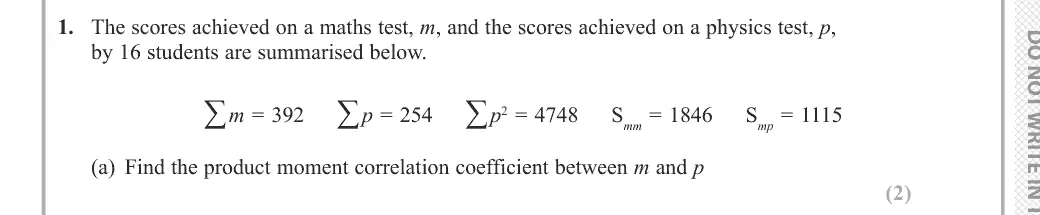
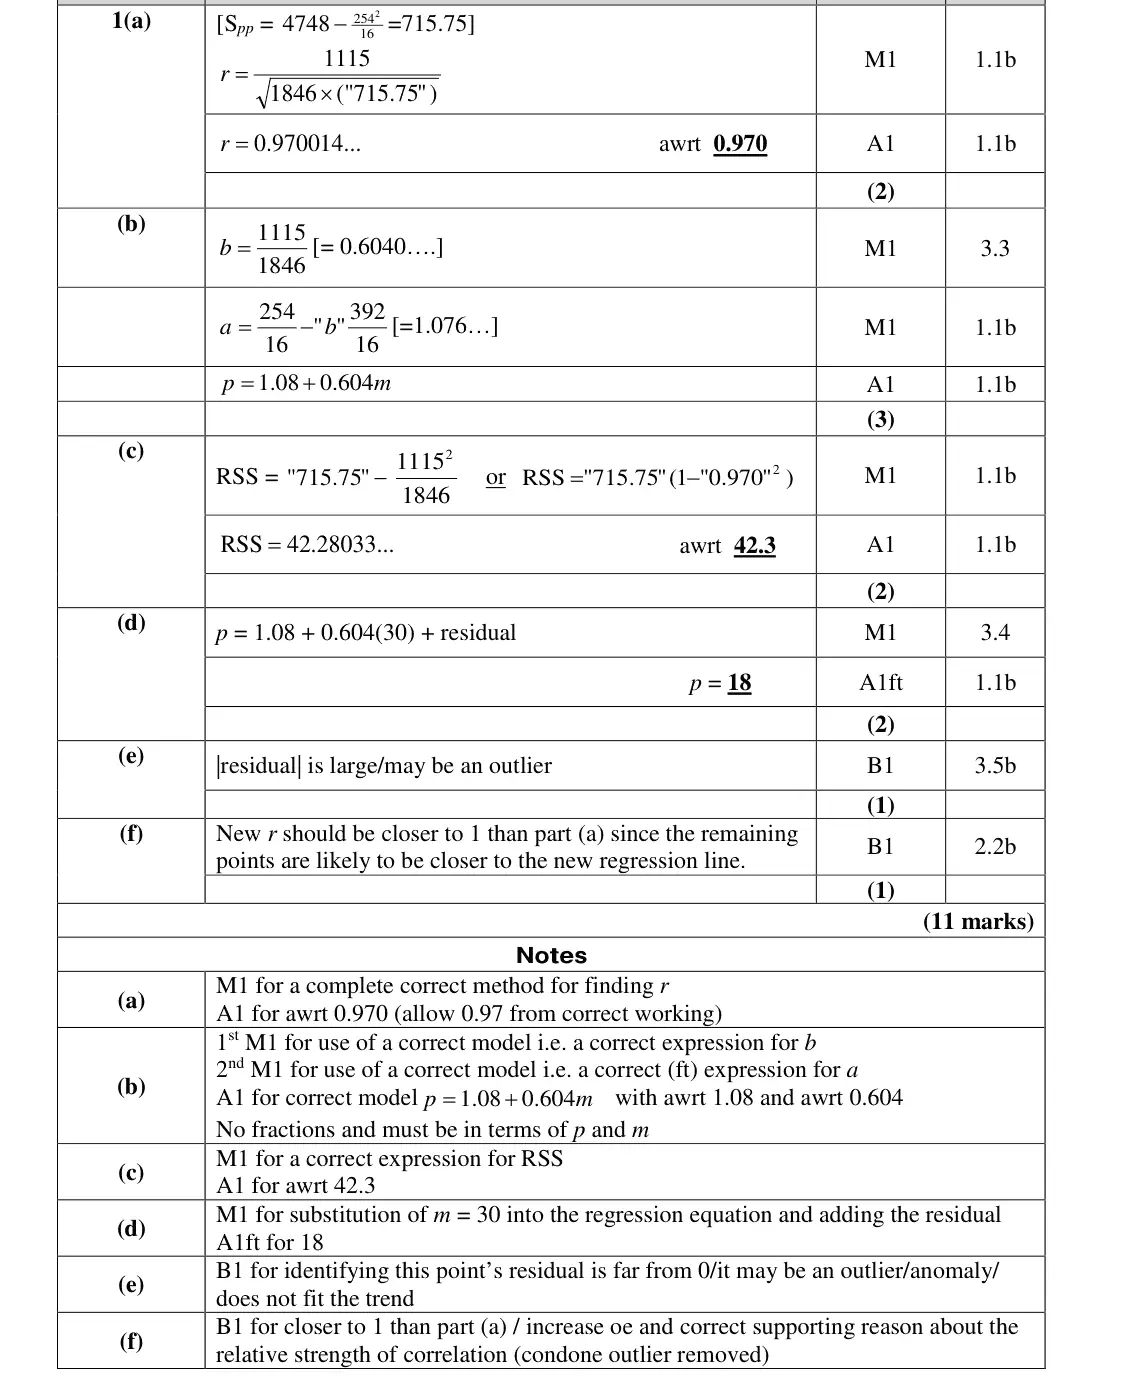
find Spp = 715.75 first
r = Smp/√(Smm Spp) = 0.970
give at least 3 s.f.
June 2018 · AS Paper 2 (Further Statistics 2) · Q1(f)1 mark
Mark scheme (whole question; this part is marked with the orange bar)
Examiner's comment
was to identify it as being an outlier. Part (f) was less successfully answered as it required both a statement about the relative size of the correlation coefficient and a correct supporting reason. Though some were able to identify that the new r would be closer to 1, many did not sufficiently justify why this was the case.
Key points from the mark scheme and examiner's report
r closer to 1 (increases) because the remaining points lie closer to a line
many gave the direction without a valid reason
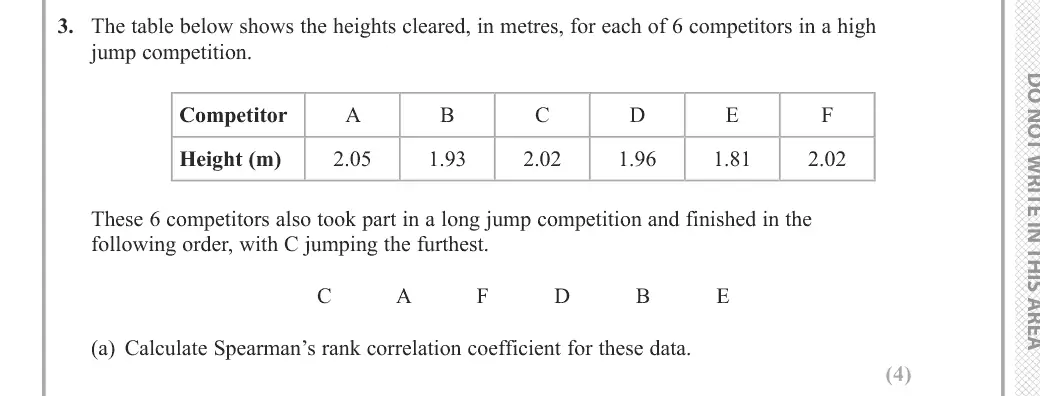
June 2018 · AS Paper 2 (Further Statistics 2) · Q3(a)4 marks
Mark scheme (whole question; this part is marked with the orange bar)
Examiner's comment
This question was designed to test understanding of how to deal with tied ranks when calculating the Spearman’s rank correlation coefficient. It was clear that this is one aspect of the new specification that was not well-prepared by students. In part (a), students found it difficult to apply tied ranks to the high jump results correctly. Of those who ranked accurately, no candidate reverted back to the formula for the product moment correlation coefficient using the tied ranks. calculated value from part (a). The conclusion of the hypothesis test needed to be in context for the final mark to be scored.
Key points from the mark scheme and examiner's report
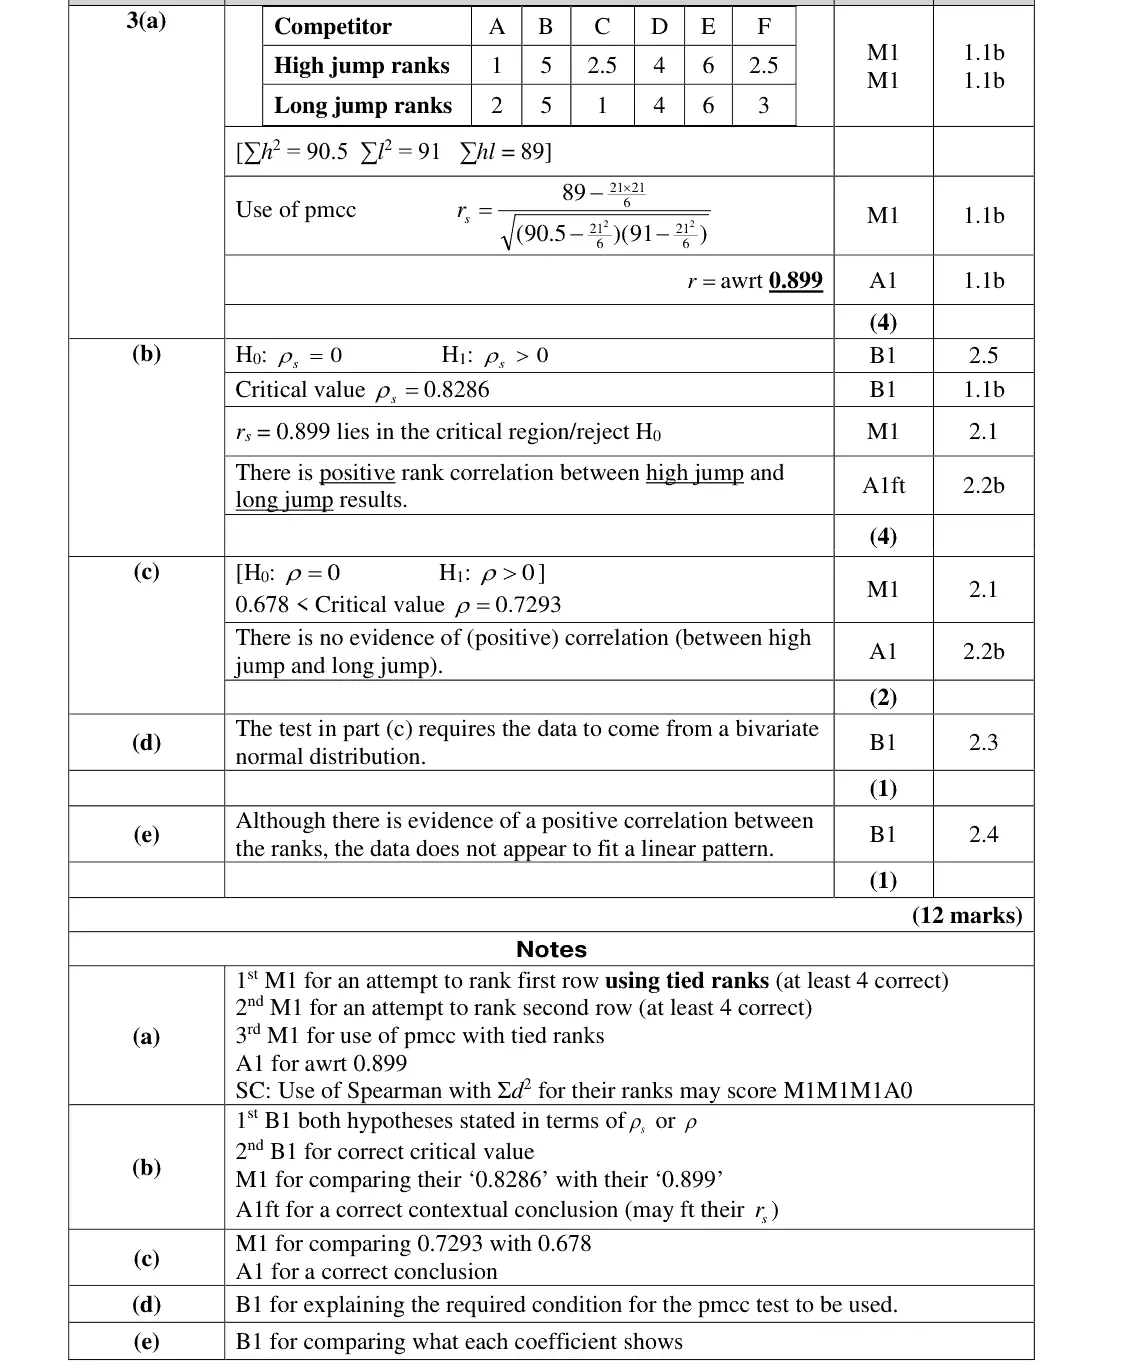
tied ranks: high jump C and F share rank 2.5
with ties use the pmcc formula on the ranks (not 1 − 6Σd²/...) to get rs = 0.899
tied ranking poorly done
June 2018 · AS Paper 2 (Further Statistics 2) · Q3(b)4 marks
Mark scheme (whole question; this part is marked with the orange bar)
Examiner's comment
This question was designed to test understanding of how to deal with tied ranks when calculating the Spearman’s rank correlation coefficient. It was clear that this is one aspect of Part (b) was a standard hypothesis test for positive correlation in the ranks. Some students lost the mark by writing out their hypotheses in words, others by using r. Most went on to find the correct critical value from the tables and made a correct comparison with their calculated value from part (a). The conclusion of the hypothesis test needed to be in context
Key points from the mark scheme and examiner's report
H0: ρs = 0, H1: ρs > 0 (not in words, not r)
cv 0.8286
reject H0: positive rank correlation between high jump and long jump results, in context
June 2018 · AS Paper 2 (Further Statistics 2) · Q3(c)2 marks
Mark scheme (whole question; this part is marked with the orange bar)
Examiner's comment
This question was designed to test understanding of how to deal with tied ranks when calculating the Spearman’s rank correlation coefficient. It was clear that this is one aspect of Part (c) was generally well attempted with a correct critical value and a correct conclusion often seen. The condition required for this test to be valid was not well known and there were not many correct responses seen in part (d). Likewise in part (e), students struggled to show they understood that the answers to parts (c) and (d) indicate that the results in high jump and long jump do not fit a positive linear pattern.
Key points from the mark scheme and examiner's report
pmcc cv 0.7293 for n = 6 one-tailed
0.678 < 0.7293 so no evidence of positive correlation
June 2018 · AS Paper 2 (Further Statistics 2) · Q3(d)1 mark
Mark scheme (whole question; this part is marked with the orange bar)
Examiner's comment
This question was designed to test understanding of how to deal with tied ranks when calculating the Spearman’s rank correlation coefficient. It was clear that this is one aspect of not many correct responses seen in part (d). Likewise in part (e), students struggled to show they understood that the answers to parts (c) and (d) indicate that the results in high jump and long jump do not fit a positive linear pattern.
Key points from the mark scheme and examiner's report
data must come from a bivariate normal distribution
not well known
June 2018 · AS Paper 2 (Further Statistics 2) · Q3(e)1 mark
Mark scheme (whole question; this part is marked with the orange bar)
Examiner's comment
This question was designed to test understanding of how to deal with tied ranks when calculating the Spearman’s rank correlation coefficient. It was clear that this is one aspect of not many correct responses seen in part (d). Likewise in part (e), students struggled to show they understood that the answers to parts (c) and (d) indicate that the results in high jump and
Key points from the mark scheme and examiner's report
ranks agree but the relationship is not linear
few understood this
Find an Edexcel Further Maths tutor
Stuck on this? Book a trial lesson with our Further Maths tutor.