June 2019: AS Paper 24: Further Statistics 2

40 marks · 15 question parts · Question paper, mark scheme and examiner's report on Pearson's site

Question by question

QTopicMarksDifficulty
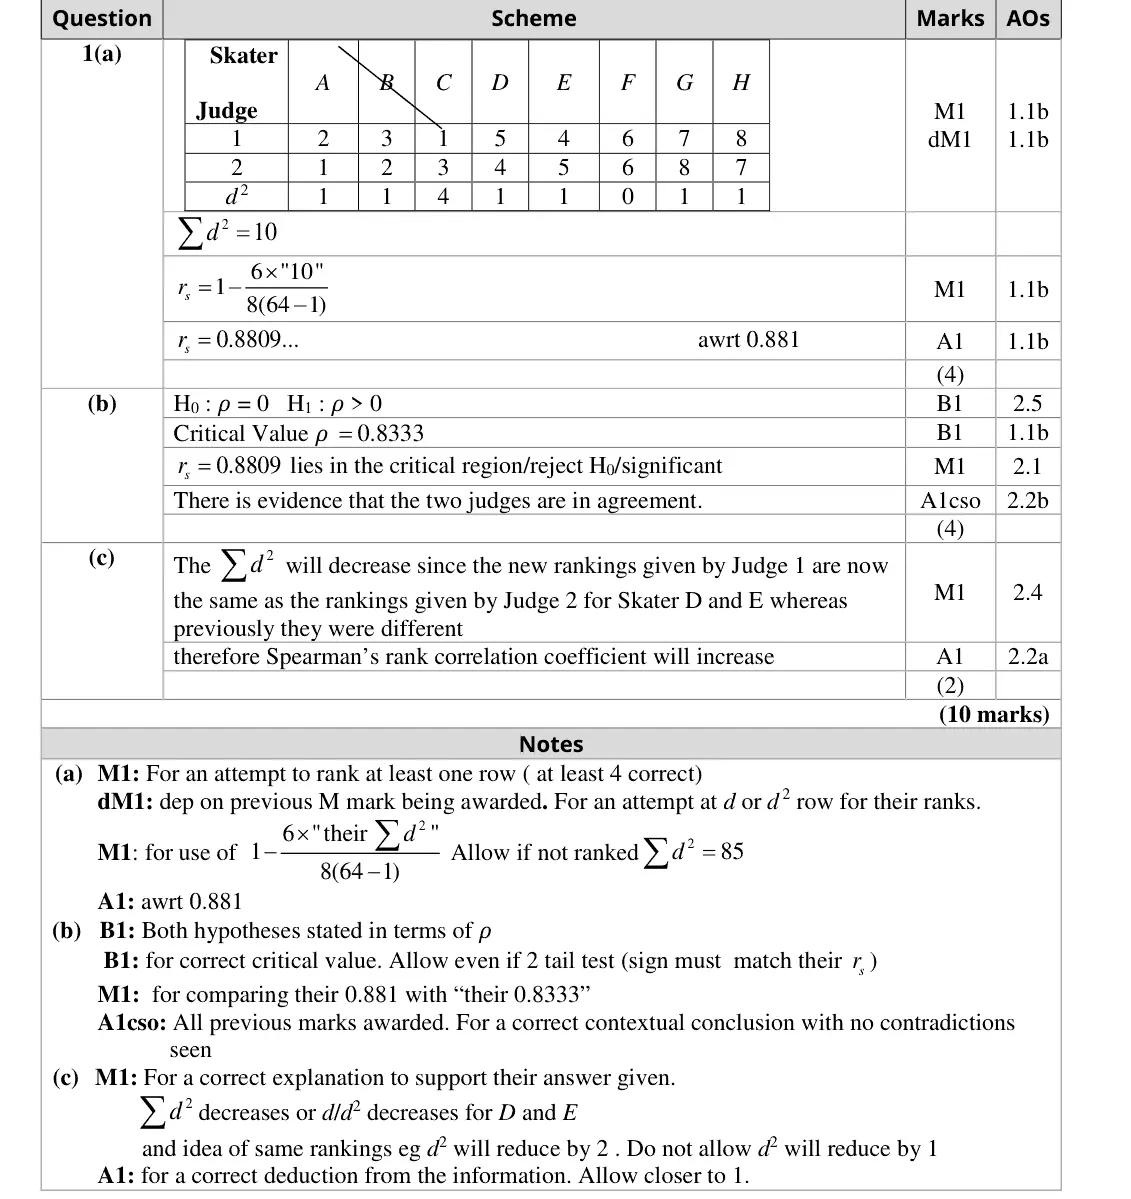
1(a) Correlation: PMCC, Spearman's rank and tests 4 —
1(b) Correlation: PMCC, Spearman's rank and tests 4 —
1(c) Correlation: PMCC, Spearman's rank and tests 2 —
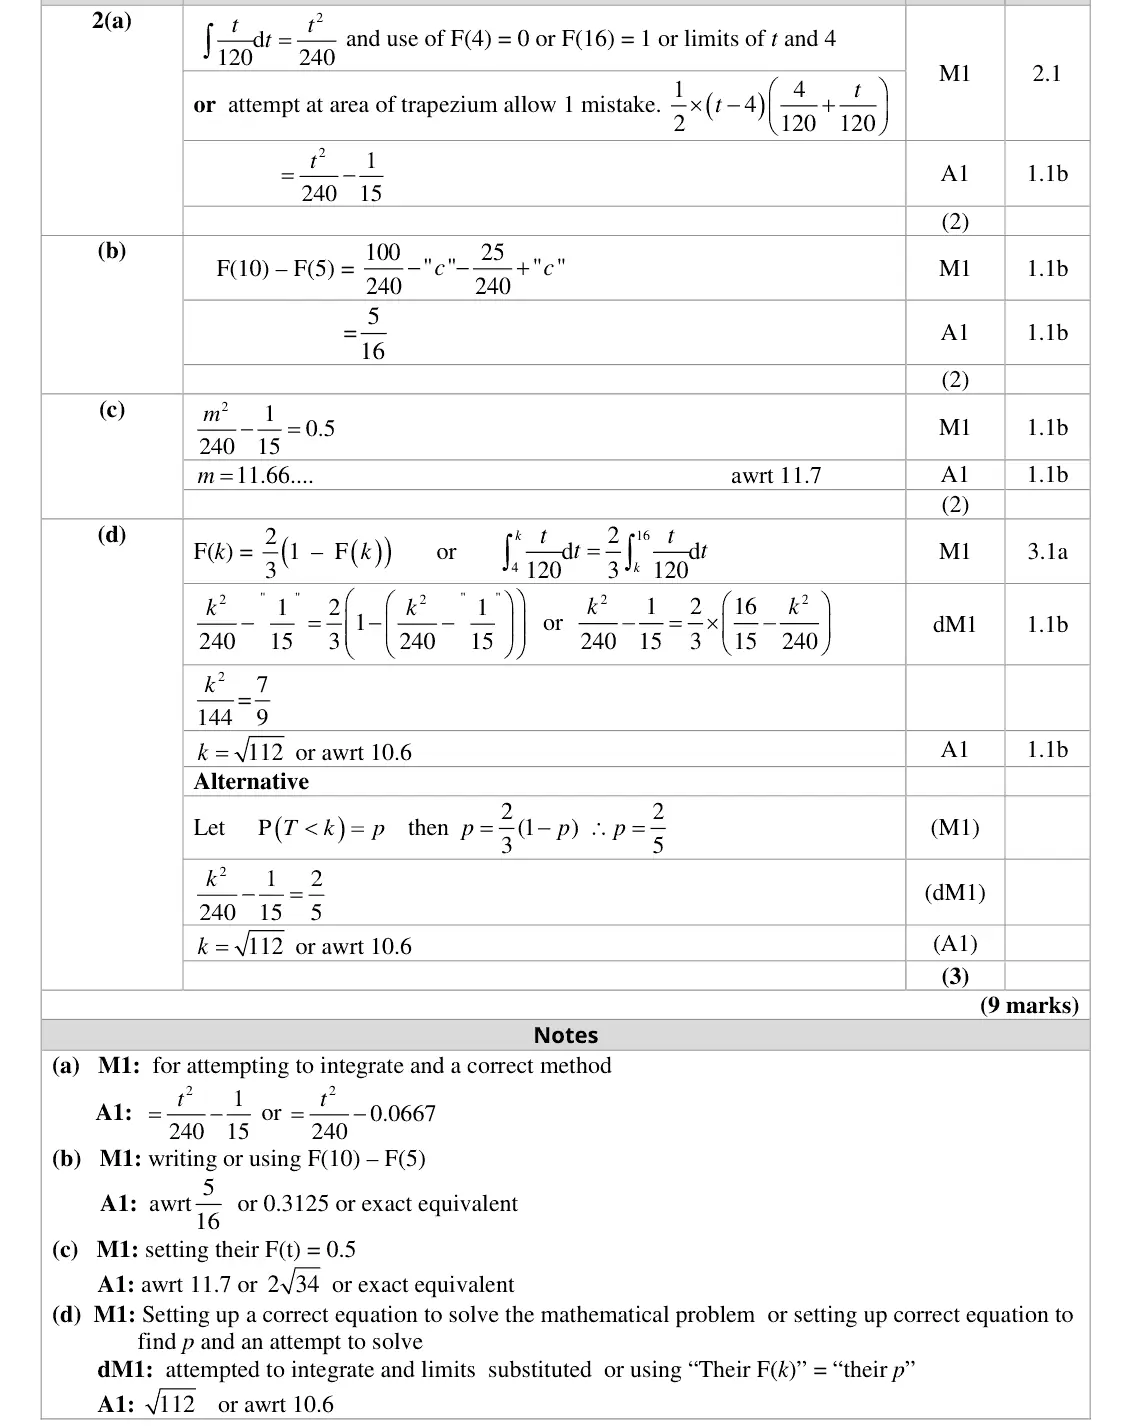
2(a) Continuous random variables and the uniform distribution 2 —
2(b) Continuous random variables and the uniform distribution 2 —
2(c) Continuous random variables and the uniform distribution 2 —
2(d) Continuous random variables and the uniform distribution 3 —
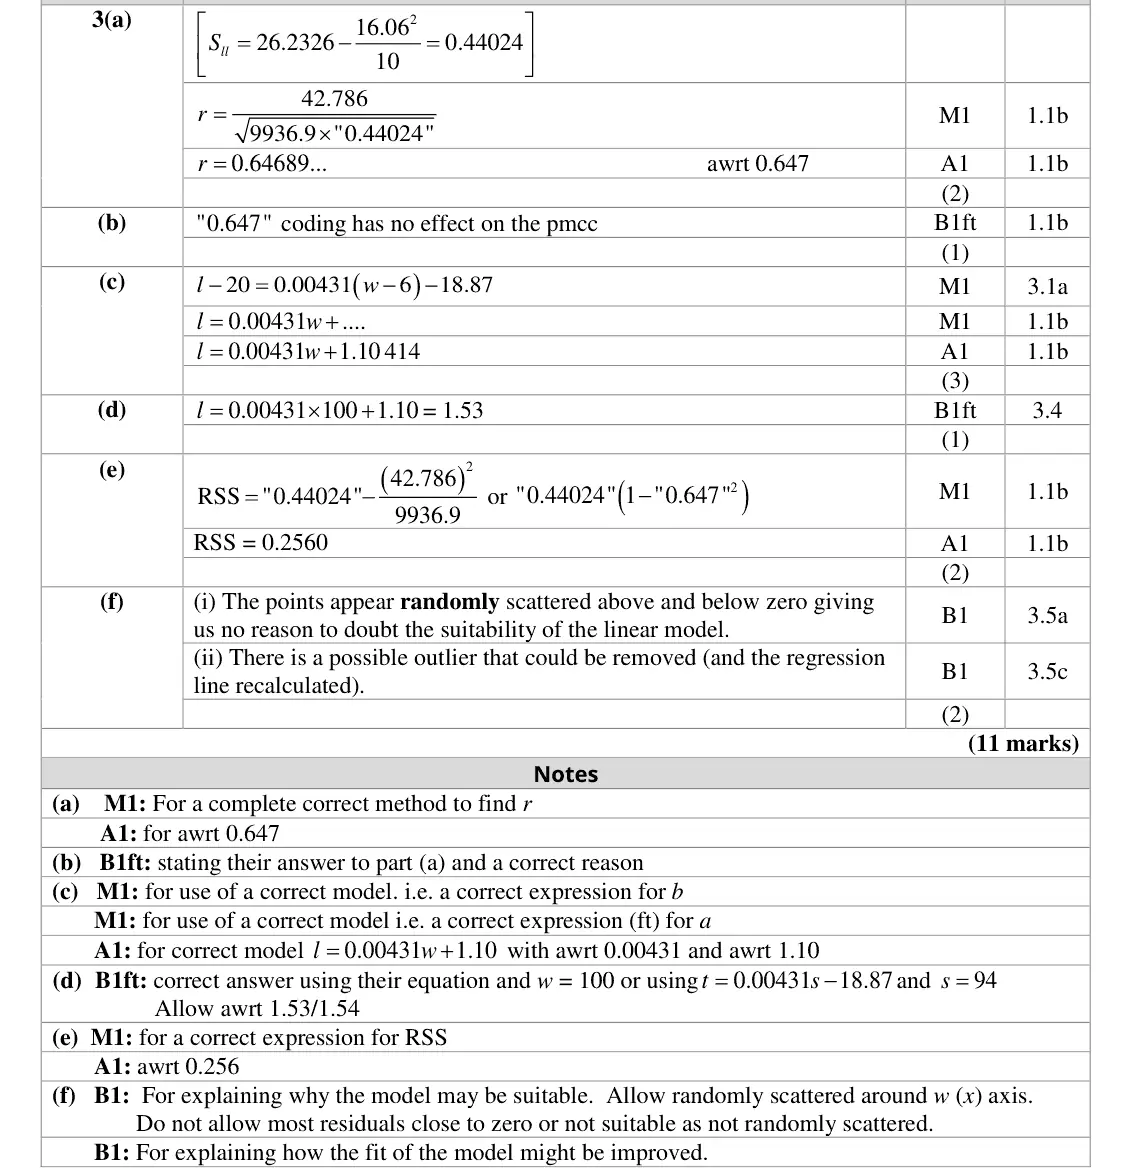
3(a) Correlation: PMCC, Spearman's rank and tests 2 —
3(b) Correlation: PMCC, Spearman's rank and tests 1 —
3(c) Linear regression and residuals 3 —
3(d) Linear regression and residuals 1 —
3(e) Linear regression and residuals 2 —
3(f) Linear regression and residuals 2 —
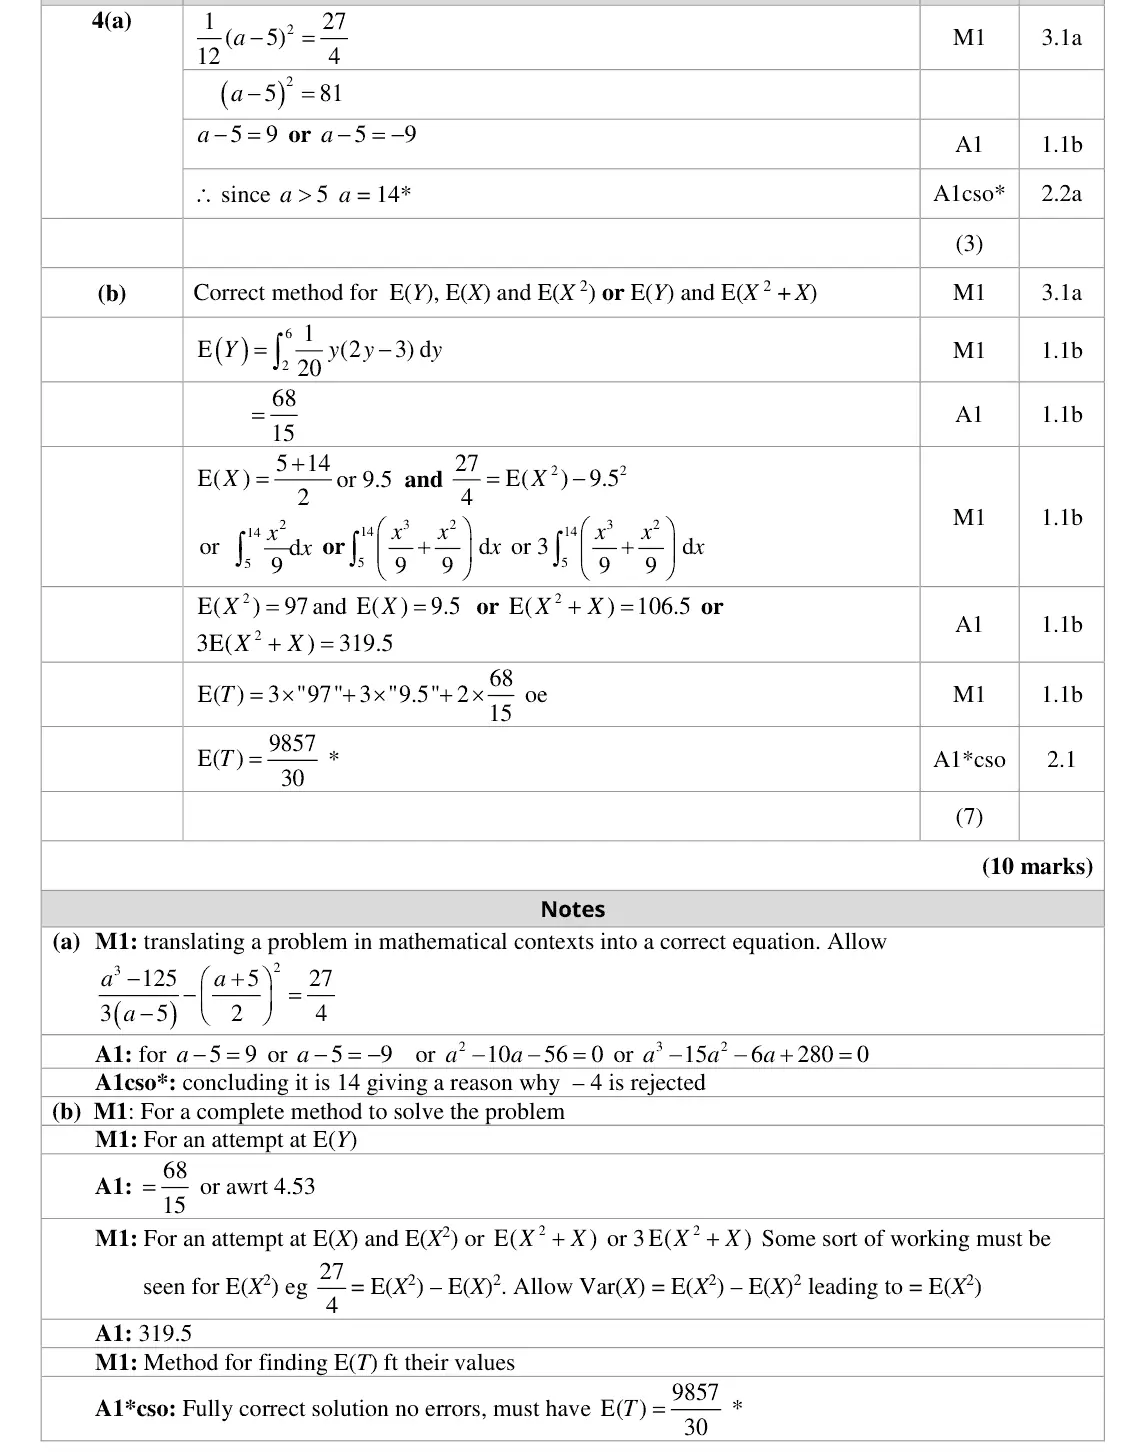
4(a) Continuous random variables and the uniform distribution 3 —
4(b) Continuous random variables and the uniform distribution 7 —

The questions

1(a)1(b)1(c)2(a)2(b)2(c)2(d)3(a)3(b)3(c)3(d)3(e)3(f)4(a)4(b)
June 2019 · AS Paper 2 (Further Statistics 2) · Q1(a) 4 marks correlation fs2
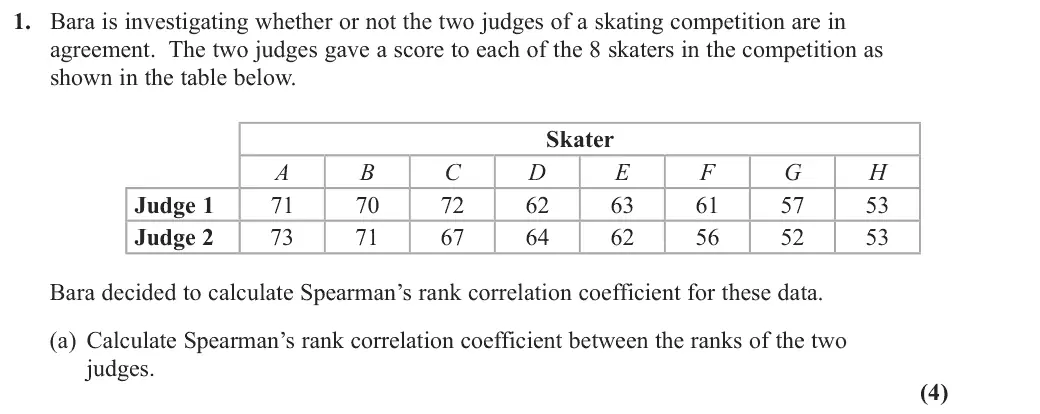
1. Bara is investigating whether or not the two judges of a skating competition are in agreement. The two judges gave a score to each of the 8 skaters in the competition as shown in the table below. Skater A B C E F G H Judge 1 Judge 2 Bara decided to calculate Spearman’s rank correlation coefficient for these data. (a) Calculate Spearman’s rank correlation coefficient between the ranks of the two judges. (4)
June 2019 · AS Paper 2 (Further Statistics 2) · Q1(b) 4 marks correlation fs2
(b) Test, at the 1% level of significance, whether or not the two judges are in agreement. (4)
June 2019 · AS Paper 2 (Further Statistics 2) · Q1(c) 2 marks correlation fs2
Judge 1 accidentally swapped the scores for skaters D and E. The score for skater D should be 63 and the score for skater E should be 62 (c) Without carrying out any further calculations, explain how Spearman’s rank correlation coefficient will change. Give a reason for your answer. (2)
June 2019 · AS Paper 2 (Further Statistics 2) · Q2(a) 2 marks continuous random variables
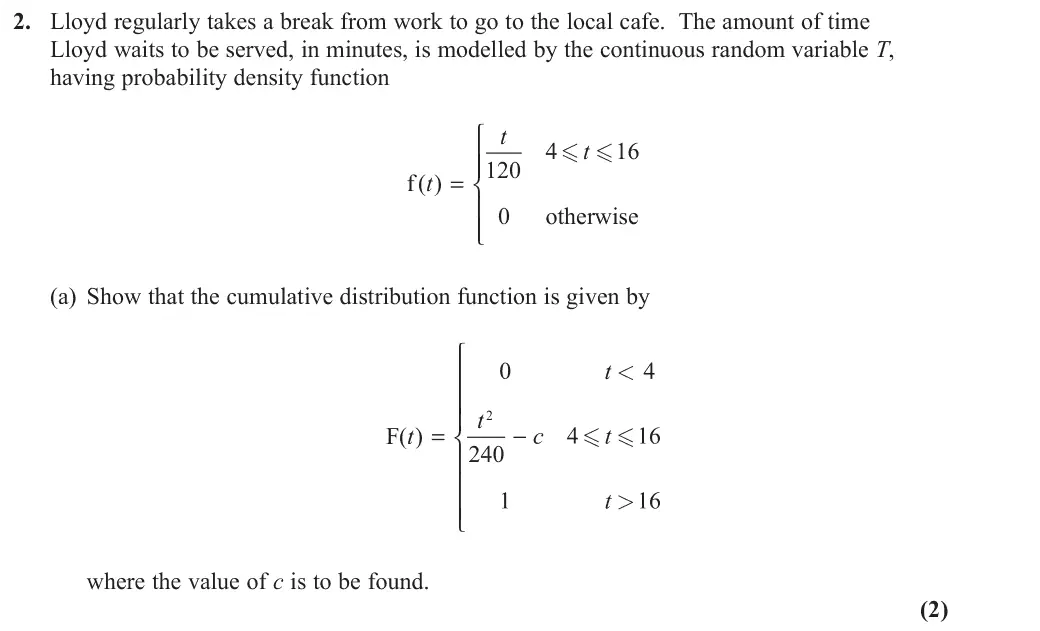
2. Lloyd regularly takes a break from work to go to the local cafe. The amount of time Lloyd waits to be served, in minutes, is modelled by the continuous random variable T, having probability density function t ⎧ - - t ⎪⎪ f ( )t = ⎨ ⎪ otherwise ⎪ ⎩ (a) Show that the cumulative distribution function is given by ⎧ t < ⎪ ⎪⎪ t F( )t ⎨ ⎪ ⎪ ⎪ ⎩ where the value of c is to be found. (2)
June 2019 · AS Paper 2 (Further Statistics 2) · Q2(b) 2 marks continuous random variables
(b) Find the exact probability that the amount of time Lloyd waits to be served is between 5 and 10 minutes. (2)
June 2019 · AS Paper 2 (Further Statistics 2) · Q2(c) 2 marks continuous random variables
(c) Find the median of T. (2)
June 2019 · AS Paper 2 (Further Statistics 2) · Q2(d) 3 marks continuous random variables
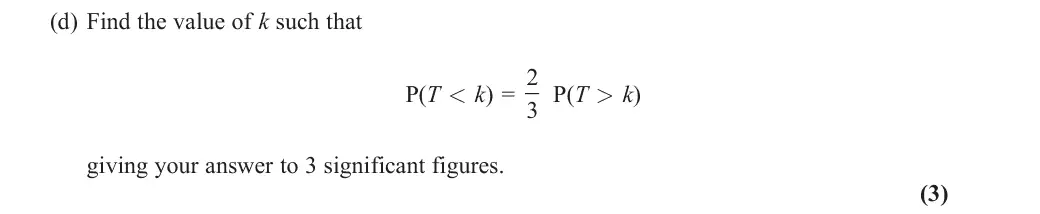
(d) Find the value of k such that P(T : k) = 2 3 P(T < k) giving your answer to 3 significant figures. (3)
June 2019 · AS Paper 2 (Further Statistics 2) · Q3(a) 2 marks correlation fs2
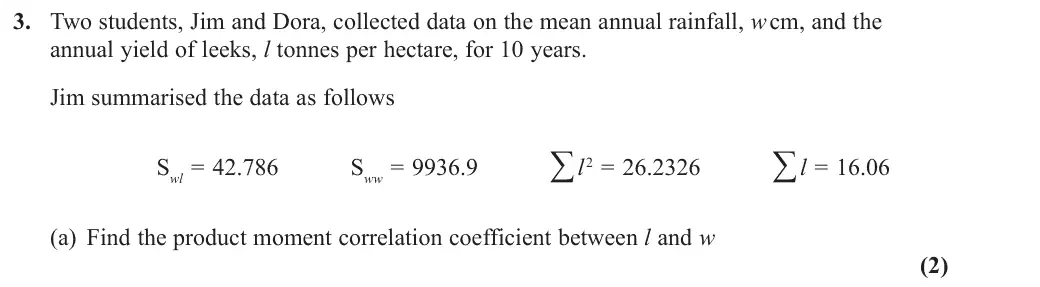
3. Two students, Jim and Dora, collected data on the mean annual rainfall, w cm, and the annual yield of leeks, l tonnes per hectare, for 10 years. Jim summarised the data as follows Swl = 42.786 Sww = 9936.9 ™ l௘2 = 26.2326 ™ l = 16.06 (a) Find the product moment correlation coefficient between l and w (2)
June 2019 · AS Paper 2 (Further Statistics 2) · Q3(b) 1 mark correlation fs2
Dora decided to code the data first using s = w í 6 and t = l í 20 (b) Write down the value of the product moment correlation coefficient between s and t. Give a justification for your answer. (1)
June 2019 · AS Paper 2 (Further Statistics 2) · Q3(c) 3 marks linear regression
Dora calculates the equation of the regression line of t on s to be t = 0.00431s í 18.87 (c) Find the equation of the regression line of l on w in the form l = a + bw , giving the values of a and b to 3 significant figures. (3)
June 2019 · AS Paper 2 (Further Statistics 2) · Q3(d) 1 mark linear regression
(d) Use your equation to estimate the yield of leeks when w is 100 cm. (1)
June 2019 · AS Paper 2 (Further Statistics 2) · Q3(e) 2 marks linear regression
(e) Calculate the residual sum of squares. (2)
June 2019 · AS Paper 2 (Further Statistics 2) · Q3(f) 2 marks linear regression
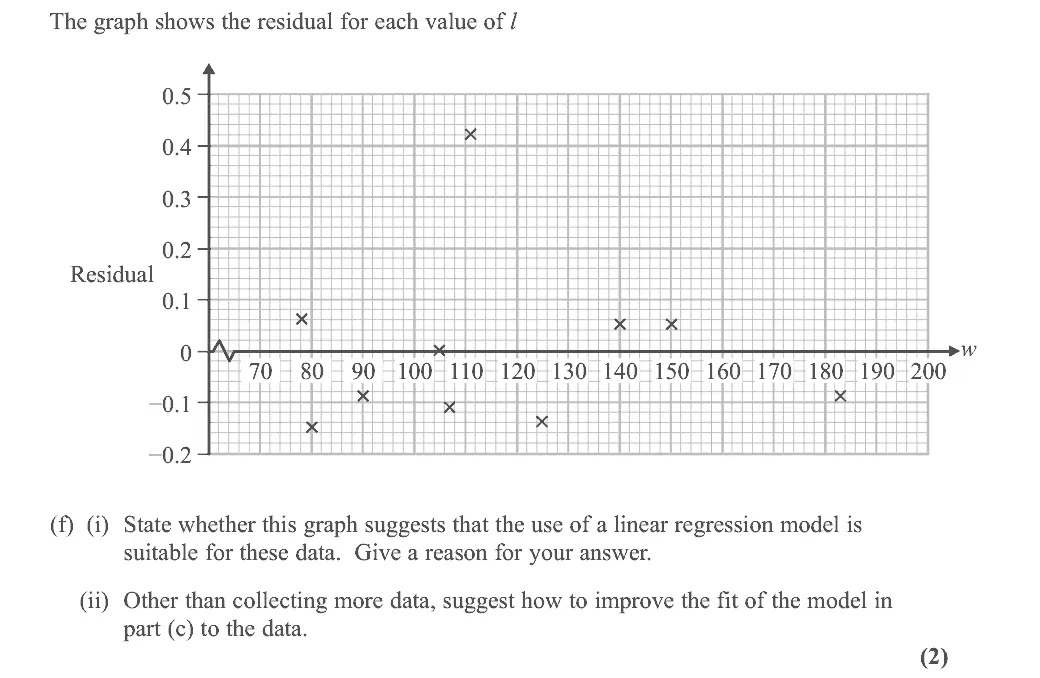
The graph shows the residual for each value of l 0.5 0.4 0.3 0.2 Residual 0.1 w í0.1 í0.2 (f) (i) State whether this graph suggests that the use of a linear regression model is suitable for these data. Give a reason for your answer. (ii) Other than collecting more data, suggest how to improve the fit of the model in part (c) to the data. (2)
June 2019 · AS Paper 2 (Further Statistics 2) · Q4(a) 3 marks continuous random variables
4. The random variable X has a continuous uniform distribution over the interval [5, a], where a is a constant. Given that Var(X ) = 27 (a) show that a = 14 (3)
June 2019 · AS Paper 2 (Further Statistics 2) · Q4(b) 7 marks continuous random variables
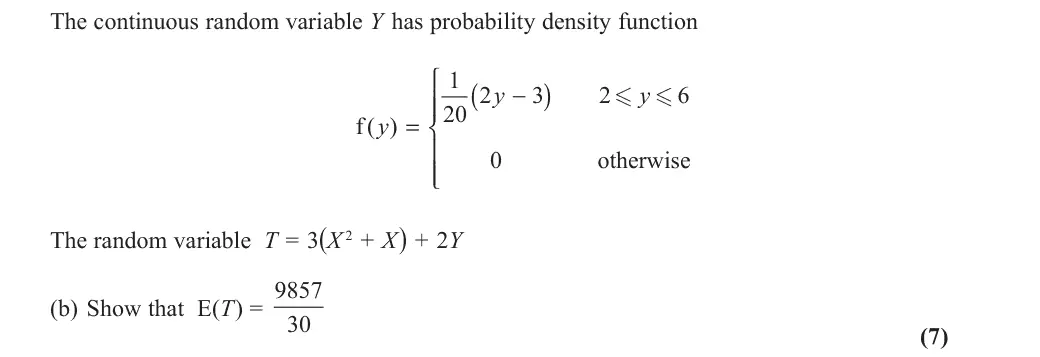
The continuous random variable Y ௘has probability density function ⎧ ( ) - - 20 2 y y - ⎪⎪ f ( ) y = ⎨ ⎪ otherwise ⎪ ⎩ The random variable T = 3(X 2 + X௘) + 2Y (b) Show that E(T௘) = 9857 (7)

Find an Edexcel Further Maths tutor

Want this paper marked and gone through with a Further Maths tutor? Message us.

Prefer email? Send an enquiry

If you are under 18, please include a parent's contact details. Enquiries go to enquiries@alevelfurthermathstutor.com and are deleted once handled.