June 2024: AS Paper 24: Further Statistics 2

40 marks · 15 question parts · Question paper, mark scheme and examiner's report on Pearson's site

Question by question

QTopicMarksDifficulty
1(a) Continuous random variables and the uniform distribution 2 —
1(b)(i) Continuous random variables and the uniform distribution 2 —
1(b)(ii) Continuous random variables and the uniform distribution 1 —
1(c) Continuous random variables and the uniform distribution 3 —
2 Correlation: PMCC, Spearman's rank and tests 7 —
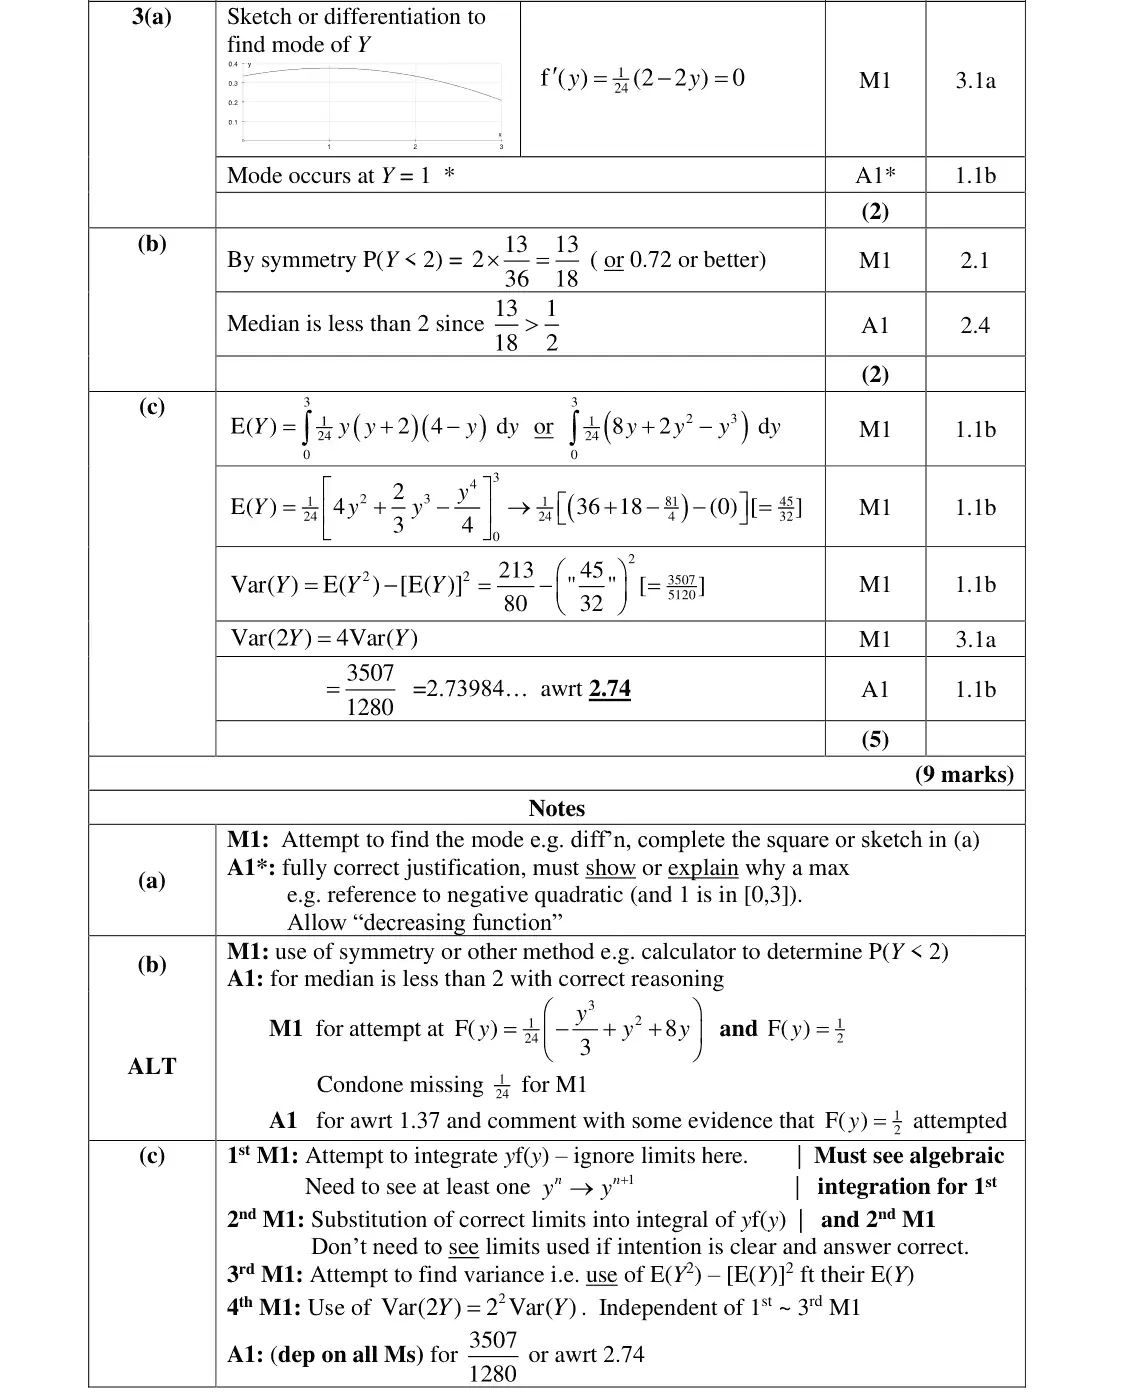
3(a) Continuous random variables and the uniform distribution 2 —
3(b) Continuous random variables and the uniform distribution 2 —
3(c) Continuous random variables and the uniform distribution 5 —
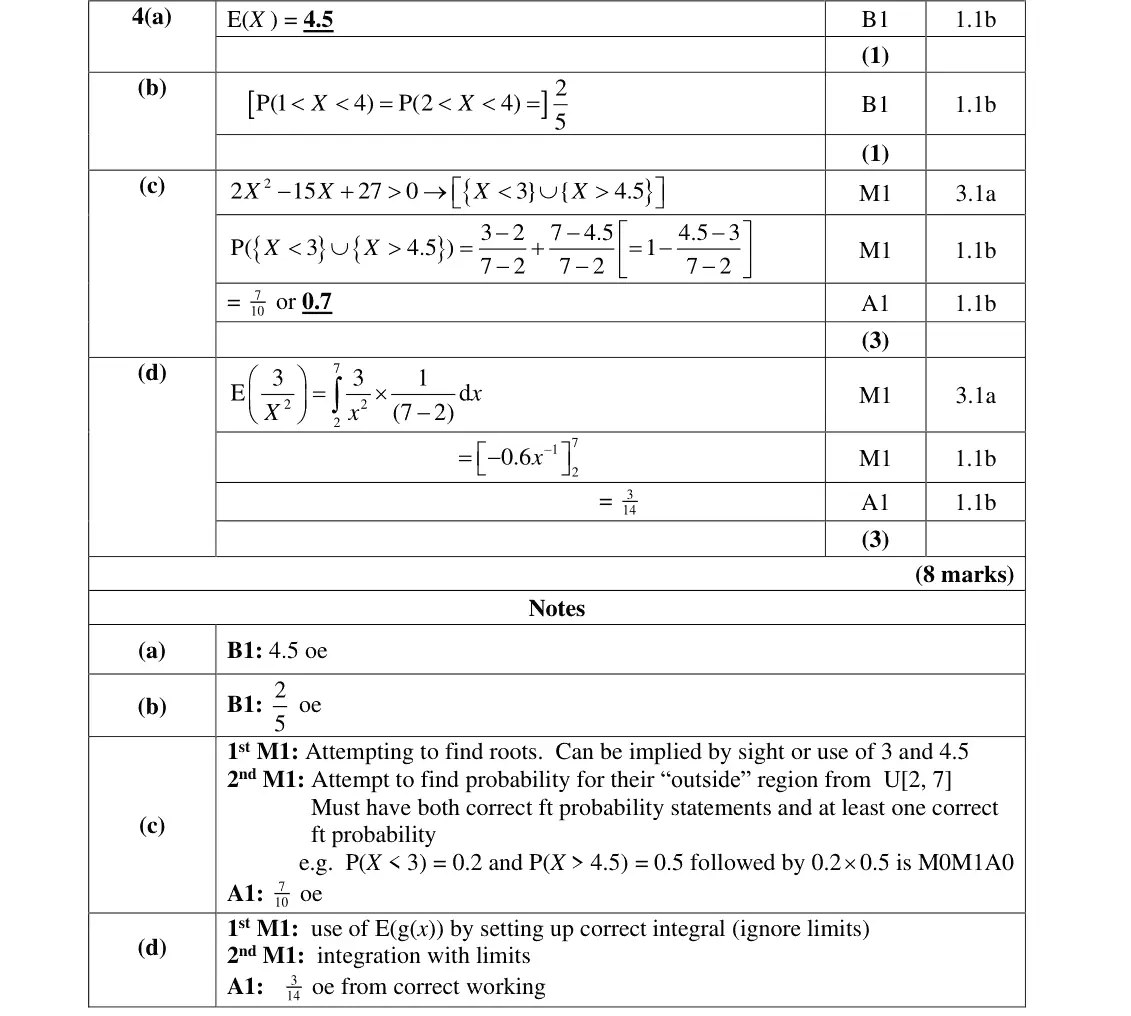
4(a) Continuous random variables and the uniform distribution 1 —
4(b) Continuous random variables and the uniform distribution 1 —
4(c) Continuous random variables and the uniform distribution 3 —
4(d) Continuous random variables and the uniform distribution 3 —
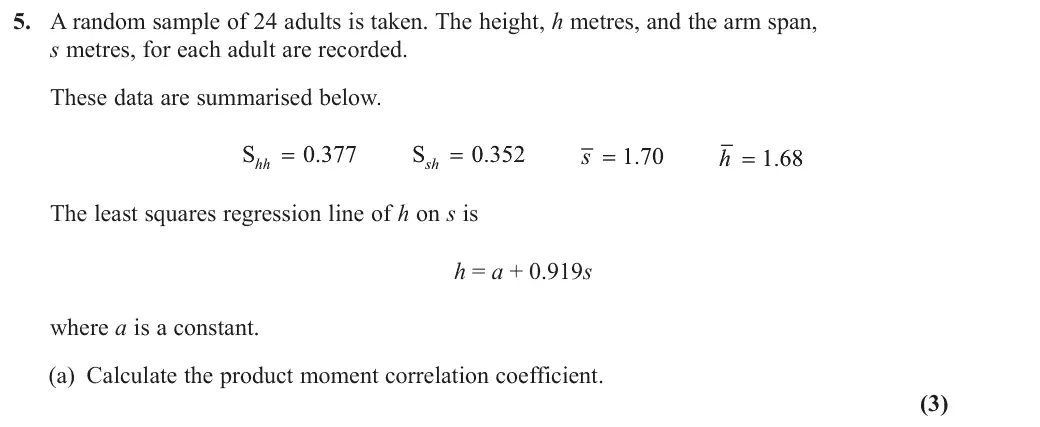
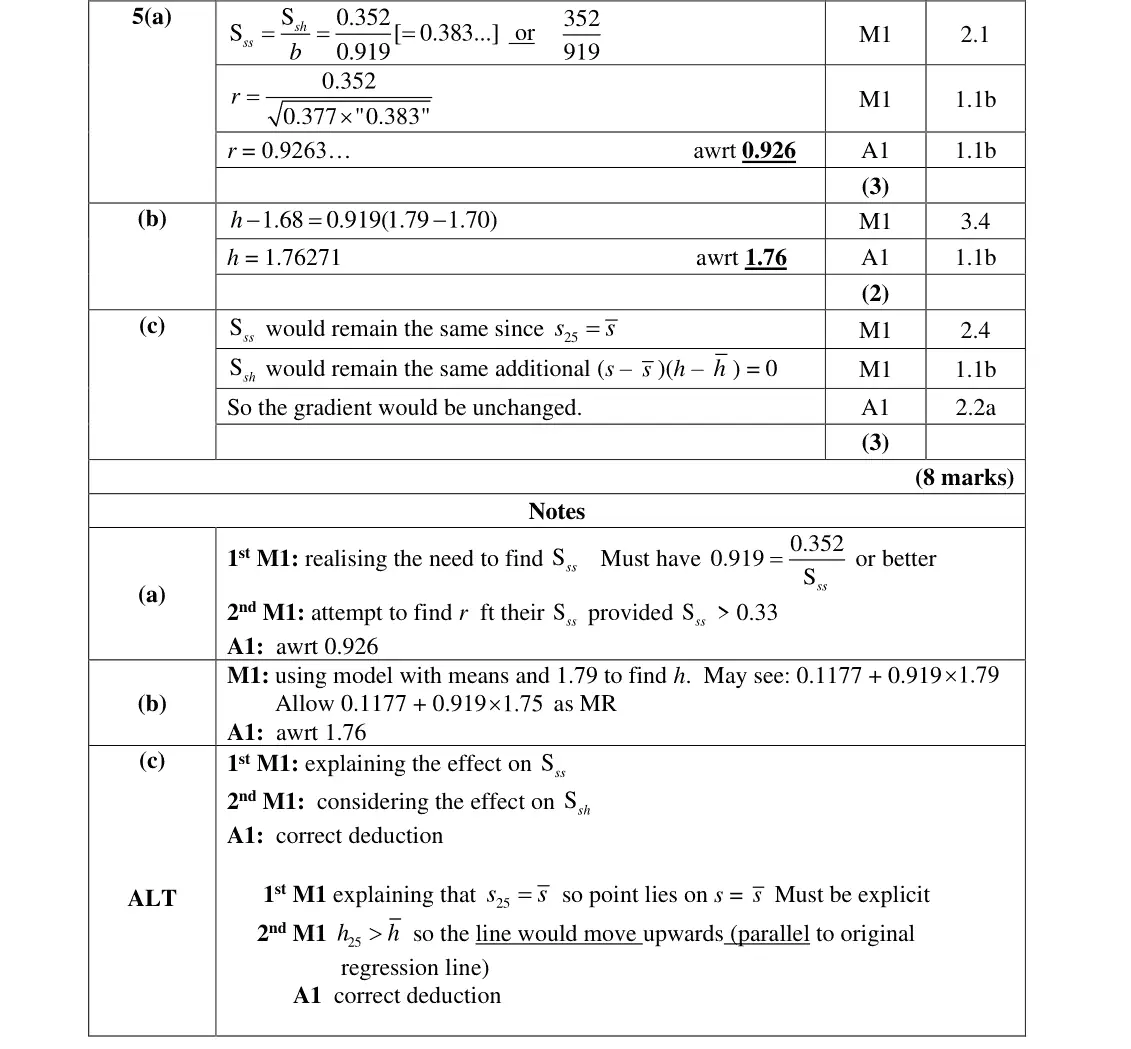
5(a) Correlation: PMCC, Spearman's rank and tests, Linear regression and residuals 3 —
5(b) Linear regression and residuals 2 —
5(c) Linear regression and residuals 3 —

The questions

1(a)1(b)(i)1(b)(ii)1(c)23(a)3(b)3(c)4(a)4(b)4(c)4(d)5(a)5(b)5(c)
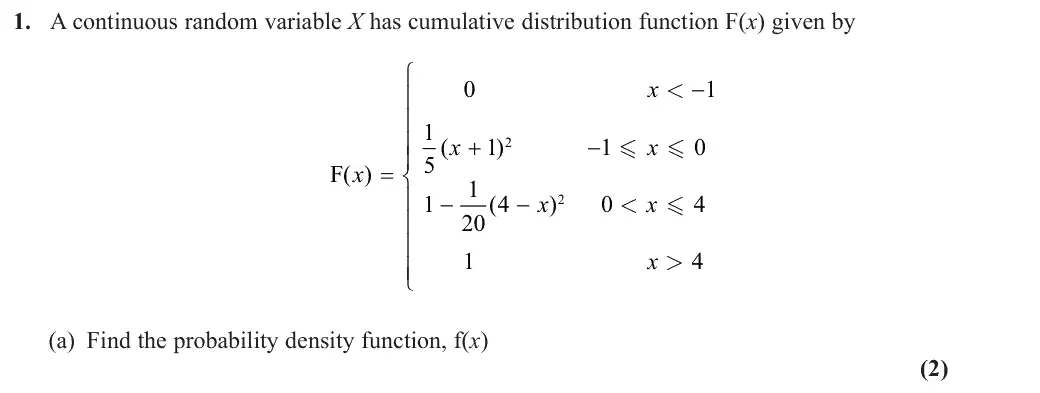
June 2024 · AS Paper 2 (Further Statistics 2) · Q1(a) 2 marks continuous random variables
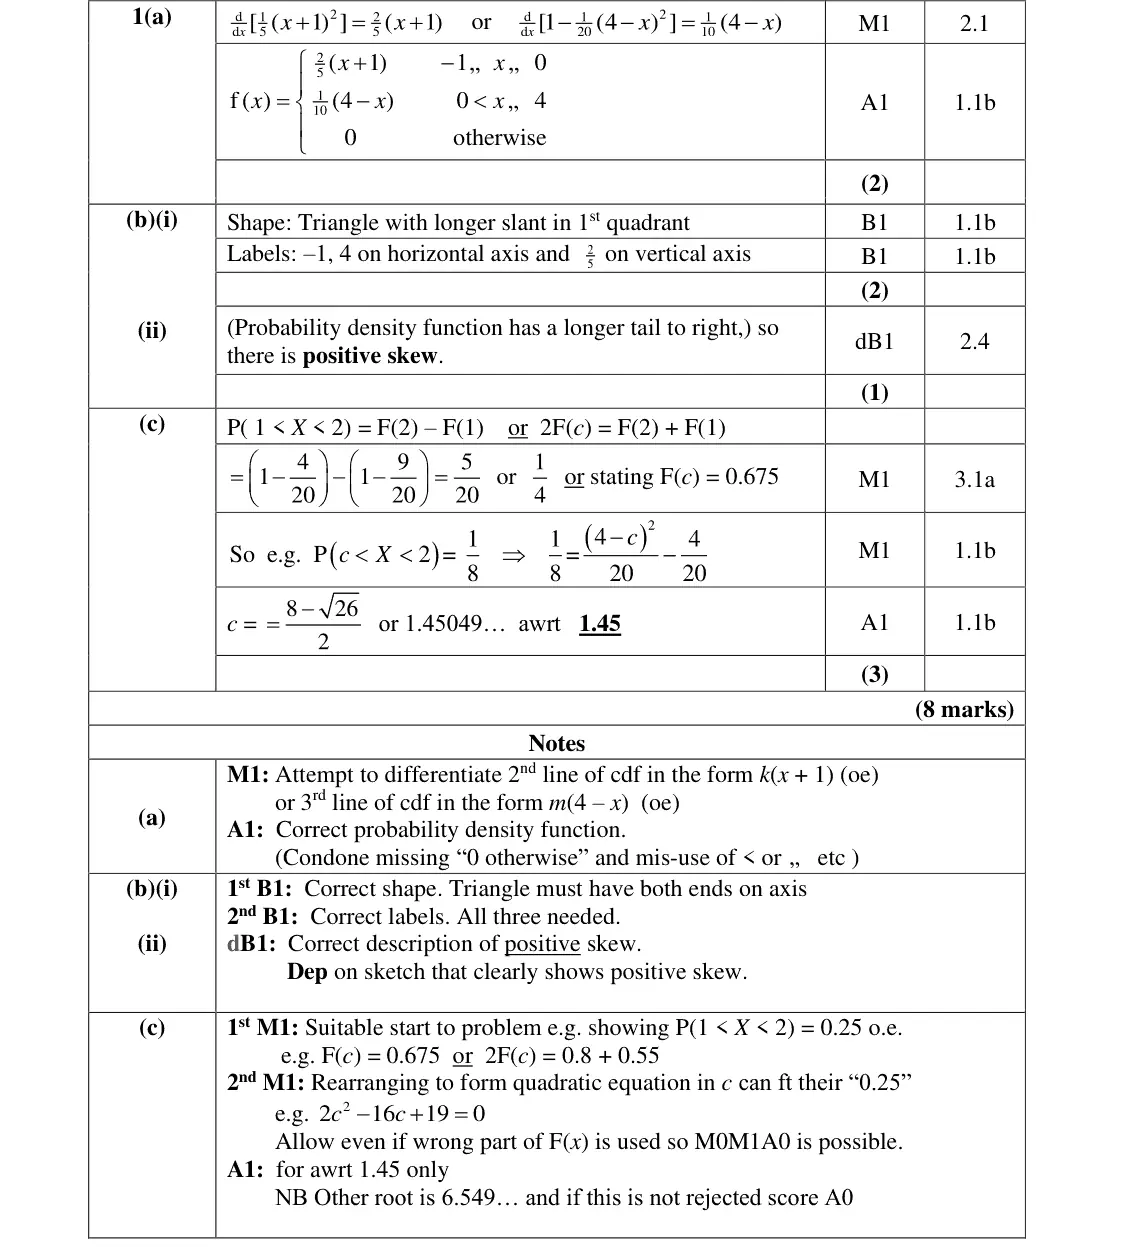
1. A continuous random variable X has cumulative distribution function F(x) given by x < x x ( ) x F( ) x x < 20 4 ( ) x > (a) Find the probability density function, f(x) (2)
June 2024 · AS Paper 2 (Further Statistics 2) · Q1(b)(i) 2 marks continuous random variables
(b) (i) Sketch f(x) (2)
June 2024 · AS Paper 2 (Further Statistics 2) · Q1(b)(ii) 1 mark continuous random variables
(ii) Hence describe the skewness of the distribution. (1)
June 2024 · AS Paper 2 (Further Statistics 2) · Q1(c) 3 marks continuous random variables
(c) Find, to 3 significant figures, the value of c such that P(1 < X < c) = P(c < X < 2) (3)
June 2024 · AS Paper 2 (Further Statistics 2) · Q2 7 marks correlation fs2
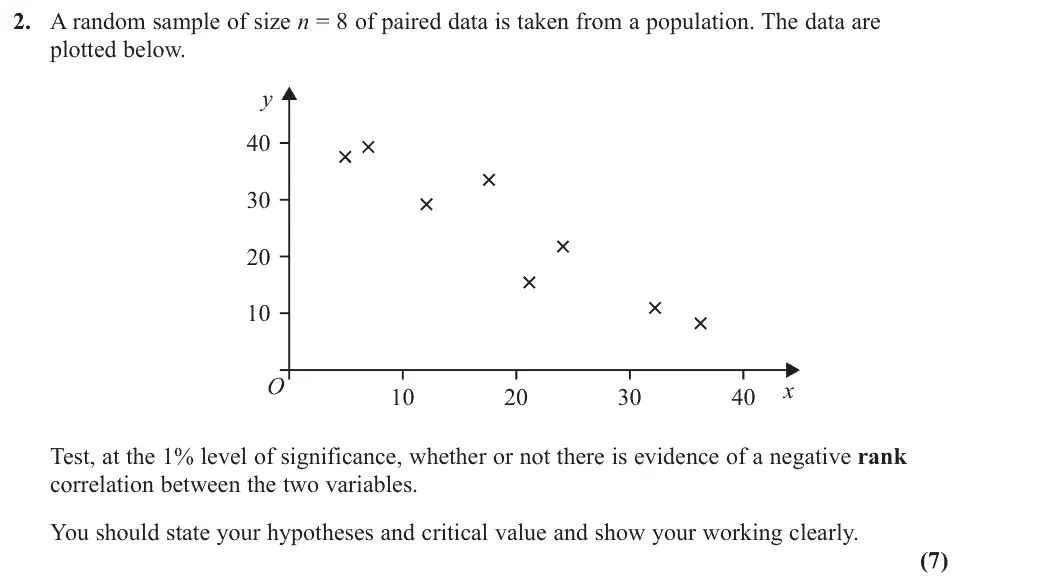
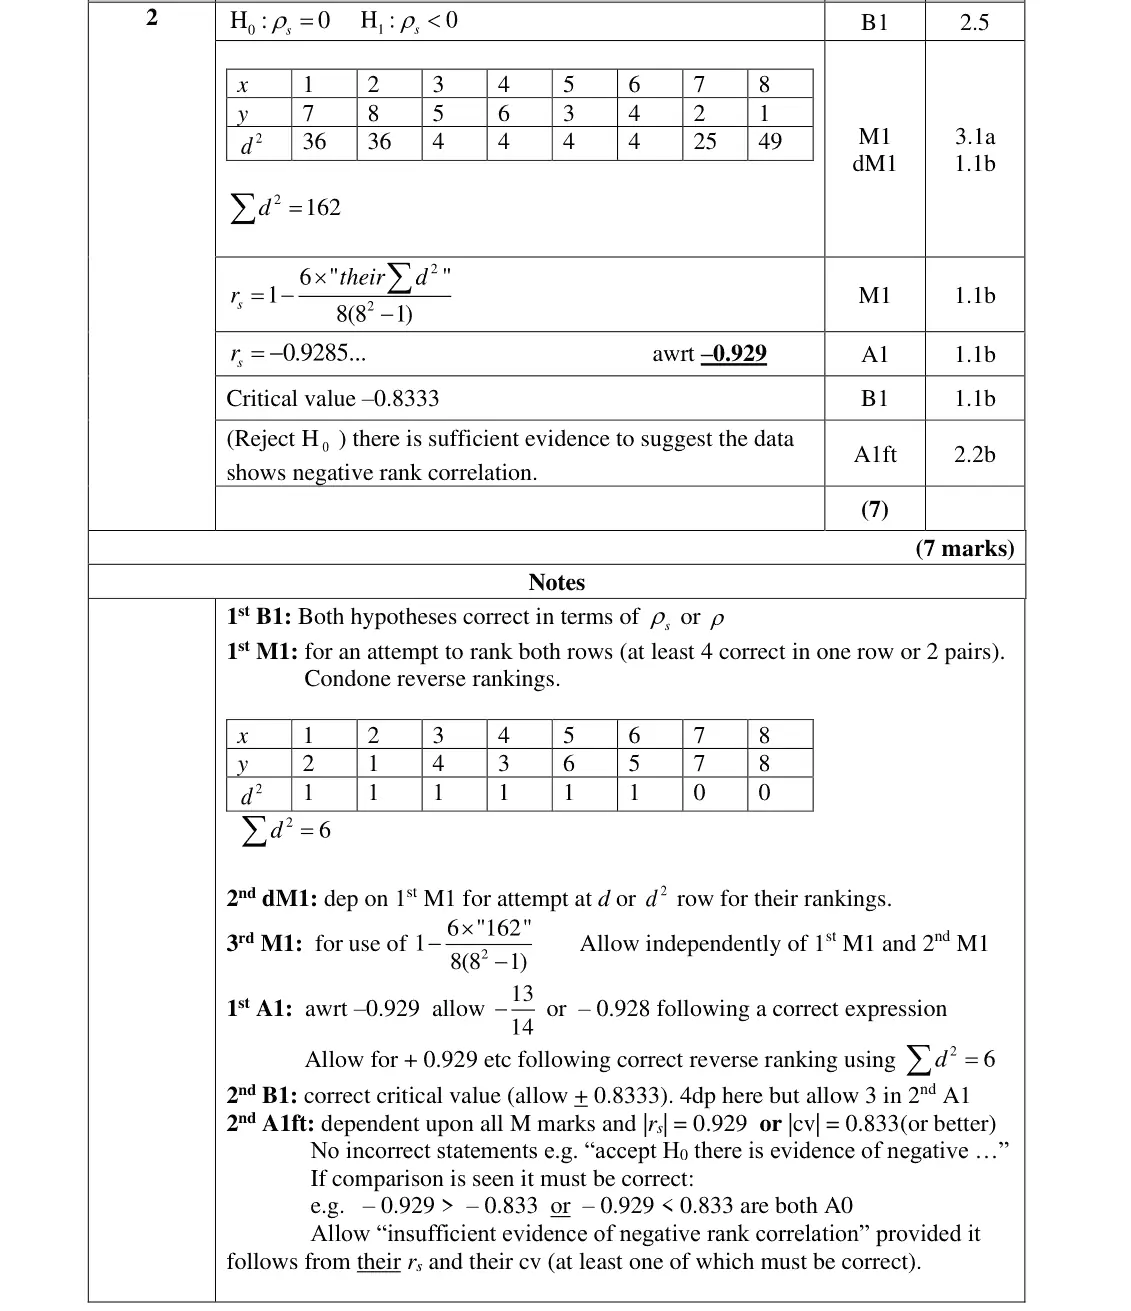
2. A random sample of size n = 8 of paired data is taken from a population. The data are plotted below. y x Test, at the 1% level of significance, whether or not there is evidence of a negative rank correlation between the two variables. You should state your hypotheses and critical value and show your working clearly. (7)
June 2024 · AS Paper 2 (Further Statistics 2) · Q3(a) 2 marks continuous random variables
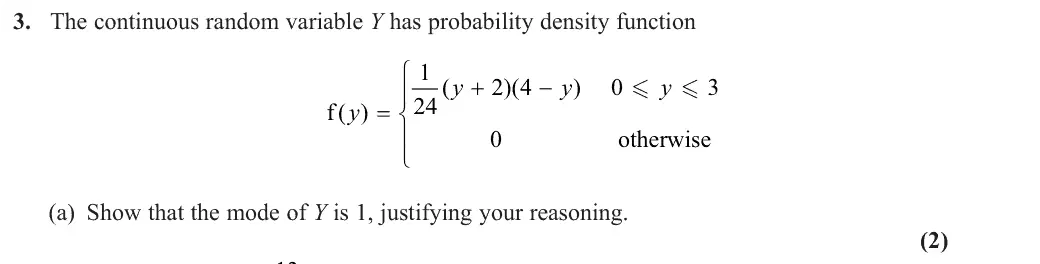
3. The continuous random variable Y has probability density function y y y ( 2 4 )( ) y f ( ) otherwise (a) Show that the mode of Y is 1, justifying your reasoning. (2)
June 2024 · AS Paper 2 (Further Statistics 2) · Q3(b) 2 marks continuous random variables
Given that P(Y < 1) = 13 (b) determine whether the median of Y is less than, equal to, or greater than 2 Give a reason for your answer. (2)
June 2024 · AS Paper 2 (Further Statistics 2) · Q3(c) 5 marks continuous random variables
Given that E(Y 2) = 213 (c) find, using algebraic integration, Var(2Y ) (5)
June 2024 · AS Paper 2 (Further Statistics 2) · Q4(a) 1 mark continuous random variables
4. The continuous random variable X is uniformly distributed over the interval [2, 7] (a) Write down the value of E(X) (1)
June 2024 · AS Paper 2 (Further Statistics 2) · Q4(b) 1 mark continuous random variables
(b) Find P(1 < X < 4) (1)
June 2024 · AS Paper 2 (Further Statistics 2) · Q4(c) 3 marks continuous random variables
(c) Find P(2X 2 – 15X + 27 > 0) (3)
June 2024 · AS Paper 2 (Further Statistics 2) · Q4(d) 3 marks continuous random variables
< (d) Find E ;: X (3)
June 2024 · AS Paper 2 (Further Statistics 2) · Q5(a) 3 marks correlation fs2linear regression
5. A random sample of 24 adults is taken. The height, h metres, and the arm span, s metres, for each adult are recorded. These data are summarised below. Shh = 0 377 Ssh = 0 352 s = 1 70 h = 1 68 The least squares regression line of h on s is h = a + 0.919s where a is a constant. (a) Calculate the product moment correlation coefficient. (3)
June 2024 · AS Paper 2 (Further Statistics 2) · Q5(b) 2 marks linear regression
A doctor uses the least squares regression line of h on s as a model to predict a person’s height based on their arm span. (b) Use the model to predict the height of an adult with arm span 1.79 metres. (2)
June 2024 · AS Paper 2 (Further Statistics 2) · Q5(c) 3 marks linear regression
Ewan has an arm span of 1.70 metres and a height of 1.75 metres. His information is added to the sample as the 25th adult. (c) Explain how the gradient of the regression line for the sample of 25 adults compares with the gradient of the regression line for the original sample of 24 adults. Give a reason for your answer. (3)

Find an Edexcel Further Maths tutor

Want this paper marked and gone through with a Further Maths tutor? Message us.

Prefer email? Send an enquiry

If you are under 18, please include a parent's contact details. Enquiries go to enquiries@alevelfurthermathstutor.com and are deleted once handled.