June 2025: AS Paper 24: Further Statistics 2

40 marks · 16 question parts · Question paper, mark scheme and examiner's report on Pearson's site

Question by question

QTopicMarksDifficulty
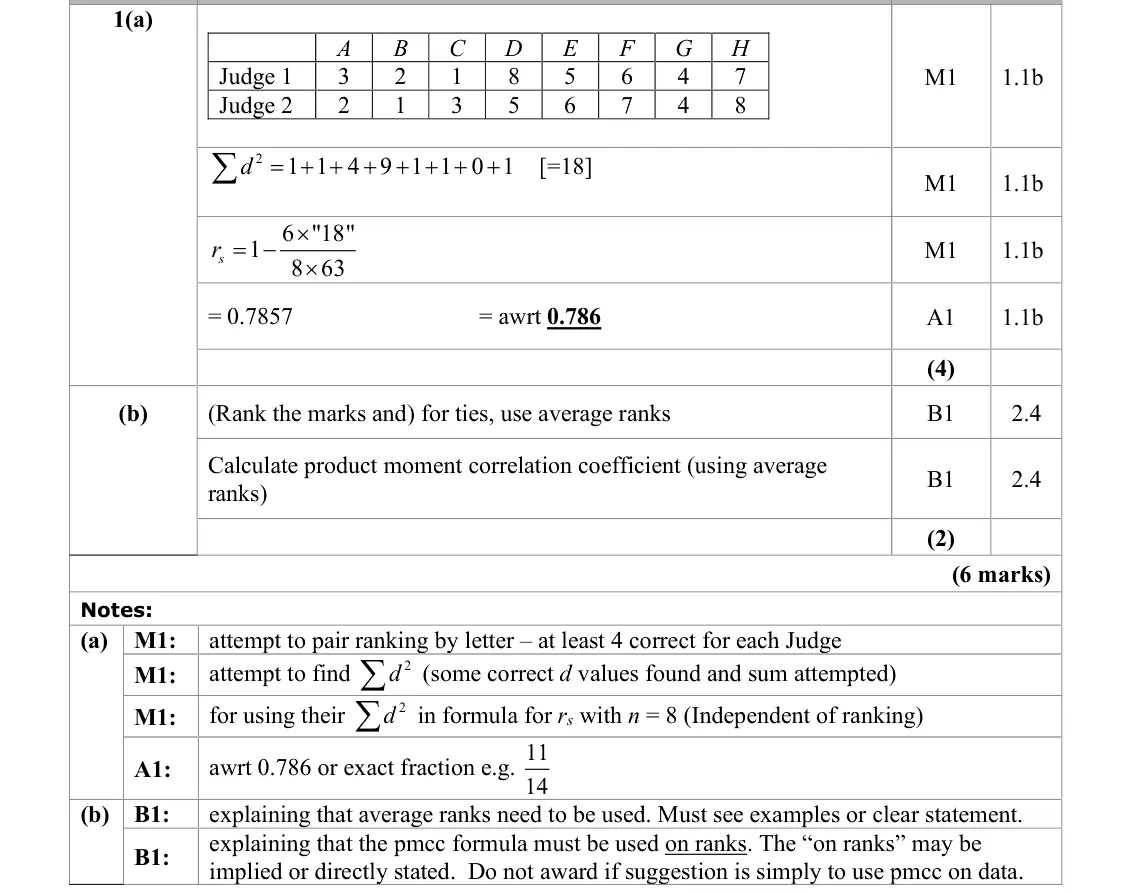
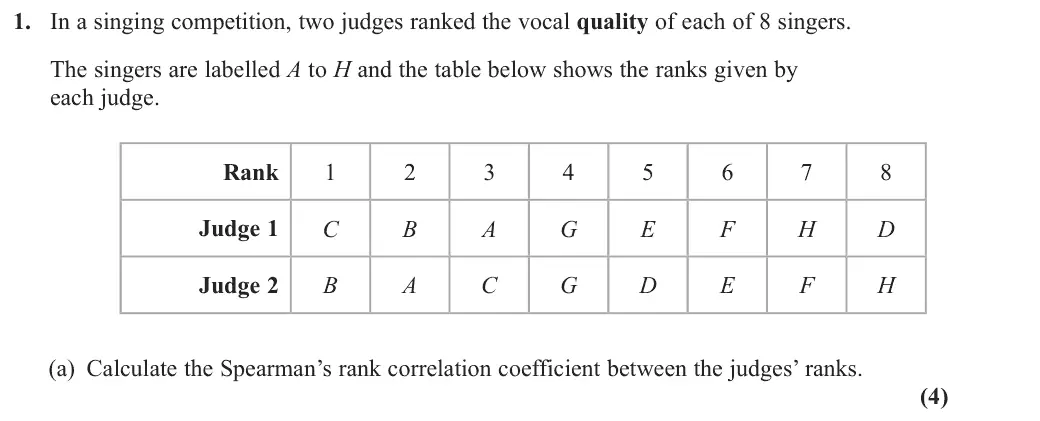
1(a) Correlation: PMCC, Spearman's rank and tests 4 —
1(b) Correlation: PMCC, Spearman's rank and tests 2 —
2(a) Continuous random variables and the uniform distribution 1 —
2(b) Continuous random variables and the uniform distribution 1 —
2(c) Continuous random variables and the uniform distribution 1 —
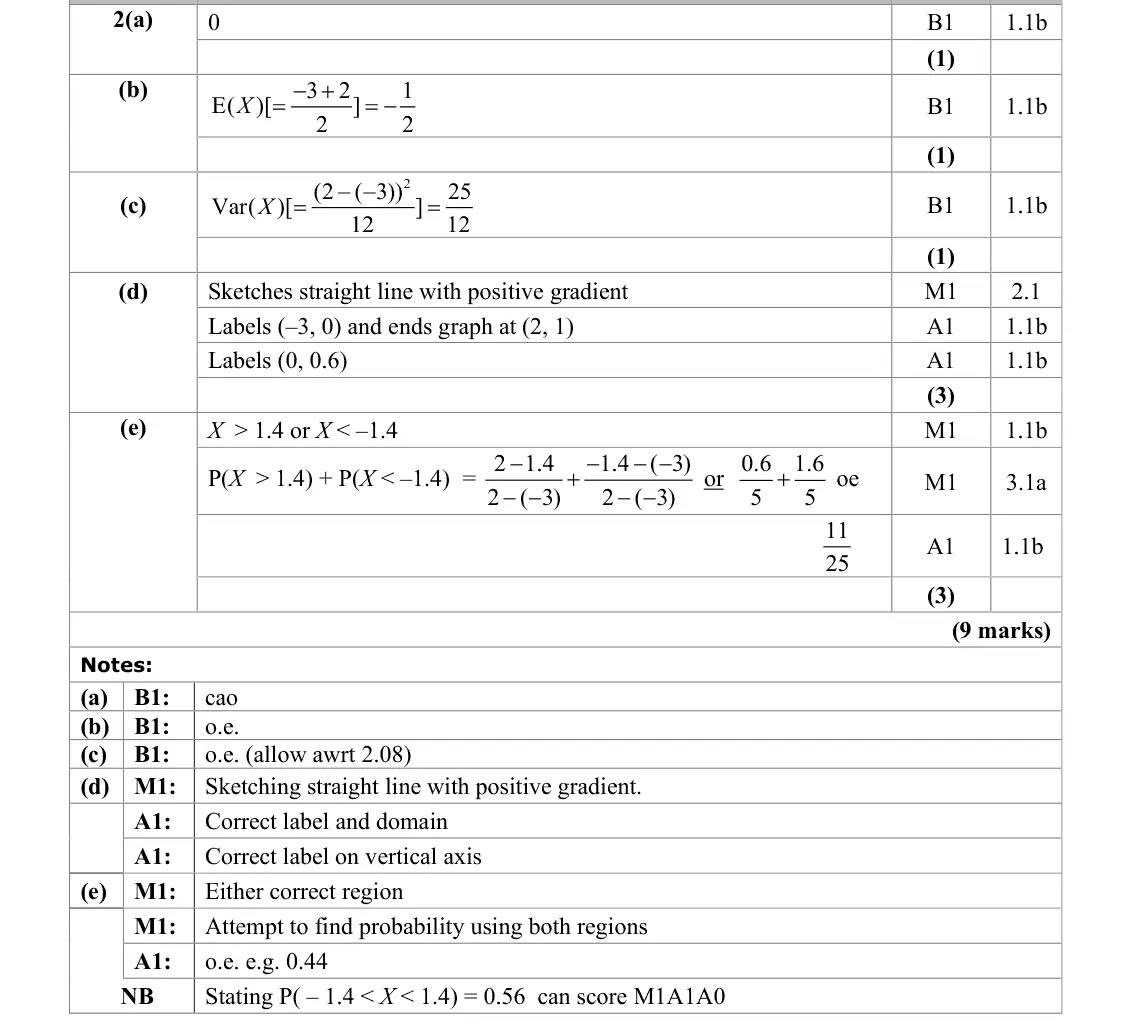
2(d) Continuous random variables and the uniform distribution 3 —
2(e) Continuous random variables and the uniform distribution 3 —
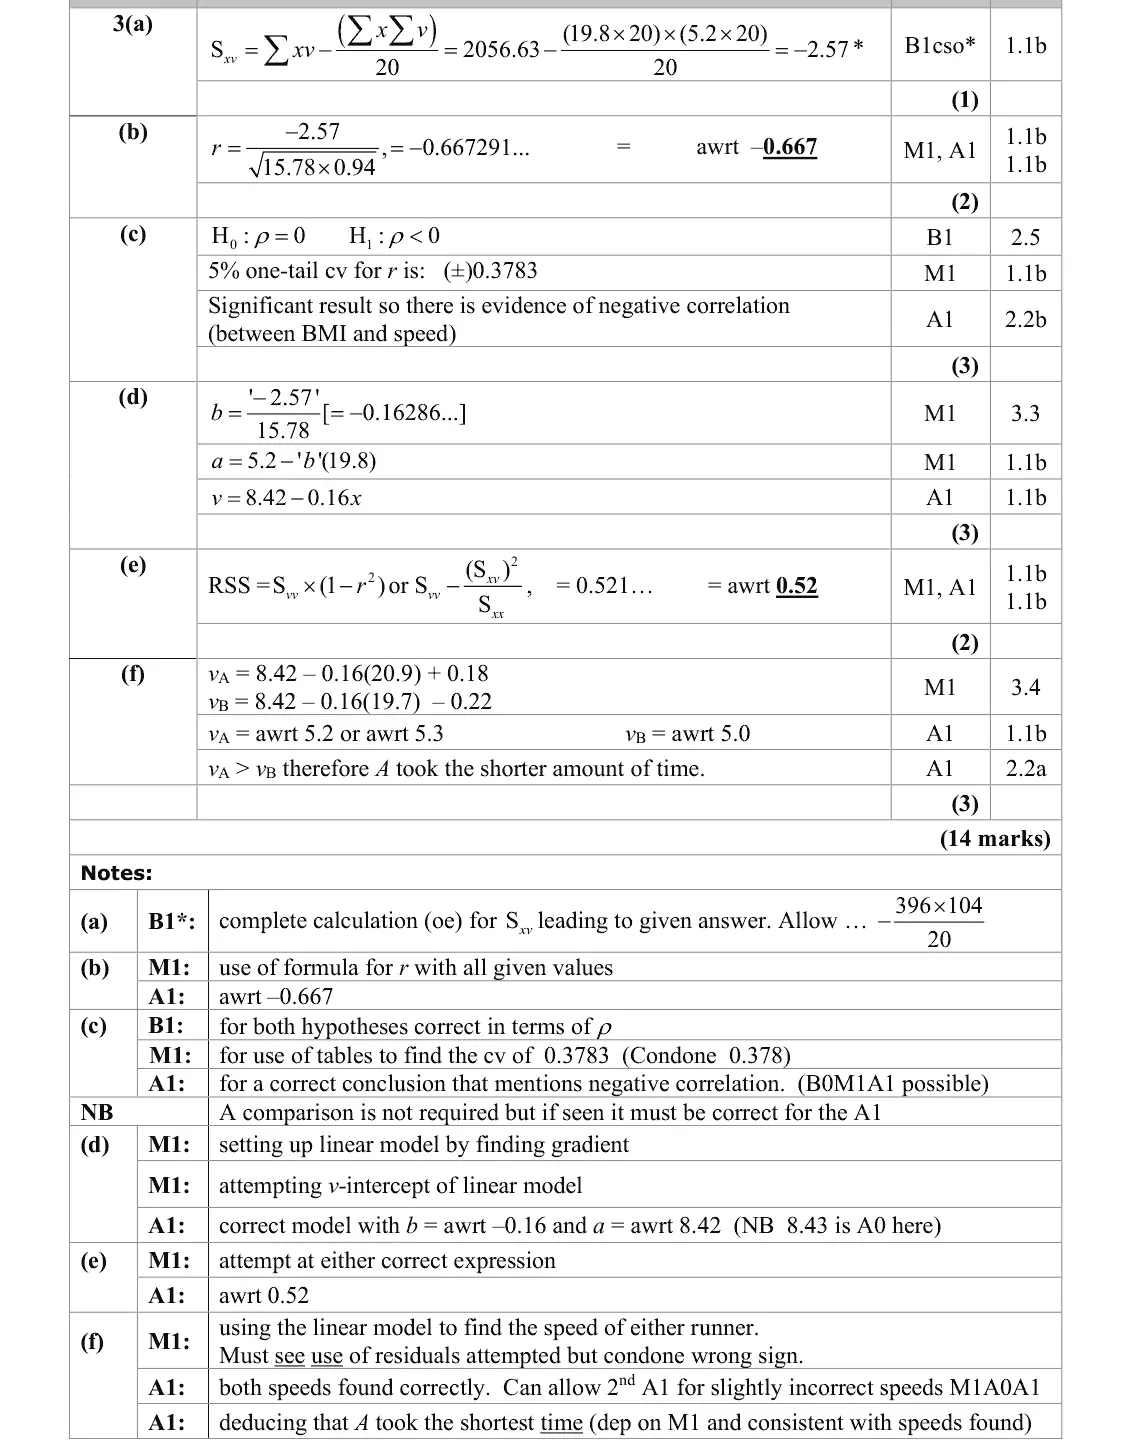
3(a) Correlation: PMCC, Spearman's rank and tests 1 —
3(b) Correlation: PMCC, Spearman's rank and tests 2 —
3(c) Correlation: PMCC, Spearman's rank and tests 3 —
3(d) Linear regression and residuals 3 —
3(e) Linear regression and residuals 2 —
3(f) Linear regression and residuals 3 —
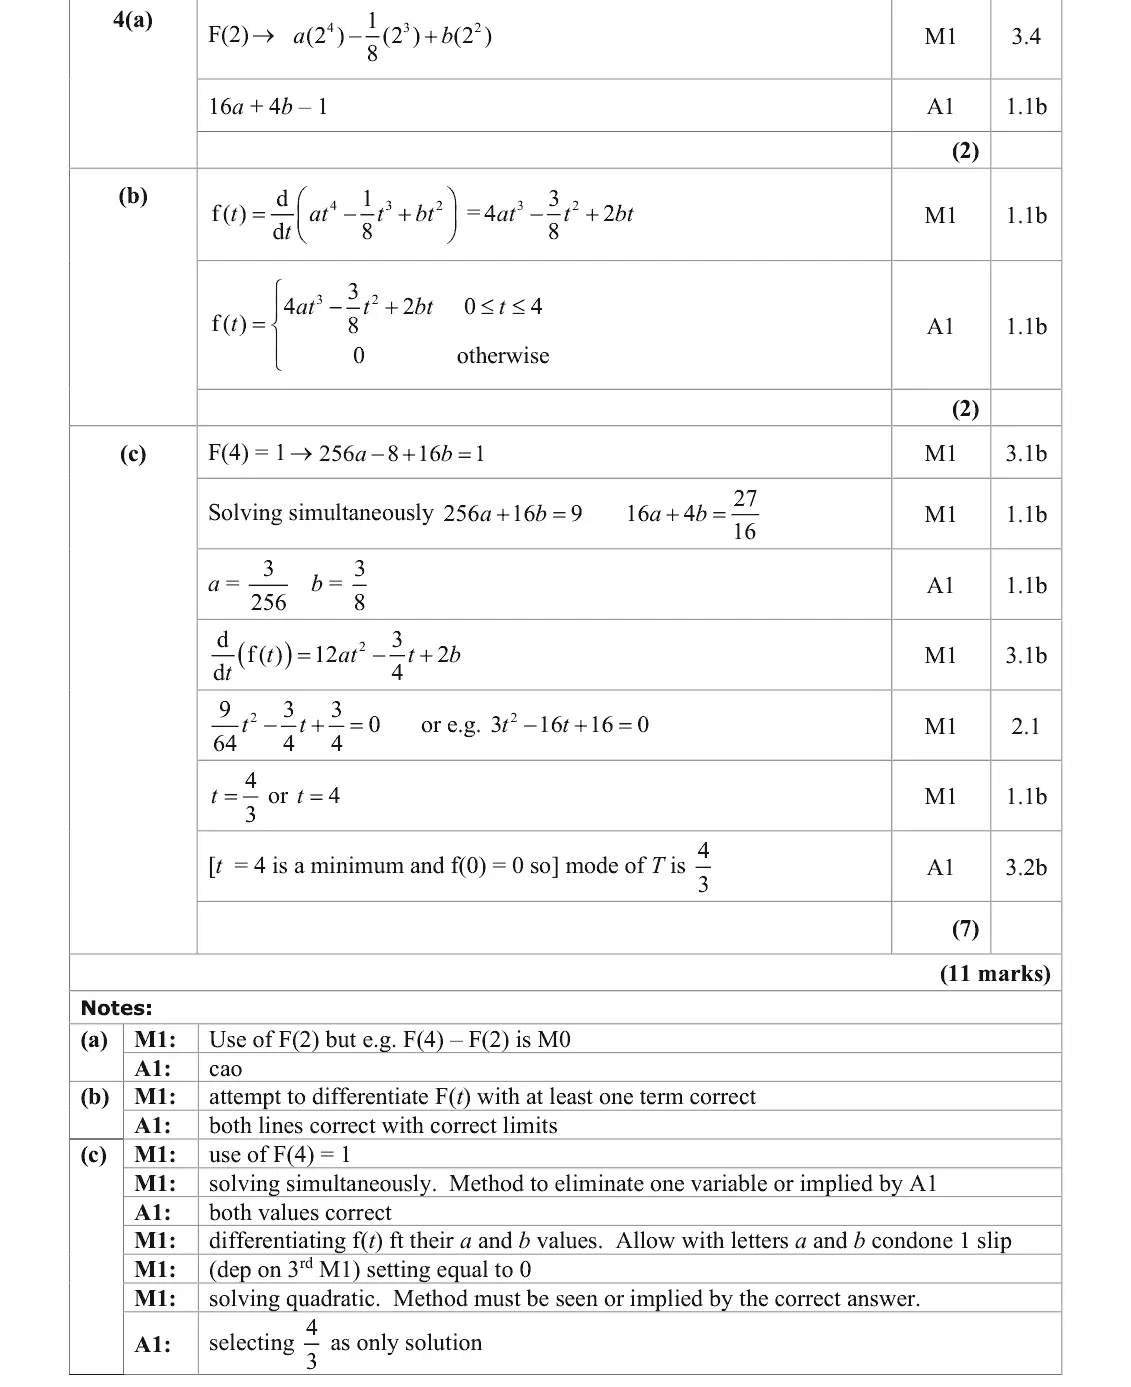
4(a) Continuous random variables and the uniform distribution 2 —
4(b) Continuous random variables and the uniform distribution 2 —
4(c) Continuous random variables and the uniform distribution 7 —

The questions

1(a)1(b)2(a)2(b)2(c)2(d)2(e)3(a)3(b)3(c)3(d)3(e)3(f)4(a)4(b)4(c)
June 2025 · AS Paper 2 (Further Statistics 2) · Q1(a) 4 marks correlation fs2
1. In a singing competition, two judges ranked the vocal quality of each of 8 singers. The singers are labelled A to H and the table below shows the ranks given by each judge. Rank Judge 1 C B A G E F H Judge 2 B A C G E F H (a) Calculate the Spearman’s rank correlation coefficient between the judges’ ranks. (4)
June 2025 · AS Paper 2 (Further Statistics 2) · Q1(b) 2 marks correlation fs2
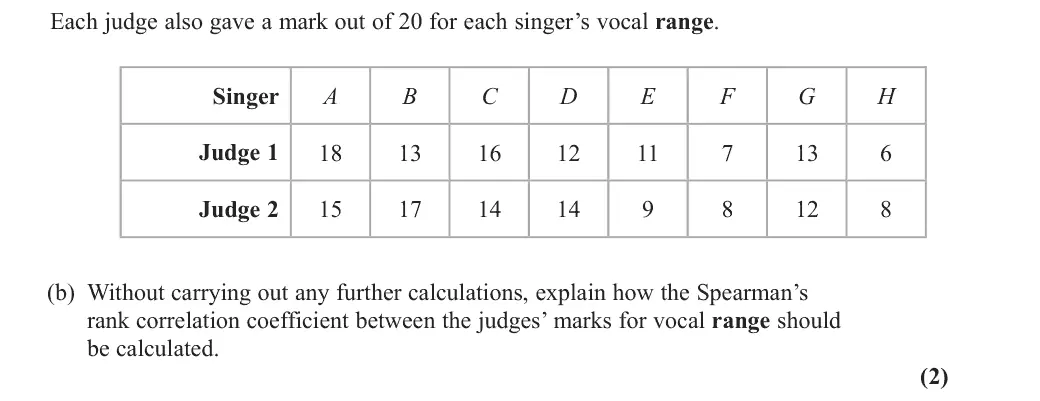
Each judge also gave a mark out of 20 for each singer’s vocal range. Singer A B C E F G H Judge 1 Judge 2 (b) Without carrying out any further calculations, explain how the Spearman’s rank correlation coefficient between the judges’ marks for vocal range should be calculated. (2)
June 2025 · AS Paper 2 (Further Statistics 2) · Q2(a) 1 mark continuous random variables
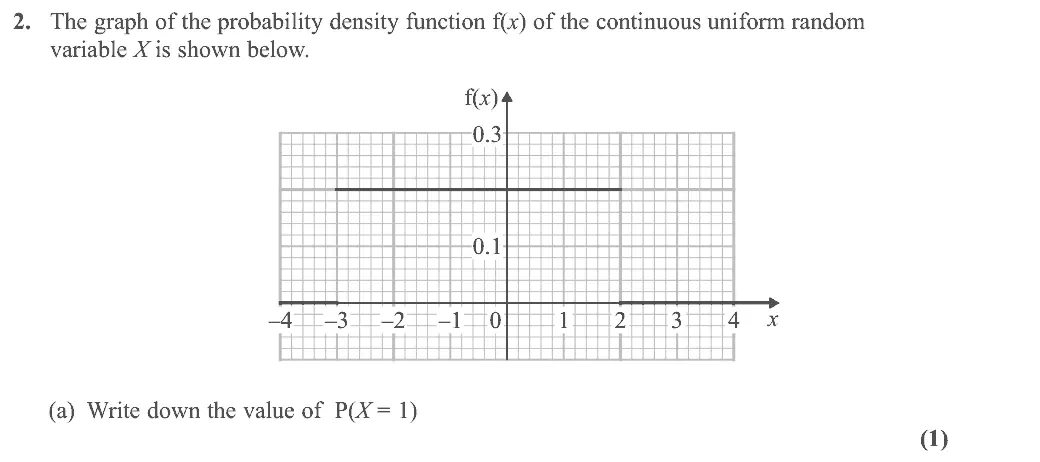
2. The graph of the probability density function f(x) of the continuous uniform random variable X is shown below. f(x) 0.3 0.1 x –4 –3 –2 –1 (a) Write down the value of P(X = 1) (1)
June 2025 · AS Paper 2 (Further Statistics 2) · Q2(b) 1 mark continuous random variables
(b) Find E(X) (1)
June 2025 · AS Paper 2 (Further Statistics 2) · Q2(c) 1 mark continuous random variables
(c) Find Var(X) (1)
June 2025 · AS Paper 2 (Further Statistics 2) · Q2(d) 3 marks continuous random variables
(d) Sketch the cumulative distribution function of X for –3 x 2 You should label any points where the sketch touches or crosses the coordinate axes. (3)
June 2025 · AS Paper 2 (Further Statistics 2) · Q2(e) 3 marks continuous random variables
(e) Find P(X 2 > 1.96) (3)
June 2025 · AS Paper 2 (Further Statistics 2) · Q3(a) 1 mark correlation fs2
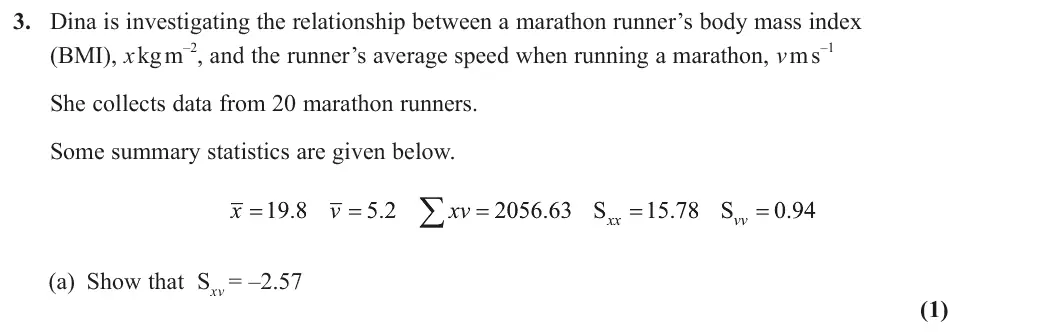
3. Dina is investigating the relationship between a marathon runner’s body mass index (BMI), x kg m –2, and the runner’s average speed when running a marathon, v m s –1 She collects data from 20 marathon runners. Some summary statistics are given below. ; x 19 8 v 5 2 xv 2056 63 S 15 78 S 0 94 xx vv (a) Show that Sxv = –2.57 (1)
June 2025 · AS Paper 2 (Further Statistics 2) · Q3(b) 2 marks correlation fs2
(b) Find the value of the product moment correlation coefficient between v and x (2)
June 2025 · AS Paper 2 (Further Statistics 2) · Q3(c) 3 marks correlation fs2
(c) Use a suitable test, with a 5% level of significance, to assess whether or not there is evidence of a negative correlation between BMI and average speed. State the hypotheses and the critical value used. (3)
June 2025 · AS Paper 2 (Further Statistics 2) · Q3(d) 3 marks linear regression
(d) Find the equation of the regression line of v on x in the form v = a + bx giving the values of a and b to 2 decimal places. (3)
June 2025 · AS Paper 2 (Further Statistics 2) · Q3(e) 2 marks linear regression
(e) Calculate the residual sum of squares (RSS). (2)
June 2025 · AS Paper 2 (Further Statistics 2) · Q3(f) 3 marks linear regression
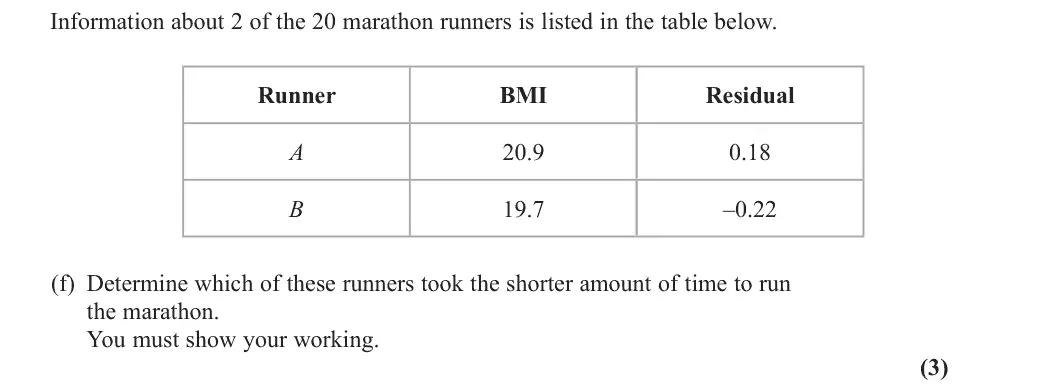
Information about 2 of the 20 marathon runners is listed in the table below. Runner BMI Residual 20.9 0.18 A B 19.7 –0.22 (f) Determine which of these runners took the shorter amount of time to run the marathon. You must show your working. (3)
June 2025 · AS Paper 2 (Further Statistics 2) · Q4(a) 2 marks continuous random variables
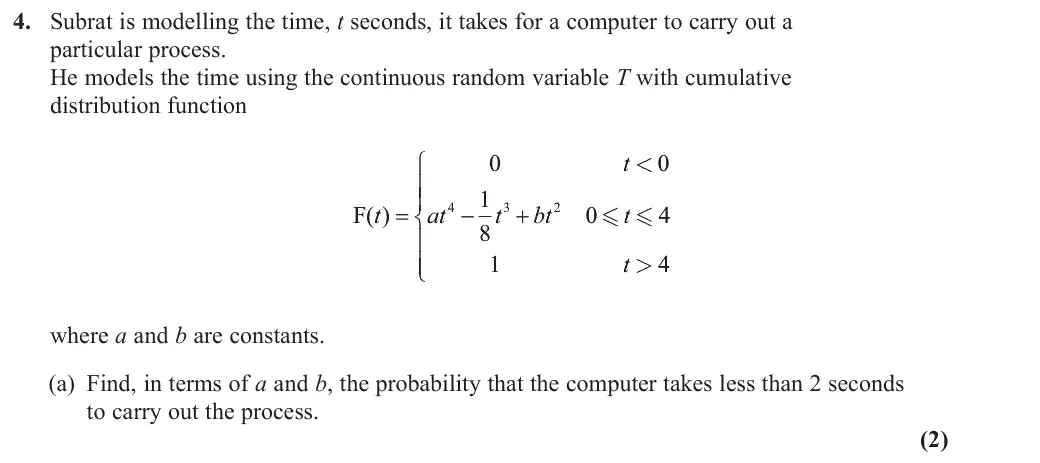
4. Subrat is modelling the time, t seconds, it takes for a computer to carry out a particular process. He models the time using the continuous random variable T with cumulative distribution function t < ( )t at t bt t F t > where a and b are constants. (a) Find, in terms of a and b, the probability that the computer takes less than 2 seconds to carry out the process. (2)
June 2025 · AS Paper 2 (Further Statistics 2) · Q4(b) 2 marks continuous random variables
(b) Find, in terms of a and b, the probability density function of T for all values of t (2)
June 2025 · AS Paper 2 (Further Statistics 2) · Q4(c) 7 marks continuous random variables
The probability that the computer takes less than 2 seconds to carry out the process is 11 (c) Find the exact value of the mode of T You must show all stages of your working. (7)

Find an Edexcel Further Maths tutor

Want this paper marked and gone through with a Further Maths tutor? Message us.

Prefer email? Send an enquiry

If you are under 18, please include a parent's contact details. Enquiries go to enquiries@alevelfurthermathstutor.com and are deleted once handled.