Oct 2020: AS Paper 24: Further Statistics 2
40 marks · 17 question parts · Question paper, mark scheme and examiner's report on Pearson's site
Question by question
The questions
Mark scheme (whole question; this part is marked with the orange bar)
Key points from the mark scheme and examiner's report
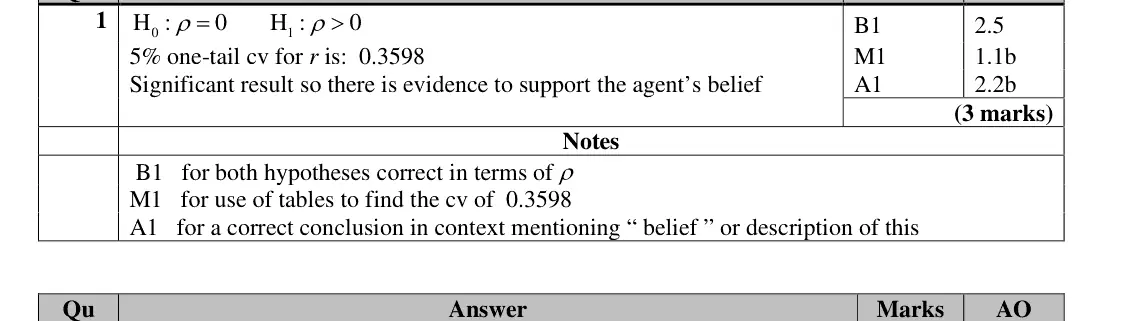
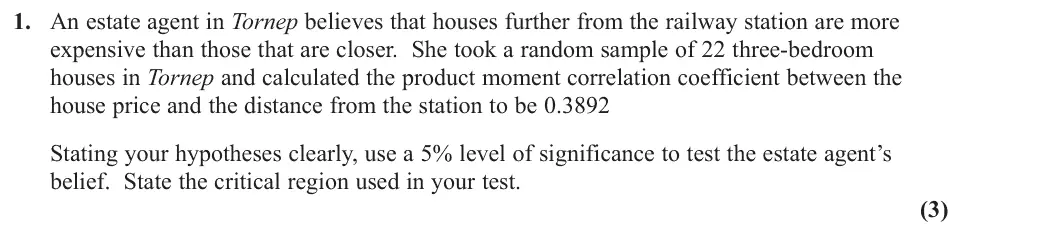
- H0: ρ = 0, H1: ρ > 0 (in terms of ρ)
- one-tailed 5% cv for n = 22 is 0.3598, critical region r > 0.3598
- 0.3892 is significant so evidence supports the agent's belief, in context
Mark scheme (whole question; this part is marked with the orange bar)
Key points from the mark scheme and examiner's report
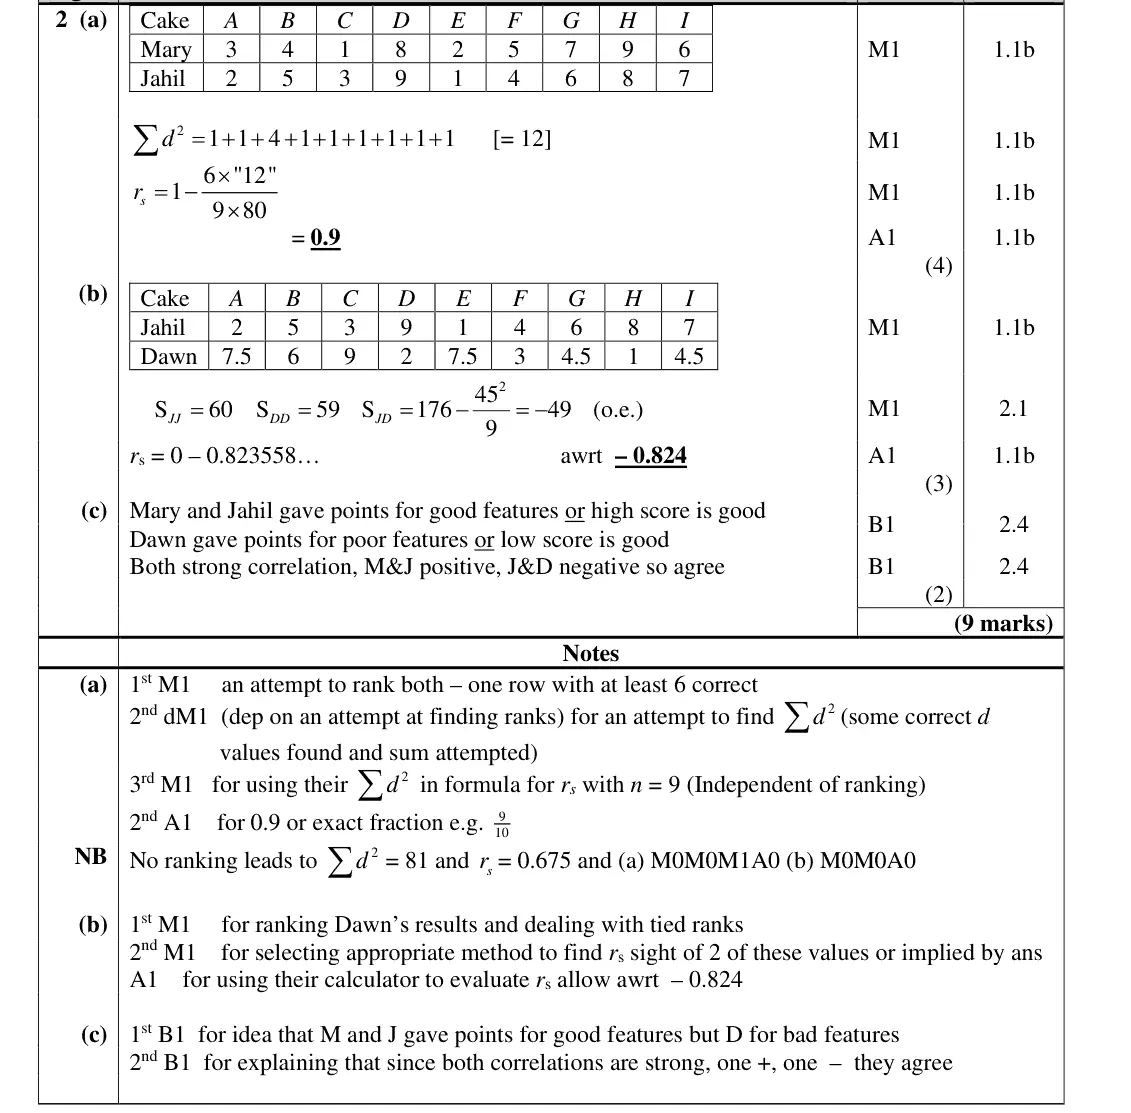
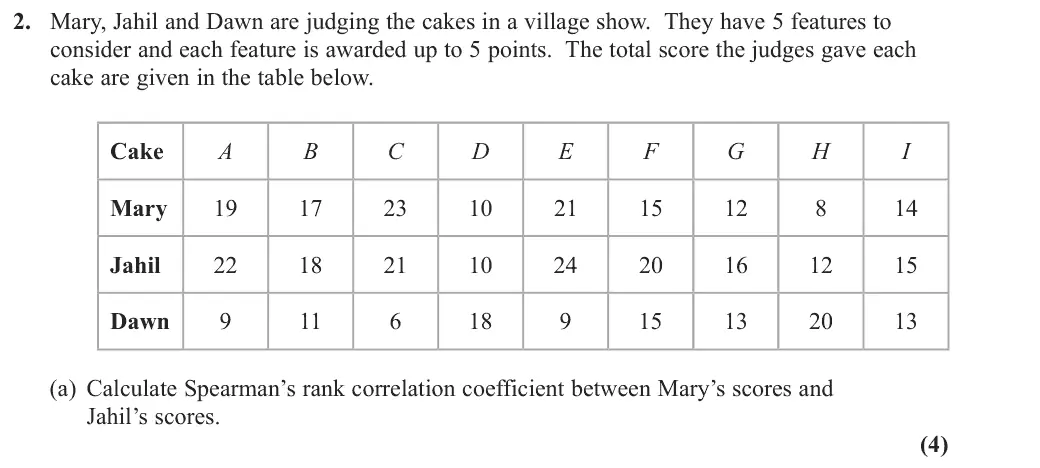
- rank both judges first (no ranking gives Σd² = 81, rs = 0.675, scoring 1 mark)
- Σd² = 12
- rs = 1 − 6(12)/(9 × 80) = 0.9

Mark scheme (whole question; this part is marked with the orange bar)
Key points from the mark scheme and examiner's report
- Dawn has tied ranks (7.5, 7.5 and 4.5, 4.5) so use the pmcc on the ranks: SJJ = 60, SDD = 59, SJD = −49
- rs = −0.824

Mark scheme (whole question; this part is marked with the orange bar)
Key points from the mark scheme and examiner's report
- Mary and Jahil gave points for good features, Dawn for poor features (low score = good)
- both correlations strong, one positive and one negative, so all three really agree
Mark scheme (whole question; this part is marked with the orange bar)
Key points from the mark scheme and examiner's report
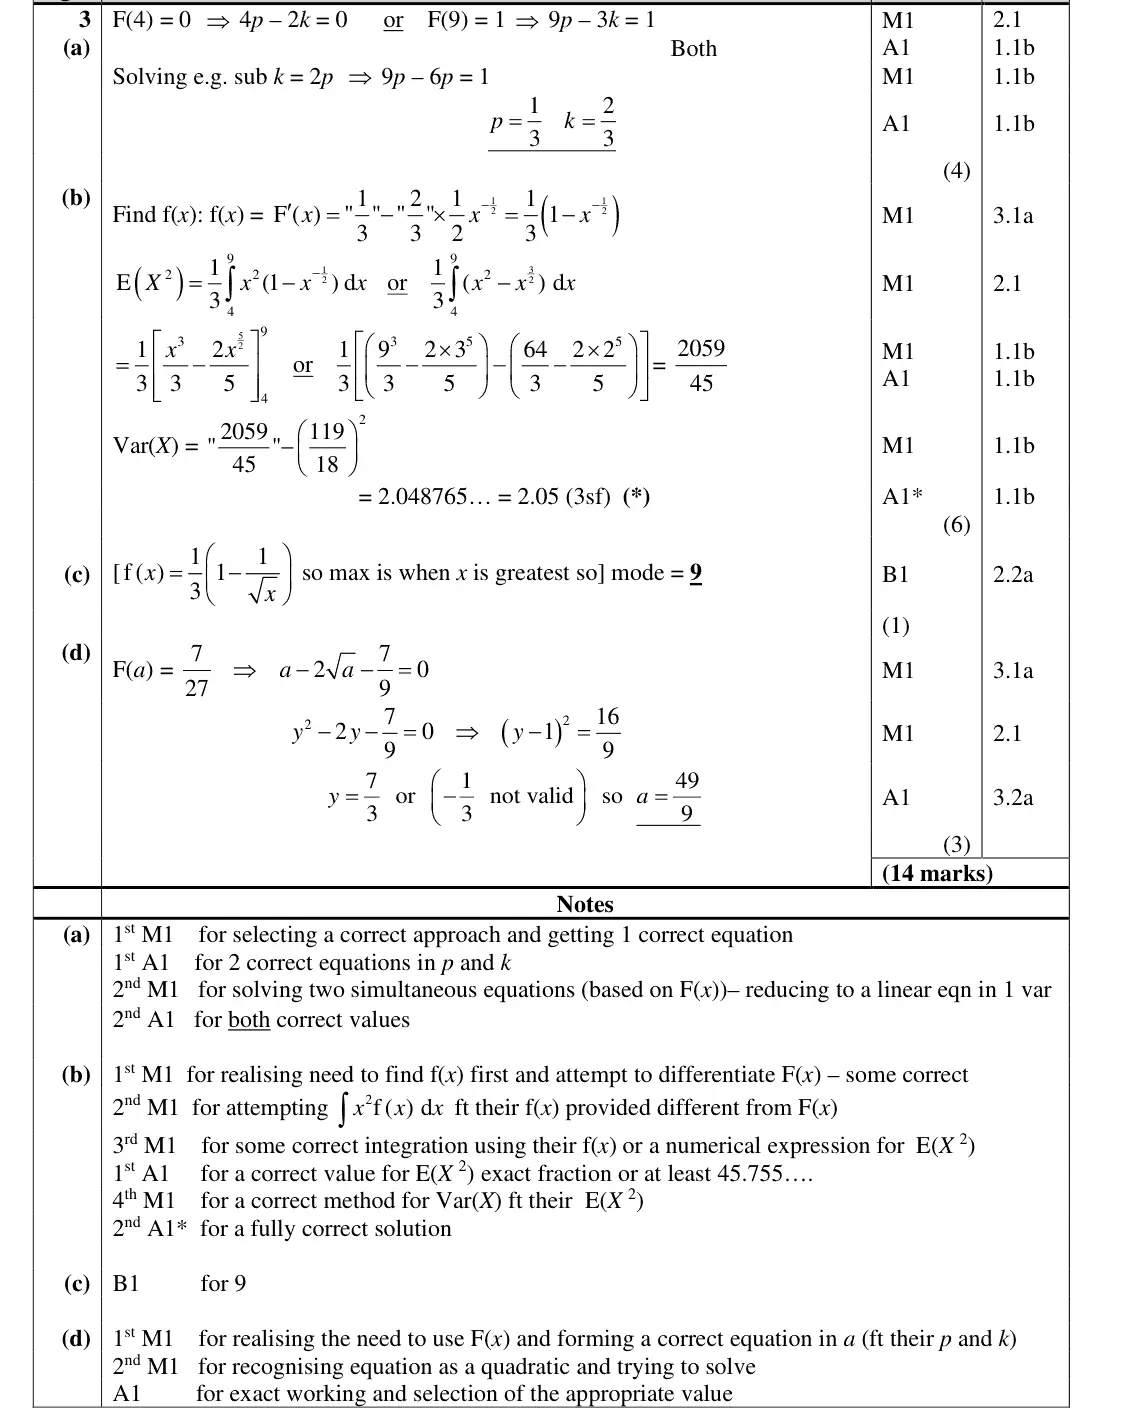
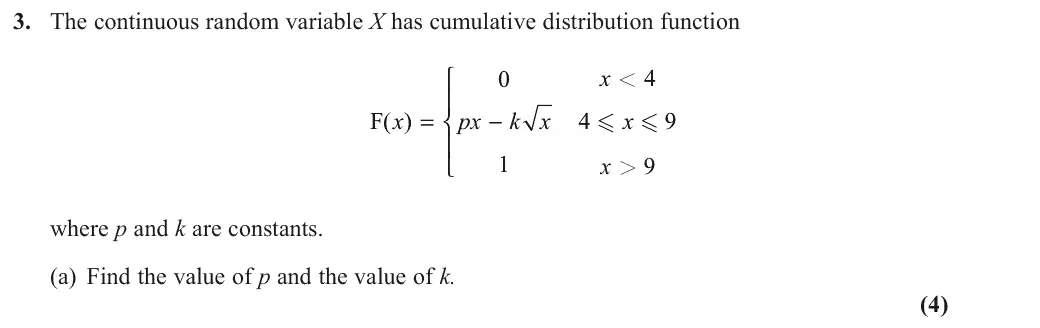
- F(4) = 0 gives 4p − 2k = 0
- F(9) = 1 gives 9p − 3k = 1
- p = 1/3, k = 2/3

Mark scheme (whole question; this part is marked with the orange bar)
Key points from the mark scheme and examiner's report
- differentiate F first: f(x) = (1/3)(1 − x^(−1/2))
- E(X²) = 2059/45
- Var(X) = 2059/45 − (119/18)² = 2.0488 = 2.05

Mark scheme (whole question; this part is marked with the orange bar)
Key points from the mark scheme and examiner's report
- f(x) is increasing on [4, 9] so the mode is 9

Mark scheme (whole question; this part is marked with the orange bar)
Key points from the mark scheme and examiner's report
- F(a) = 7/27 gives a − 2√a − 7/9 = 0, a quadratic in y = √a
- y = 7/3 (reject −1/3), a = 49/9 exact
Mark scheme (whole question; this part is marked with the orange bar)
Key points from the mark scheme and examiner's report
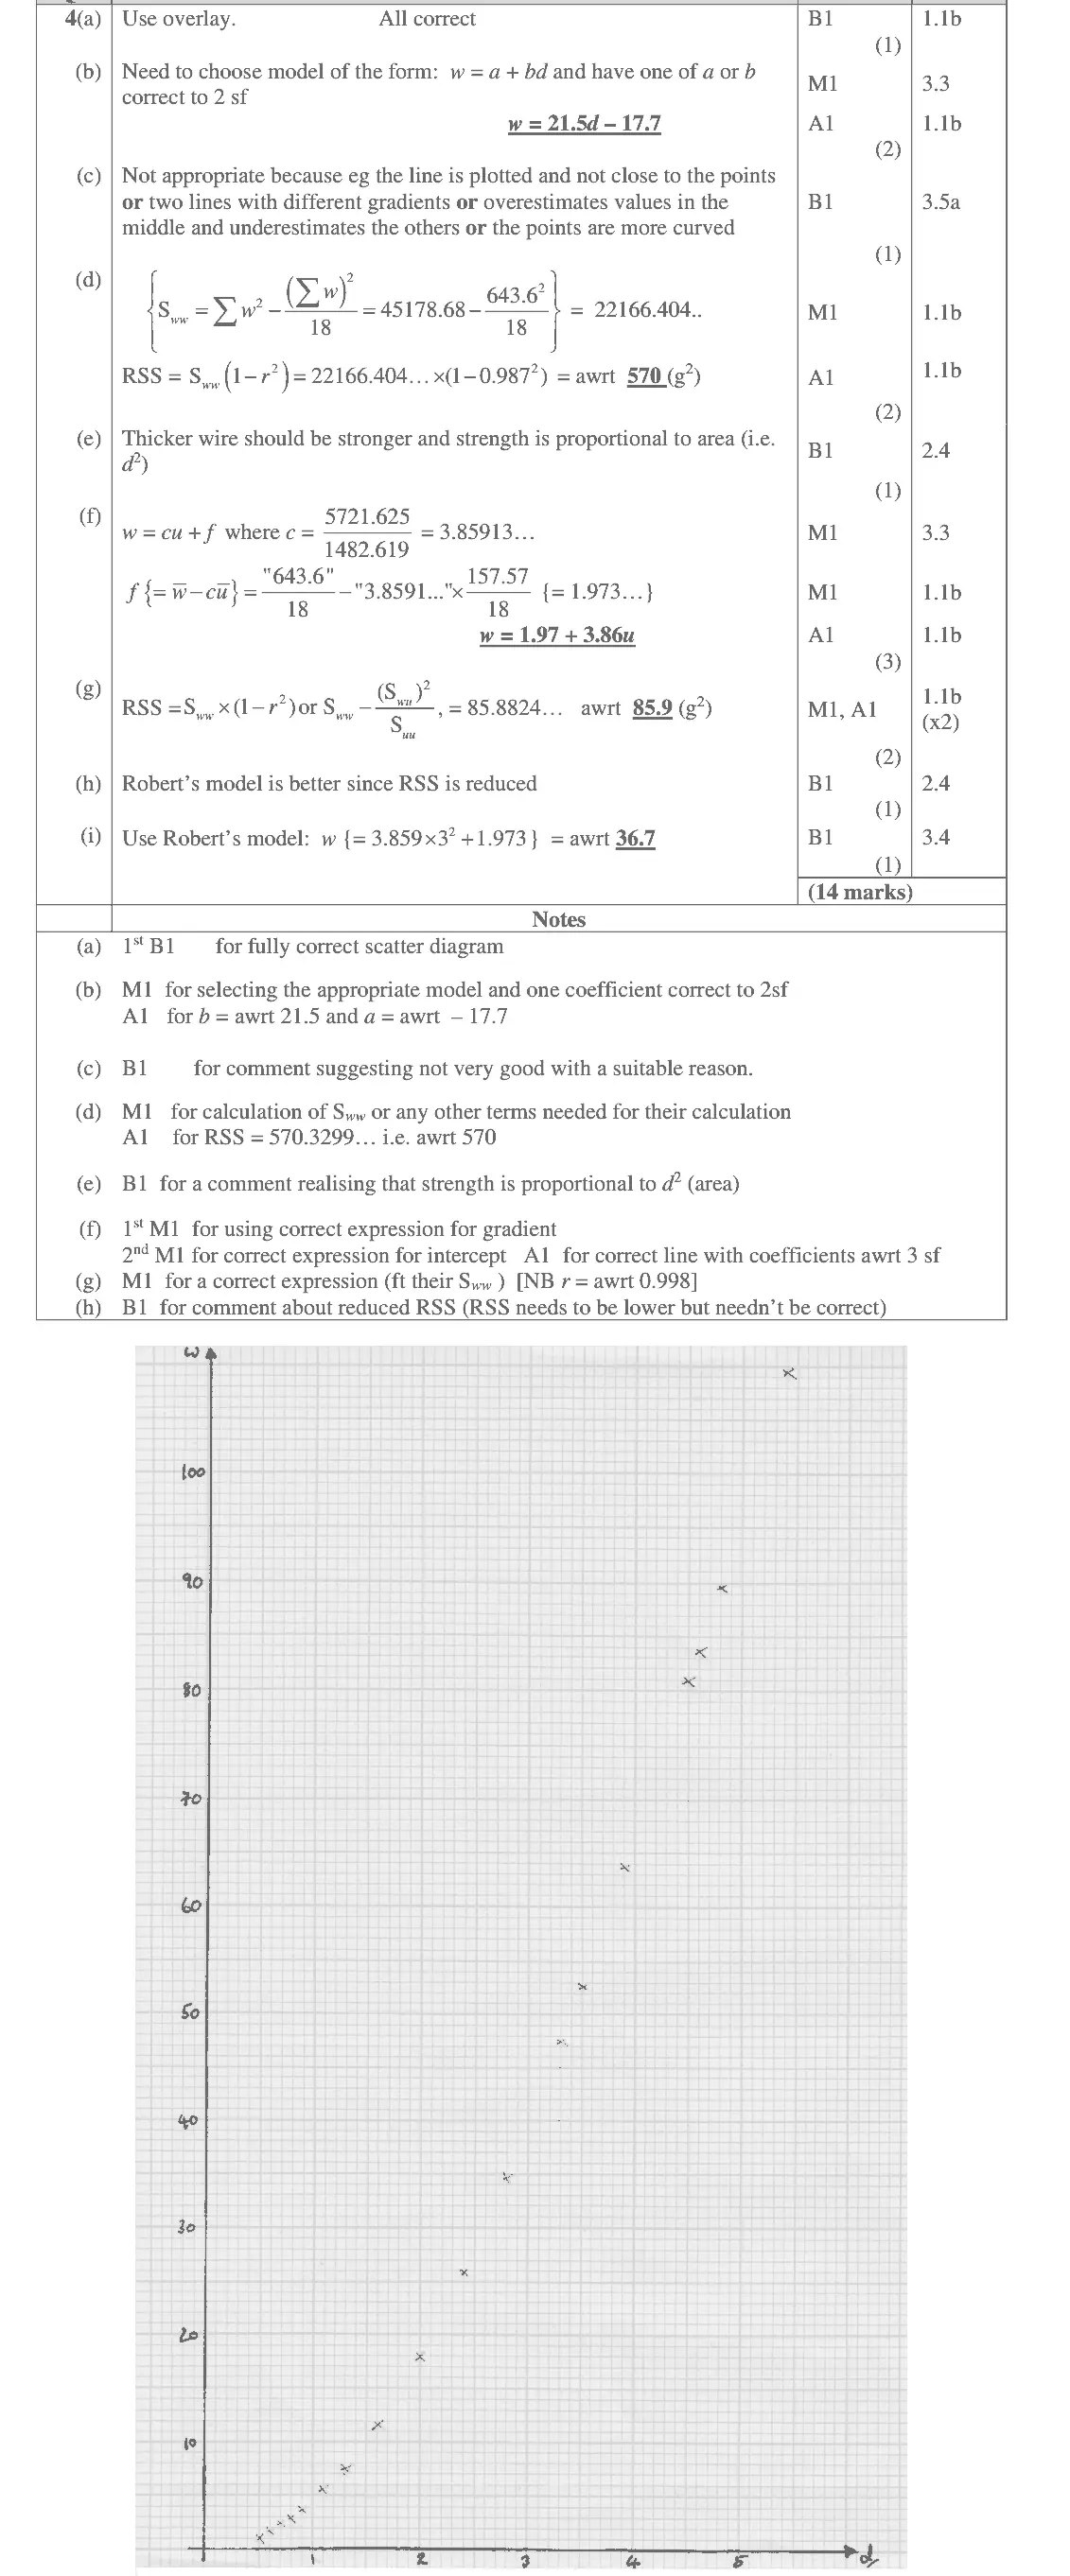
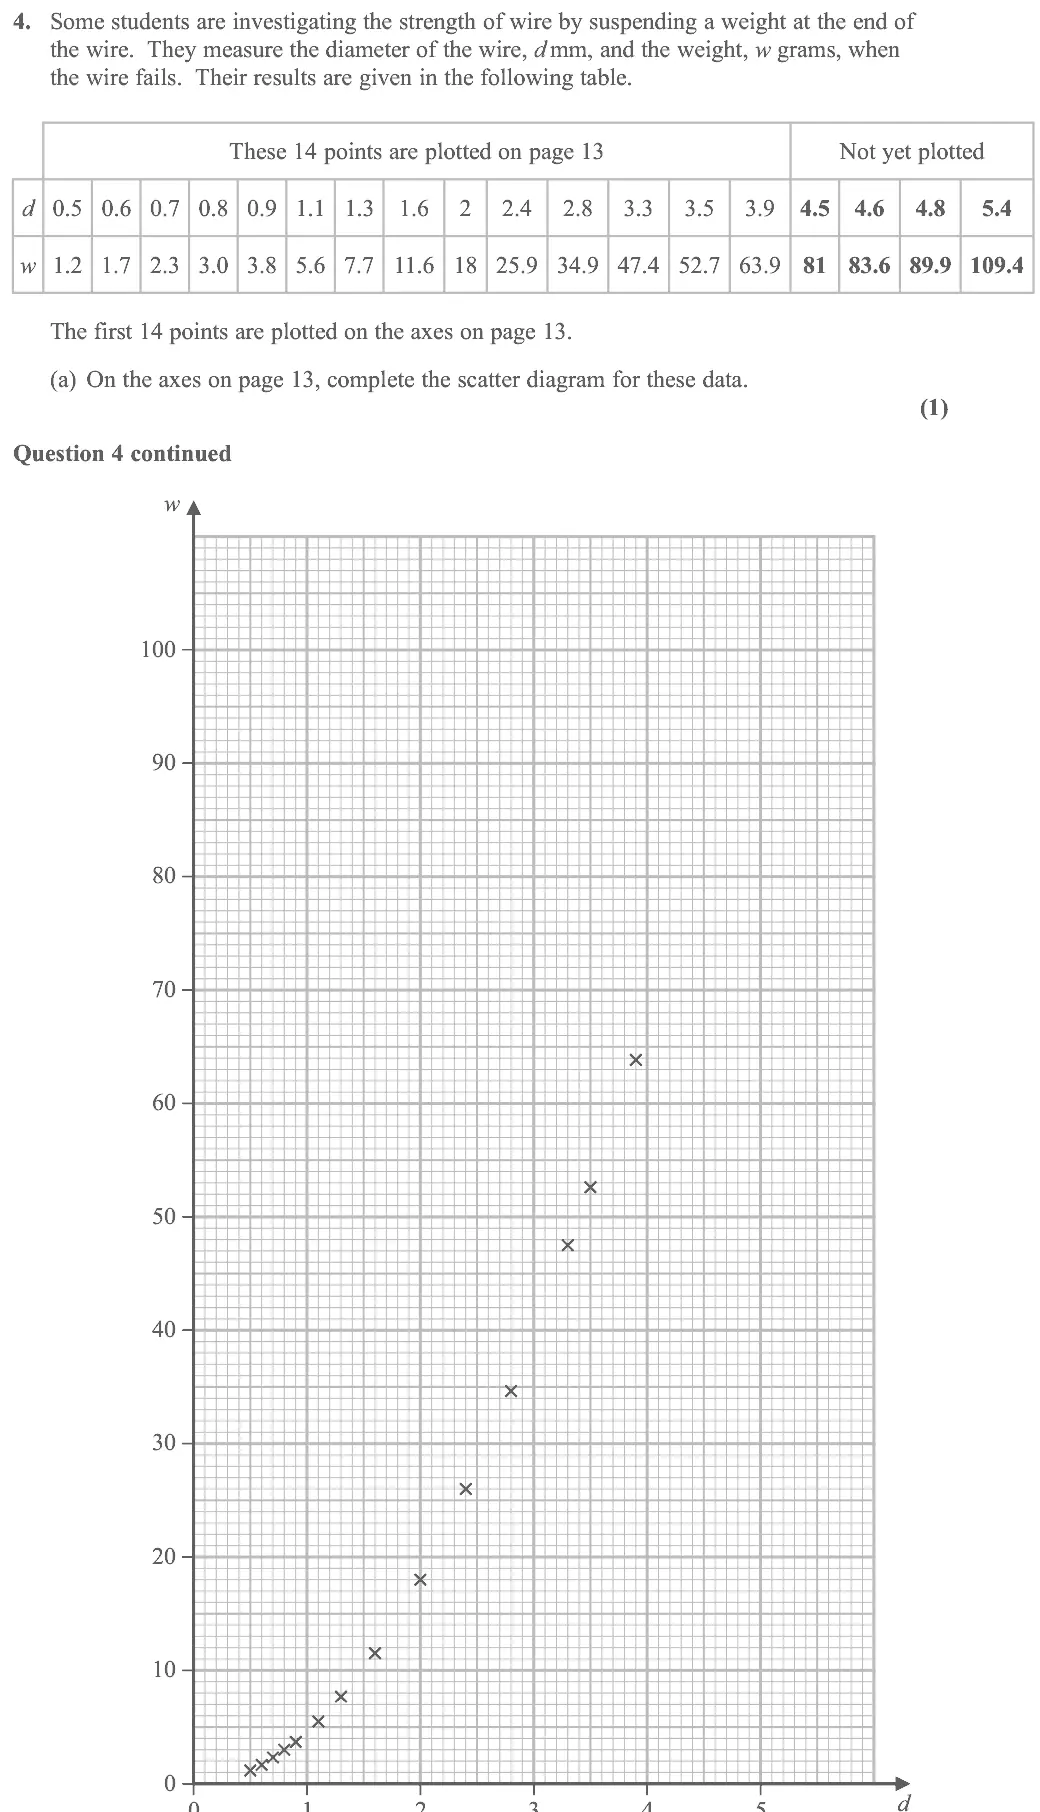
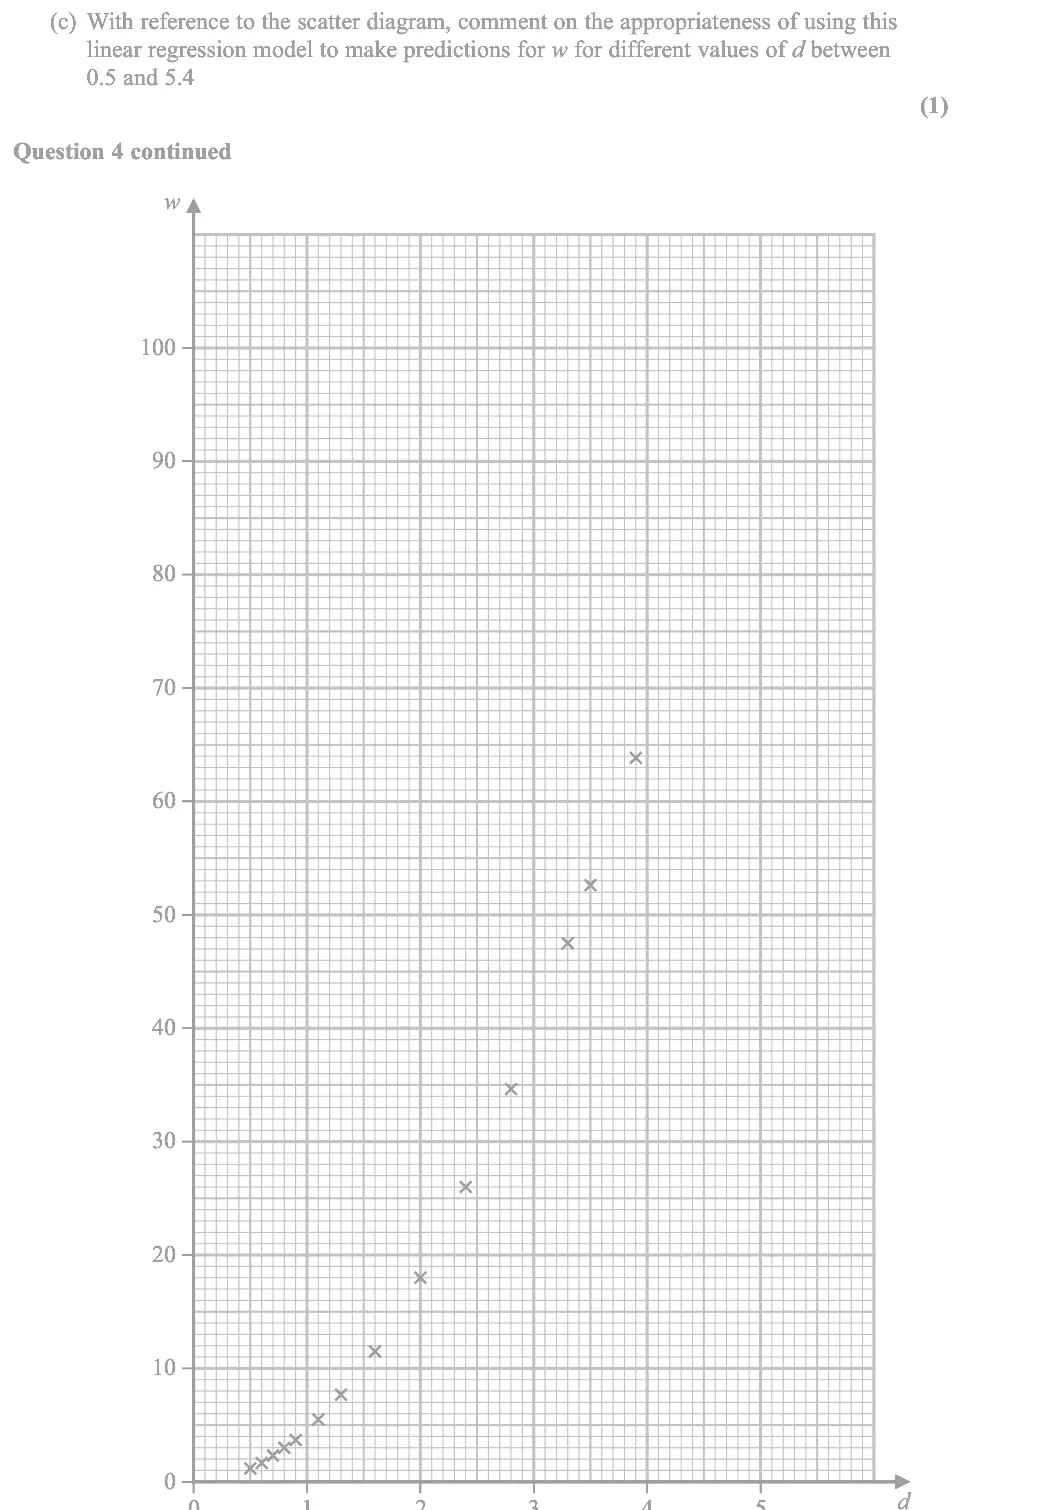
- plot the four remaining points (4.5, 81), (4.6, 83.6), (4.8, 89.9), (5.4, 109.4) on the given axes

Mark scheme (whole question; this part is marked with the orange bar)
Key points from the mark scheme and examiner's report
- calculator regression: w = 21.5d − 17.7
Mark scheme (whole question; this part is marked with the orange bar)
Key points from the mark scheme and examiner's report
- not appropriate: points follow a curve, so the line overestimates in the middle and underestimates at the ends

Mark scheme (whole question; this part is marked with the orange bar)
Key points from the mark scheme and examiner's report
- Sww = Σw² − (Σw)²/18 = 22166.4 from the table
- RSS = Sww(1 − r²) = 570
Mark scheme (whole question; this part is marked with the orange bar)
Key points from the mark scheme and examiner's report
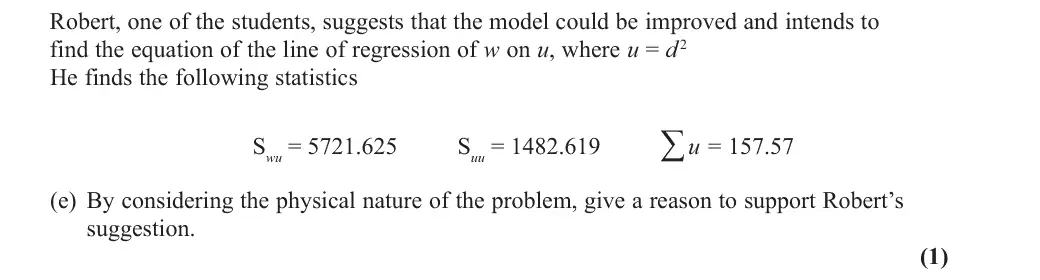
- strength depends on cross-sectional area, which is proportional to d²

Mark scheme (whole question; this part is marked with the orange bar)
Key points from the mark scheme and examiner's report
- gradient Swu/Suu = 3.859
- intercept w̄ − c ū = 1.97
- w = 1.97 + 3.86u

Mark scheme (whole question; this part is marked with the orange bar)
Key points from the mark scheme and examiner's report
- RSS = Sww − Swu²/Suu = 85.9 (r = 0.998)

Mark scheme (whole question; this part is marked with the orange bar)
Key points from the mark scheme and examiner's report
- Robert's model is better because its RSS is much smaller (85.9 against 570)

Mark scheme (whole question; this part is marked with the orange bar)
Key points from the mark scheme and examiner's report
- use Robert's model with u = 3² = 9: w = 3.859(9) + 1.973 = 36.7 g
- do not use d = 3 directly
Find an Edexcel Further Maths tutor
Want this paper marked and gone through with a Further Maths tutor? Message us.
Prefer email? Send an enquiry