FS2.3.1 Use of formulae to calculate the product moment correlation…
Section
FS2.3 Correlation
Level
AS & A level
Statement
Use of formulae to calculate the product moment correlation coefficient. Knowledge of the conditions for the use of the product moment correlation coefficient. A knowledge of the effects of coding will be expected.
Guidance
Students will be expected to be able to use the formula to calculate the value of a coefficient given summary statistics.
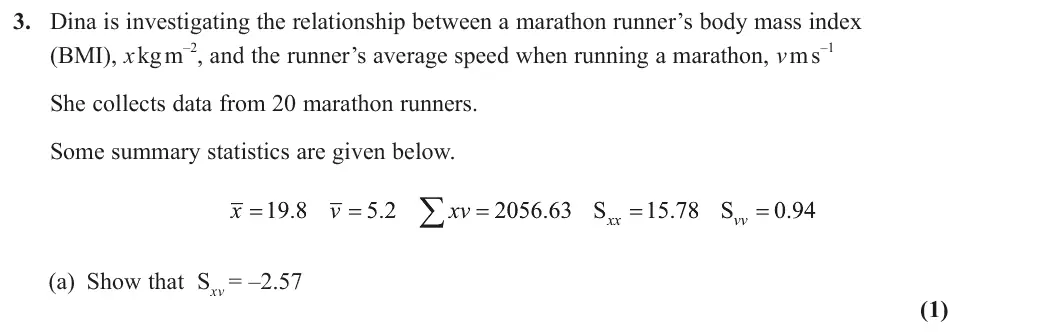
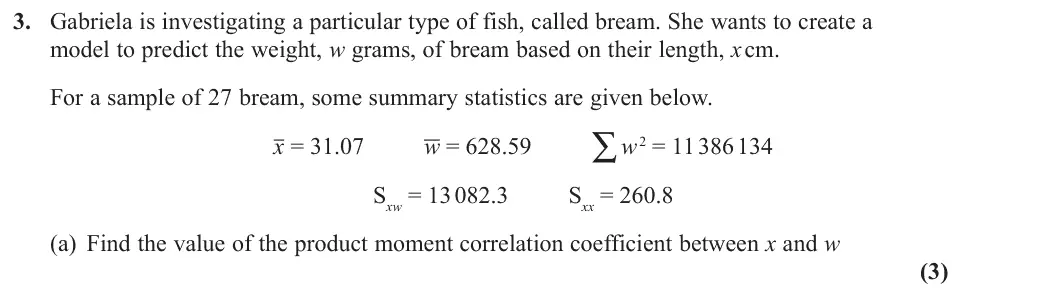
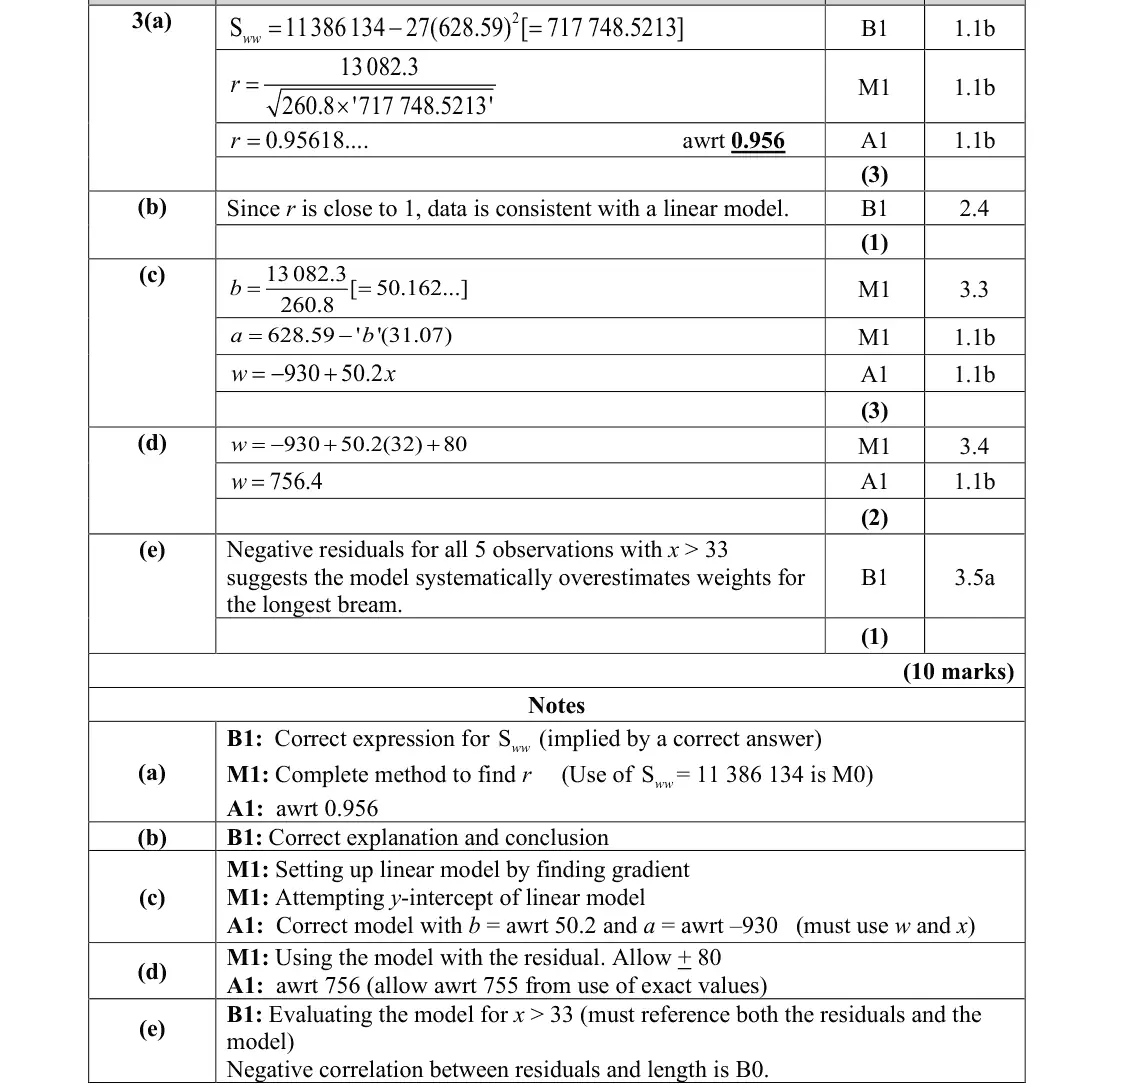
June 2025 · AS Paper 2 (Further Statistics 2) · Q3(a)1 mark
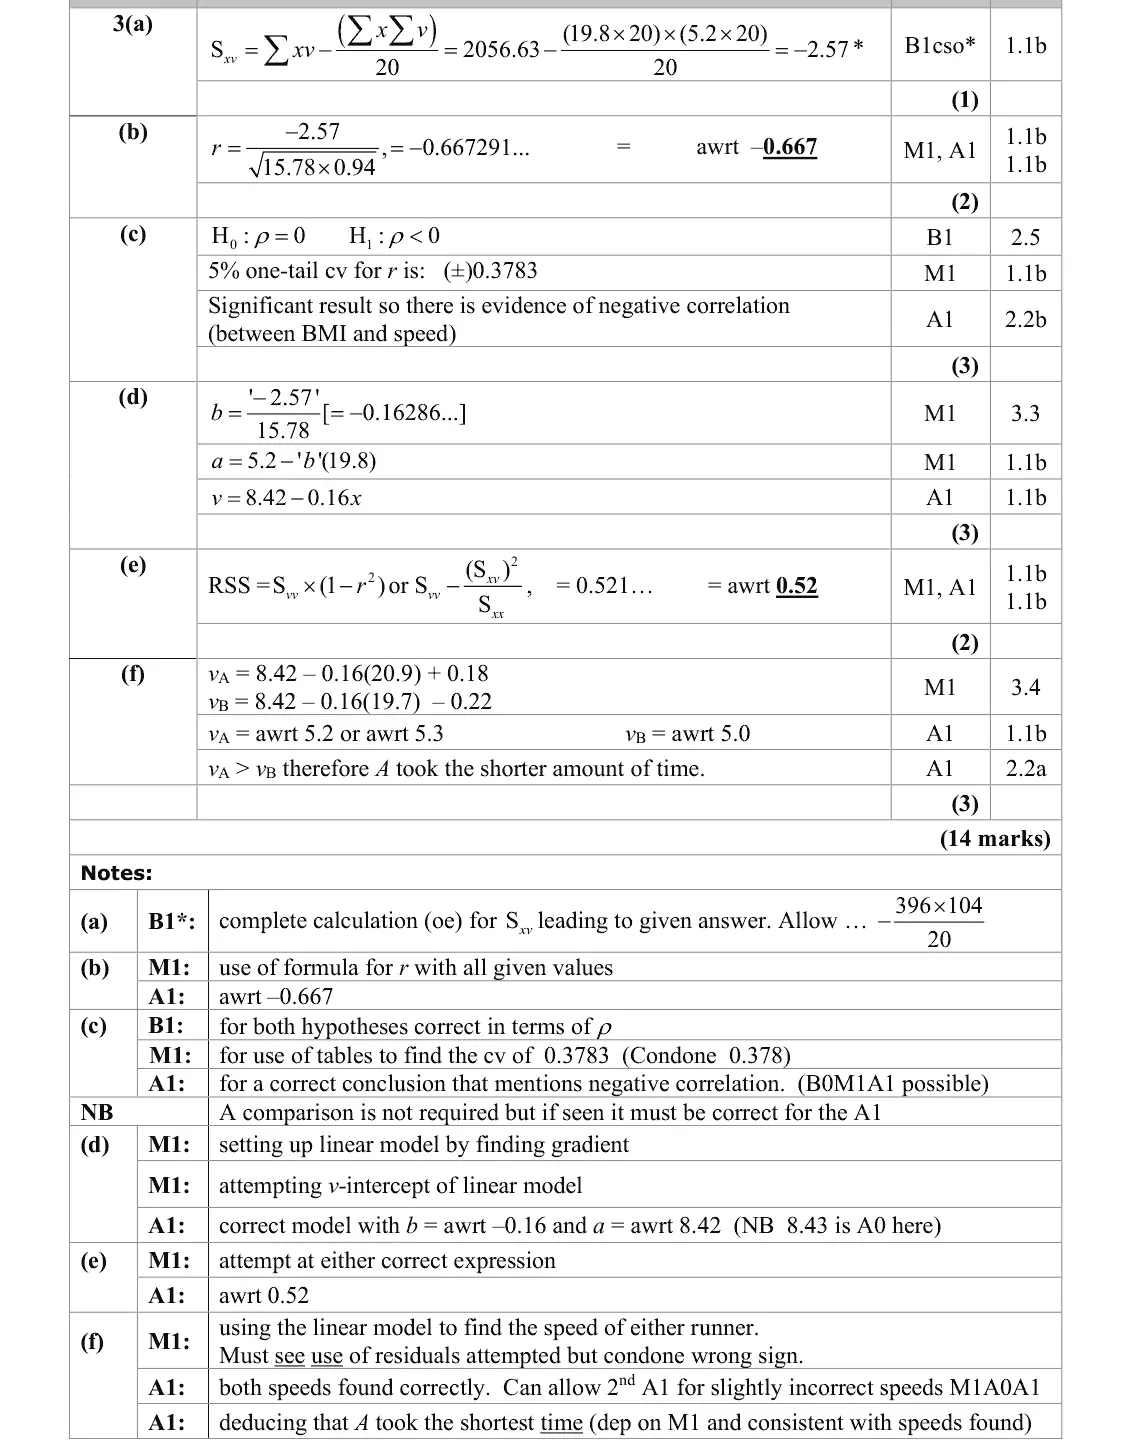
Mark scheme (whole question; this part is marked with the orange bar)
Examiner's comment
This question was answered well by virtually all the learners. In part (a) very few learners failed to show us some working before arriving at the printed answer and most used this value, along with the other values in the question to complete part (b) correctly too.
Key points from the mark scheme and examiner's report
June 2025 · AS Paper 2 (Further Statistics 2) · Q3(b)2 marks
Mark scheme (whole question; this part is marked with the orange bar)
Examiner's comment
value, along with the other values in the question to complete part (b) correctly too. For the hypothesis test in part (c) some didn’t give their hypotheses in terms of ρ but very
Key points from the mark scheme and examiner's report
r = −2.57/√(15.78 × 0.94) = −0.667
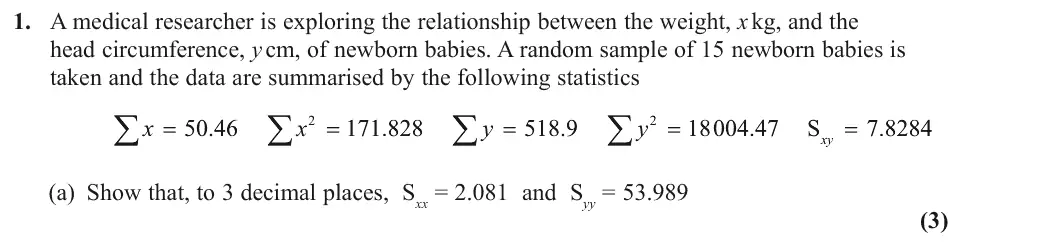
June 2025 · Paper 4B (Further Statistics 2) · Q1(a)3 marks
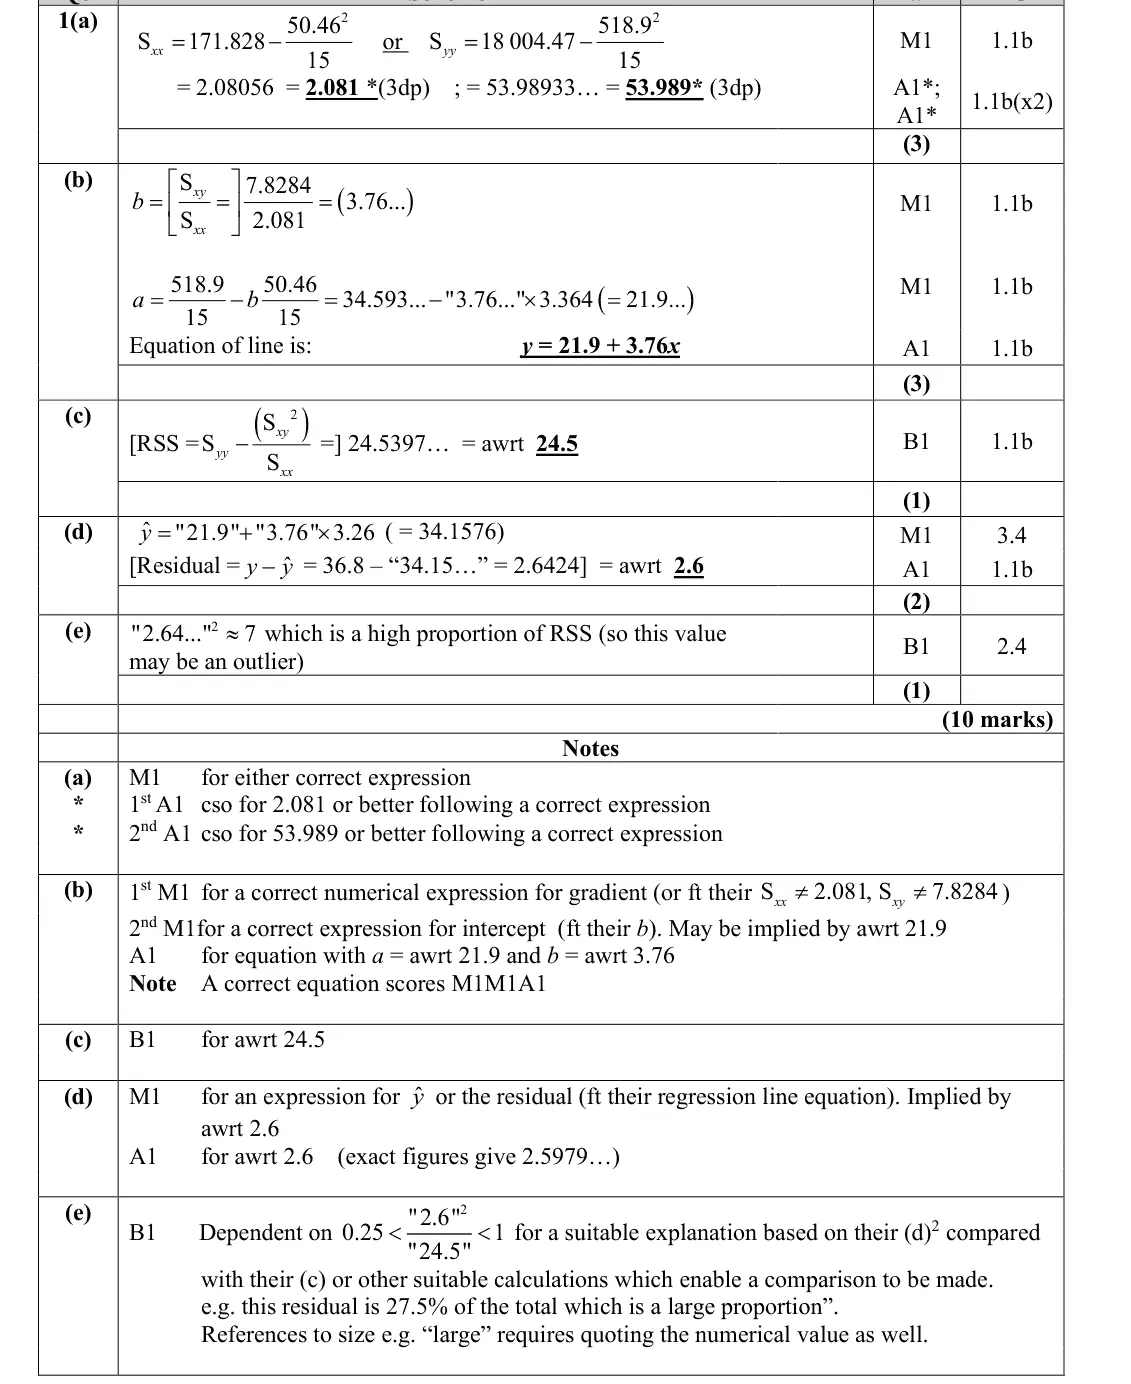
Mark scheme (whole question; this part is marked with the orange bar)
Examiner's comment
This opening question on the topic of linear regression was a good opening question for candidates with many scoring the majority of the marks. In part (a), most candidates were able to show the two required answers, although frustratingly some candidates miscopied the value from their calculator or they missed the squared off the calculation which cost them a mark.
Key points from the mark scheme and examiner's report
Sxx = 171.828 − 50.46²/15 = 2.08056 and Syy = 18004.47 − 518.9²/15 = 53.98933
show more than 3 d.p. before rounding
miscopying or dropping the square cost marks
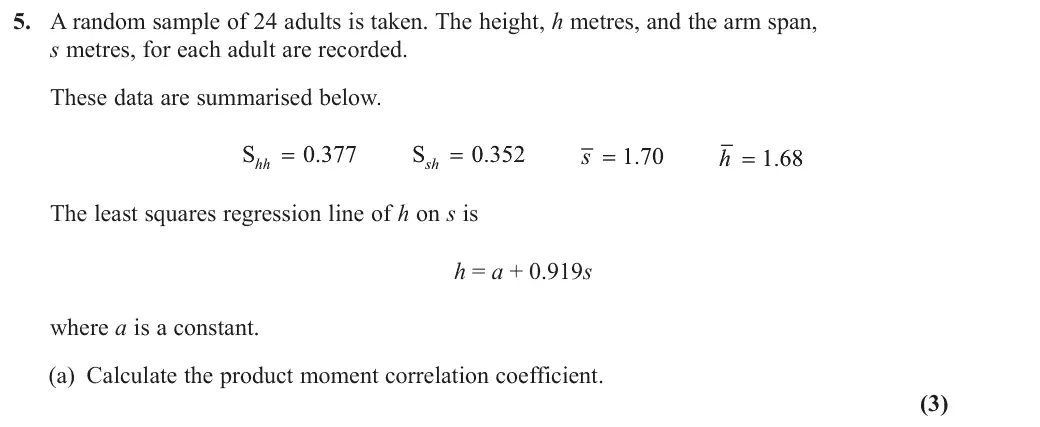
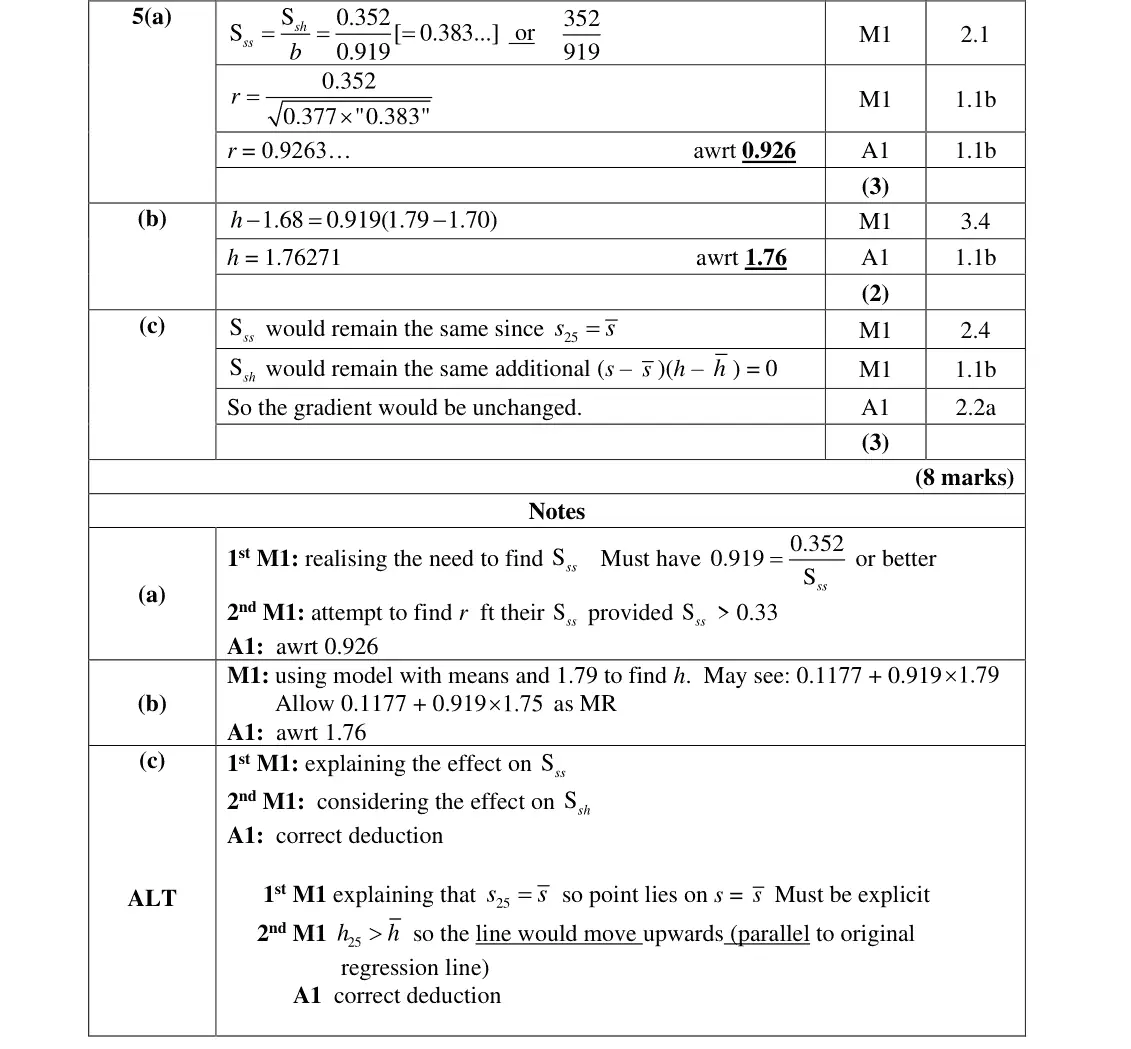
June 2024 · AS Paper 2 (Further Statistics 2) · Q5(a)3 marks
Mark scheme (whole question; this part is marked with the orange bar)
Examiner's comment
In part (a) most knew that they needed to find Sss and usually they realised this could be found using the gradient of the regression line. The correct value for r normally followed.
Key points from the mark scheme and examiner's report
use the gradient b = Ssh/Sss to get Sss = 0.352/0.919 = 0.383
r = 0.352/√(0.377 × 0.383) = 0.926
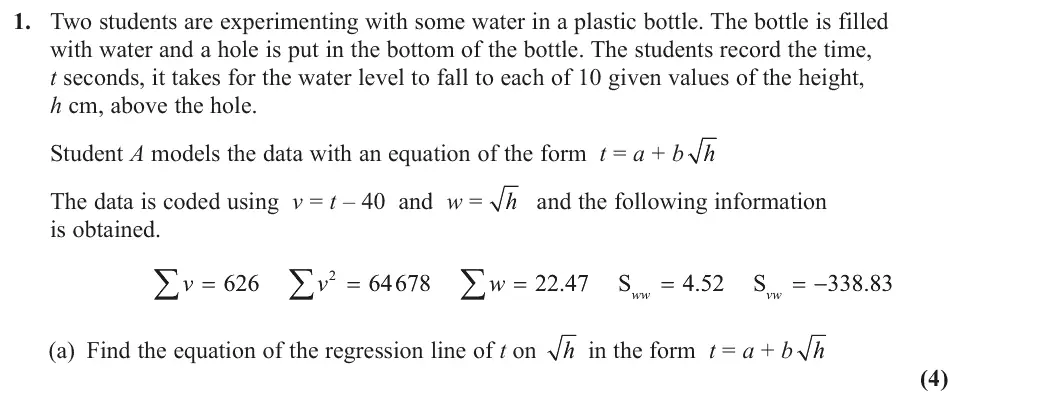
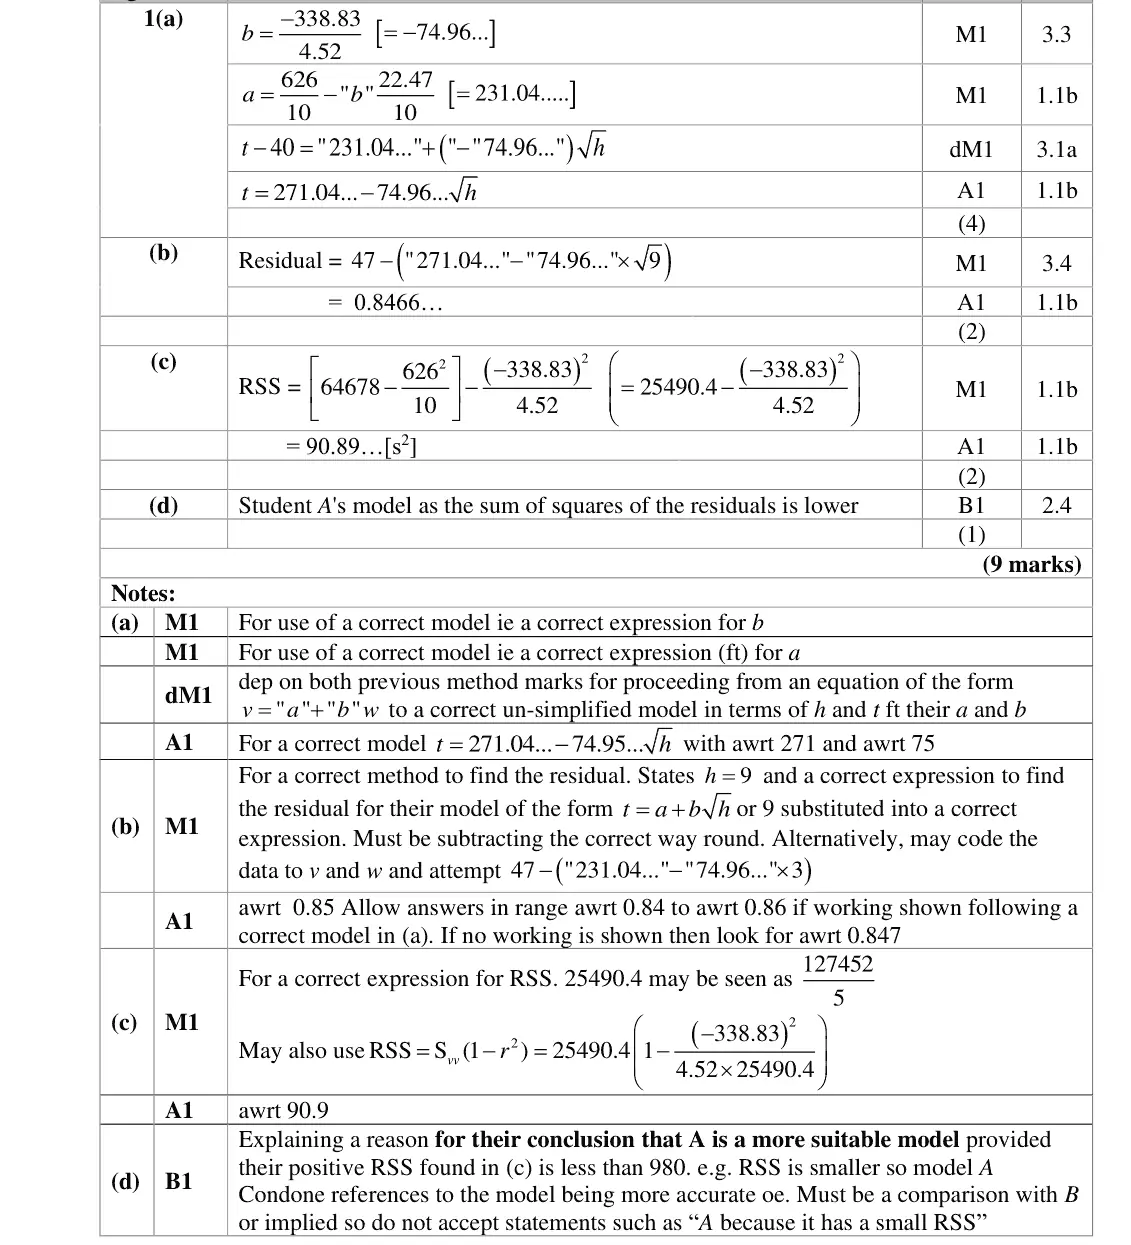
June 2024 · Paper 4B (Further Statistics 2) · Q1(a)4 marks
Mark scheme (whole question; this part is marked with the orange bar)
Examiner's comment
This opening question on the topic of linear regression brought more challenge than expected for some candidates. In part (a) candidates were required to find the regression line h on t having been given coded data in the form of two other variables, v and w. Whilst the majority of candidates made good progress on most of this question, with parts (a) and (c) the most commonly fully correct, there were some who got mixed up with the variables and attempted to find the line h on t. the coefficients obtained in part (a), and some compounded their error by failing to show full workings for finding the residual, and also lost the method mark. Some candidates showed their workings clearly but subtracted the wrong way round for the residual so gained no credit. Many of the candidates who were successful with (c) also went on to make, and adequately justify, the correct decision in (d).
Key points from the mark scheme and examiner's report
coded regression v on w: b = Svw/Sww = −74.96, a = v̄ − b w̄ = 231.04
decode v = t − 40, w = √h: t = 271.04 − 74.96√h
some found the line the wrong way round (h on t)
June 2024 · Paper 4B (Further Statistics 2) · Q1(c)2 marks
Mark scheme (whole question; this part is marked with the orange bar)
Examiner's comment
This opening question on the topic of linear regression brought more challenge than expected of candidates made good progress on most of this question, with parts (a) and (c) the most commonly fully correct, there were some who got mixed up with the variables and attempted to find the line h on t.
Key points from the mark scheme and examiner's report
Svv = 64678 − 626²/10 = 25490.4
RSS = Svv − Svw²/Sww = 90.9
June 2023 · AS Paper 2 (Further Statistics 2) · Q3(a)2 marks
Mark scheme (whole question; this part is marked with the orange bar)
Examiner's comment
Part (a) was answered very well and almost all students scored both marks here. The responses to part (b) were more mixed. Many stated that it was consistent because the
Key points from the mark scheme and examiner's report
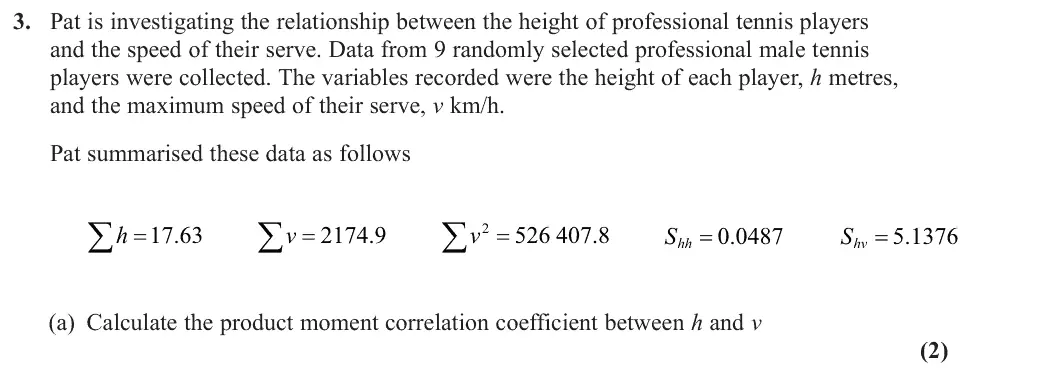
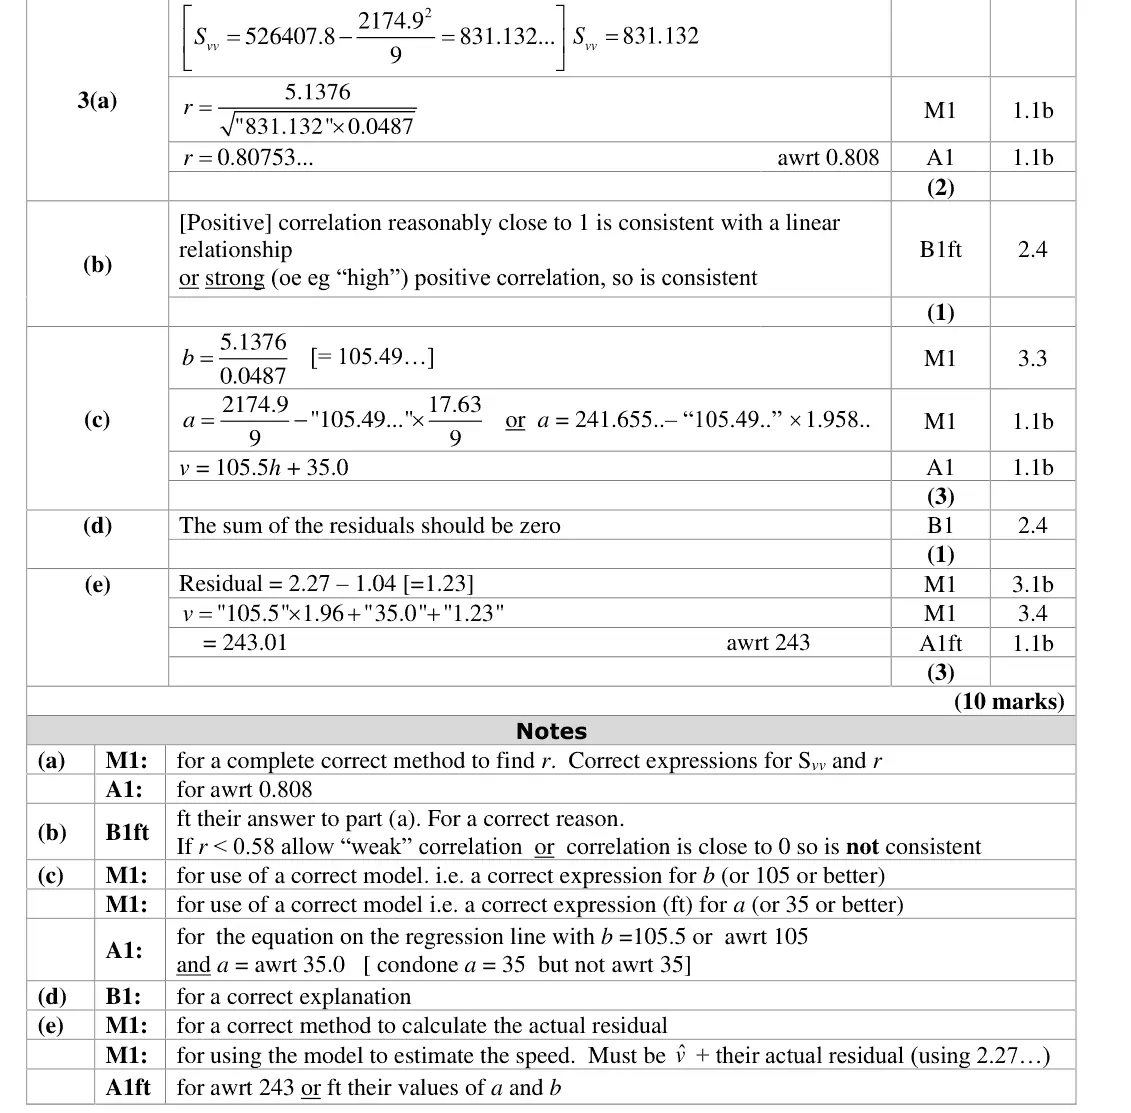
Svv = 526 407.8 − 2174.9²/9 = 831.13
r = 0.808
June 2023 · AS Paper 2 (Further Statistics 2) · Q3(b)1 mark
Mark scheme (whole question; this part is marked with the orange bar)
Examiner's comment
responses to part (b) were more mixed. Many stated that it was consistent because the value of r was “close to 1” or represented “strong” positive correlation. Some weaker students thought that because the value of r was between 1 and – 1 that represented suitable evidence. The calculations in part (c) were usually correct with only a handful
Key points from the mark scheme and examiner's report
strong positive correlation, reasonably close to 1, so consistent with a linear model
"r is between −1 and 1" is not a reason
June 2023 · Paper 4B (Further Statistics 2) · Q1(a)2 marks
Mark scheme (whole question; this part is marked with the orange bar)
Examiner's comment
This was a generally welcoming first question as the first six marks were procedural and very straightforward, allowing candidates a gentle introduction to the paper. Parts (a) and (b) were almost always done correctly. Many candidates subtracted the real and estimated value backwards to obtain a positive residual in
Key points from the mark scheme and examiner's report
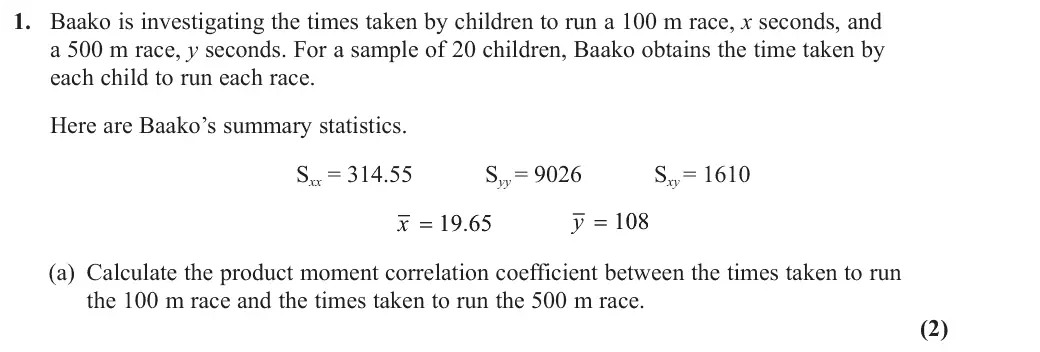
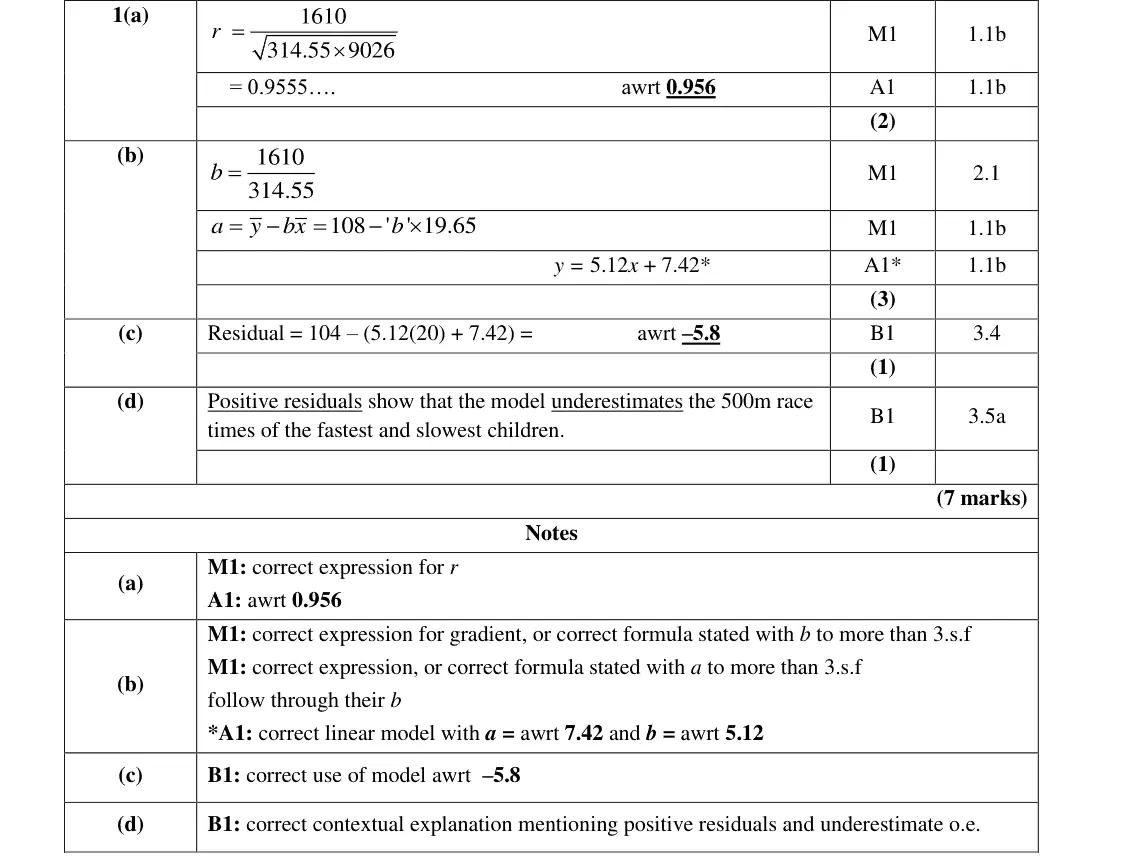
r = 1610/√(314.55 × 9026) = 0.956
June 2022 · AS Paper 2 (Further Statistics 2) · Q3(a)3 marks
Mark scheme (whole question; this part is marked with the orange bar)
Examiner's comment
Part (a) of question three proved to be the most accessible part of the paper with the majority of candidates gaining full marks.
Key points from the mark scheme and examiner's report
Sww = Σw² − 27(w̄)² = 717 748.5
r = 0.956
using Σw² as Sww scores M0
June 2022 · AS Paper 2 (Further Statistics 2) · Q3(b)1 mark
Mark scheme (whole question; this part is marked with the orange bar)
Examiner's comment
In part (b), the vast majority of candidates stated that since r was close to 1, the data was consistent with a linear model. A few just stated there was positive correlation, but this was not sufficient.
Key points from the mark scheme and examiner's report
r close to 1 so consistent with a linear model
"positive correlation" alone not enough
June 2022 · Paper 4B (Further Statistics 2) · Q1(c)2 marks
Mark scheme (whole question; this part is marked with the orange bar)
Examiner's comment
This question proved to be an accessible start for virtually all candidates. Nearly all made a Part (c) was again well attempted, though many lengthy attempts were seen at calculating the product moment correlation coefficient when candidates should have realised that they had all of the information to complete it in one step. It was not uncommon to see 2 significant figure answers given rather than 3 as instructed on the front cover of the examination paper.
Key points from the mark scheme and examiner's report
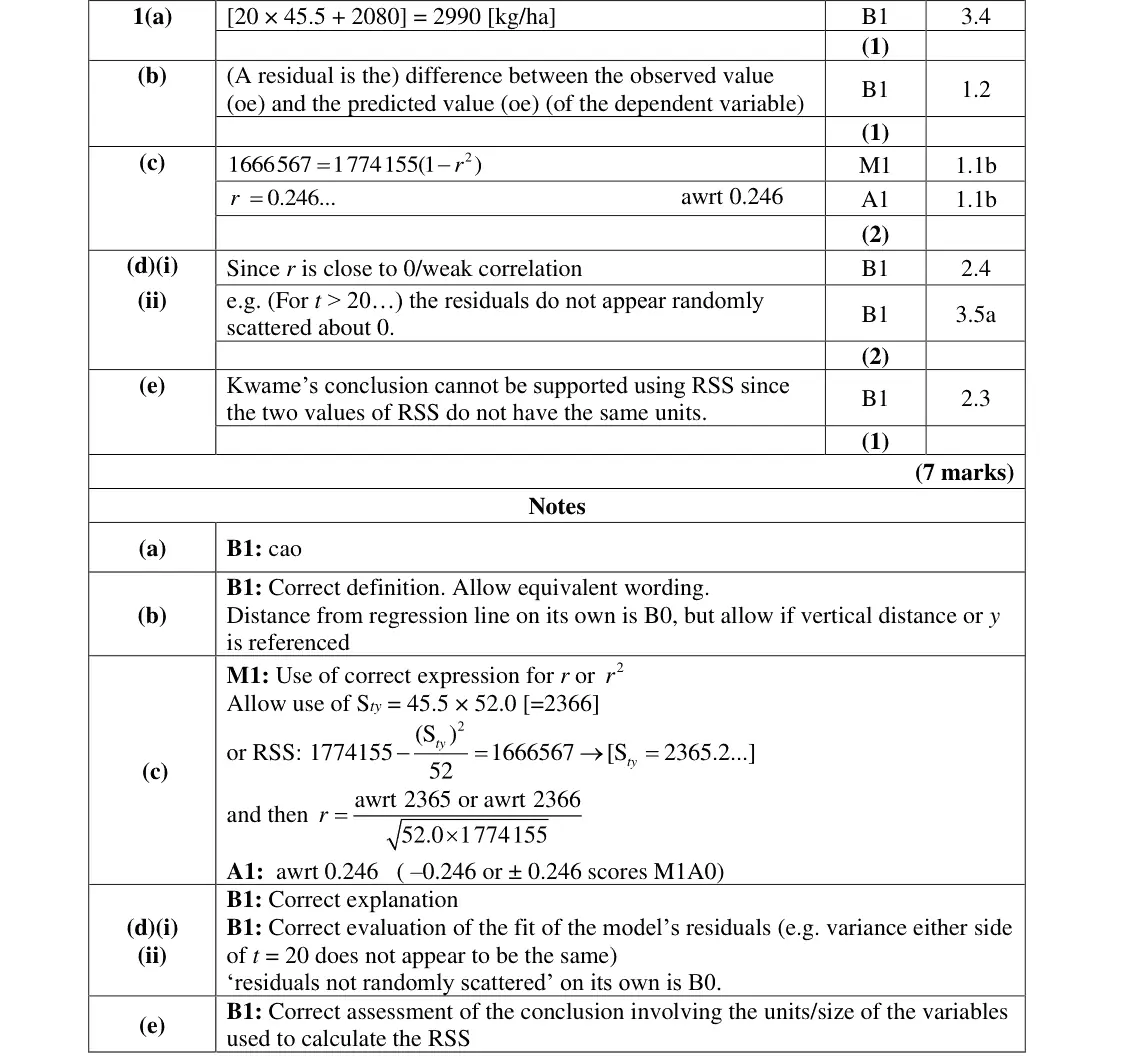
RSS = Syy(1 − r²) gives r = 0.246 in one step (or Sty = 45.5 × 52)
many took lengthy routes
give 3 s.f.
−0.246 scores M1A0
June 2022 · Paper 4B (Further Statistics 2) · Q1(d)2 marks
Mark scheme (whole question; this part is marked with the orange bar)
Examiner's comment
This question proved to be an accessible start for virtually all candidates. Nearly all made a (d)(i) was well accessed with most stating that there was weak correlation. Stating that the value of r was far from one was insufficient as candidates needed to make it clear that it is the proximity to 0 that makes it weak. Candidates struggled more in part (ii) to clearly express themselves, though a number of candidates did correctly identify that for values of t > 20 the residuals were no longer randomly scattered about 0.
Key points from the mark scheme and examiner's report
(i) r is close to 0, weak correlation ('far from 1' not enough)
(ii) for t > 20 the residuals are not randomly scattered about 0 / show a pattern
'not randomly scattered' alone scores 0
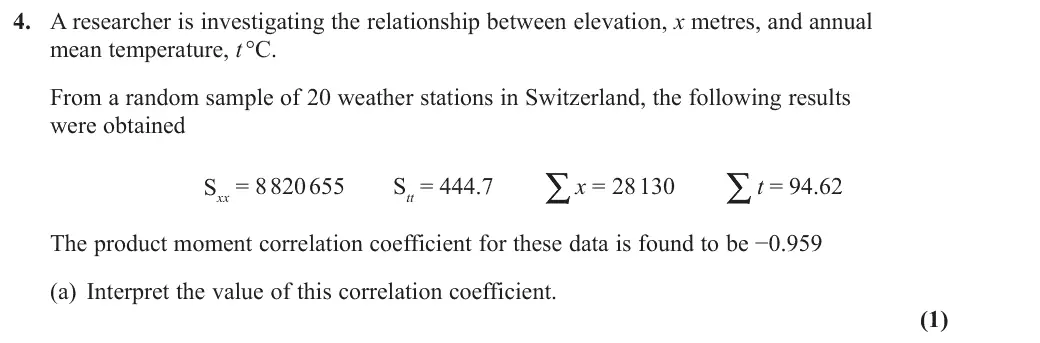
Nov 2021 · Paper 4B (Further Statistics 2) · Q4(a)1 mark
Mark scheme (whole question; this part is marked with the orange bar)
Key points from the mark scheme and examiner's report
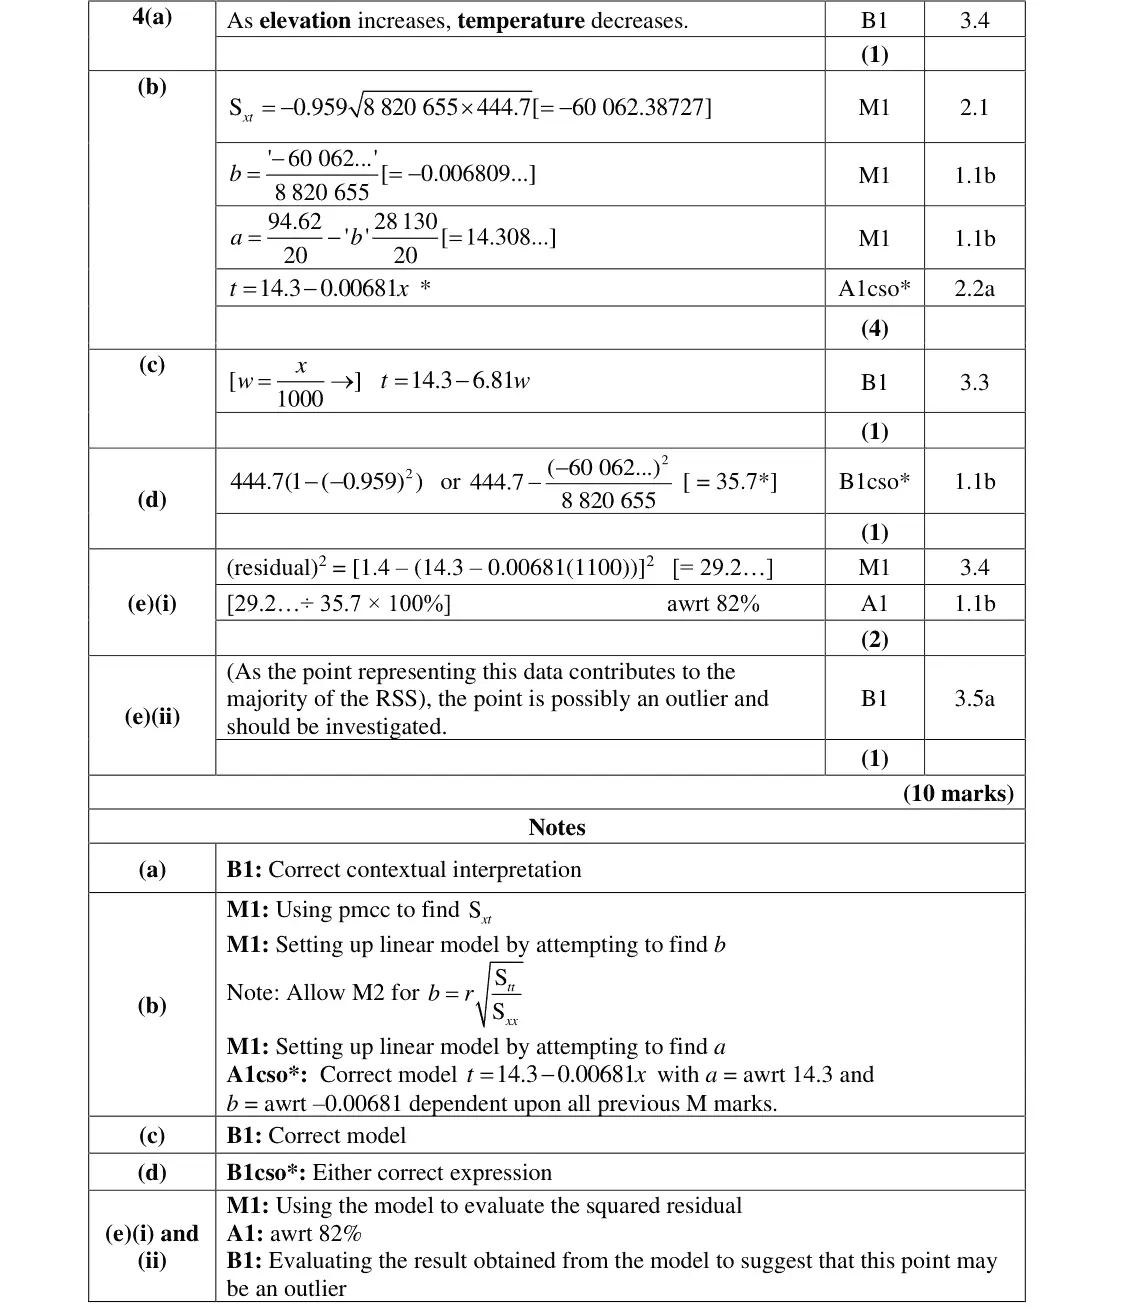
contextual: as elevation increases, temperature decreases (strong negative linear correlation)
Nov 2021 · Paper 4B (Further Statistics 2) · Q4(b)4 marks
Mark scheme (whole question; this part is marked with the orange bar)
Key points from the mark scheme and examiner's report
Sxt = r√(Sxx Stt) = −60062
b = Sxt/Sxx = −0.006809, a = t̄ − b x̄ = 14.308
printed answer t = 14.3 − 0.00681x so all steps shown
Nov 2021 · Paper 4B (Further Statistics 2) · Q4(c)1 mark
Mark scheme (whole question; this part is marked with the orange bar)
Key points from the mark scheme and examiner's report
x = 1000w so t = 14.3 − 6.81w (coding)
June 2019 · AS Paper 2 (Further Statistics 2) · Q3(a)2 marks
Mark scheme (whole question; this part is marked with the orange bar)
Examiner's comment
Part (a) of question three proved to be the most accessible part of the paper with the majority of candidates gaining full marks. In part (b) whilst most candidates realised that the product moment correlation coefficient would be the same as part (a) a minority of candidates either forgot or were unable to give a suitable reason. The nearly all candidates were able to gain some marks in part (c) with those using the
Key points from the mark scheme and examiner's report
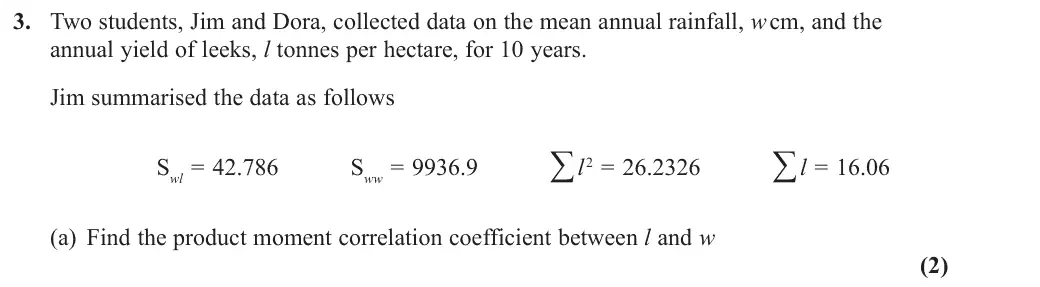
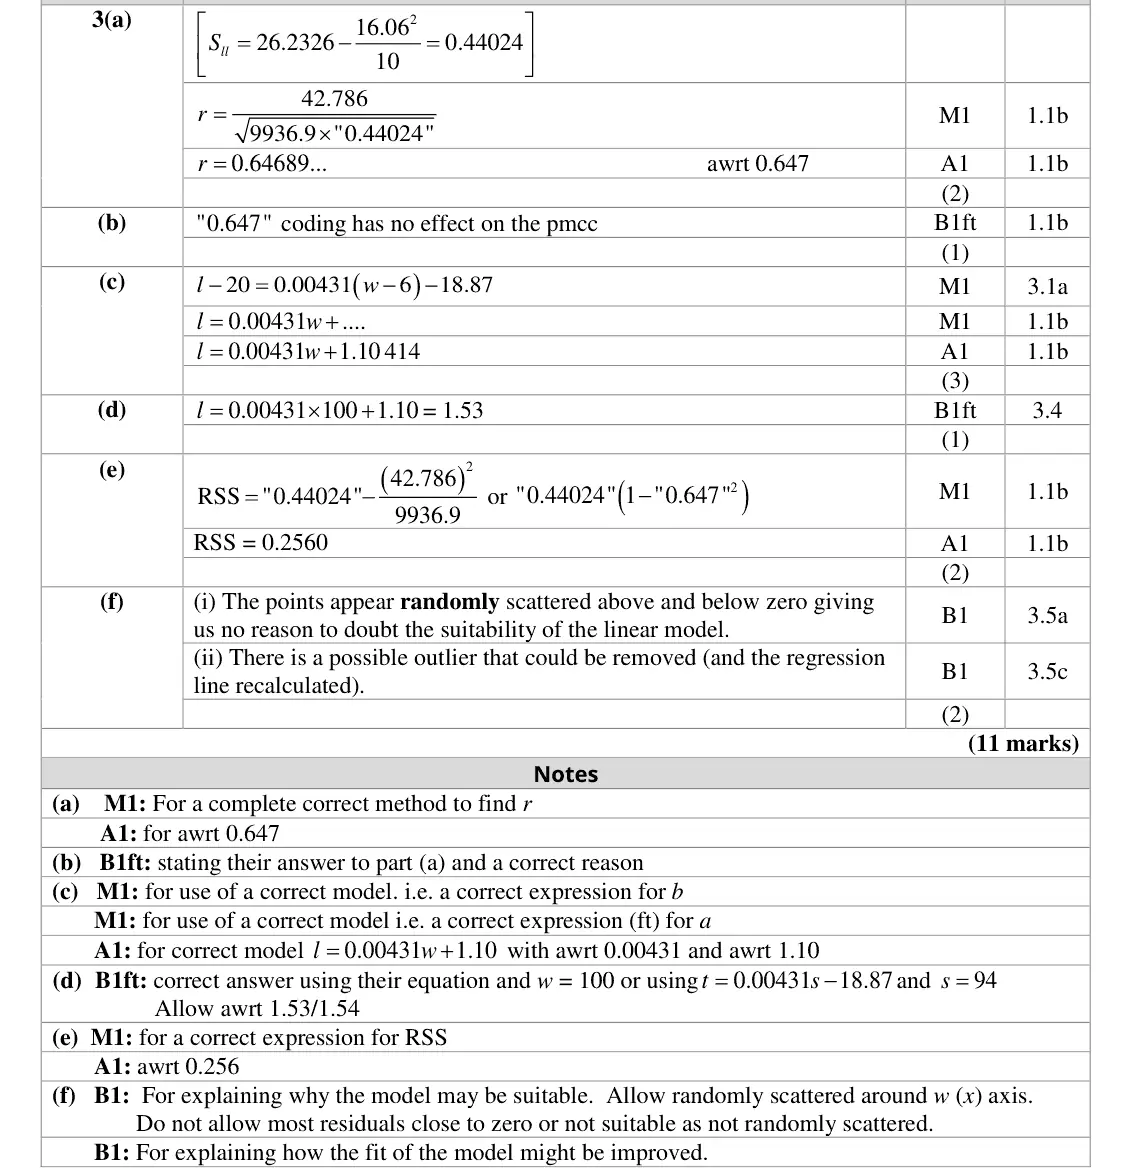
Sll = 26.2326 − 16.06²/10 = 0.44024
r = 0.647
well answered
June 2019 · AS Paper 2 (Further Statistics 2) · Q3(b)1 mark
Mark scheme (whole question; this part is marked with the orange bar)
Examiner's comment
of candidates gaining full marks. In part (b) whilst most candidates realised that the product moment correlation coefficient would be the same as part (a) a minority of candidates either
Key points from the mark scheme and examiner's report
0.647 (same as (a)) because linear coding does not affect the pmcc
reason often missing
June 2019 · AS Paper 2 (Further Statistics 2) · Q3(c)3 marks
Mark scheme (whole question; this part is marked with the orange bar)
Examiner's comment
The nearly all candidates were able to gain some marks in part (c) with those using the method given in the mark scheme gaining full marks. The most commonly used alternative method was to go back to the original summary data to find the value of b and then use a particular value for s to try and find the value of a. This was a rather long winded and generally unsuccessful.
Key points from the mark scheme and examiner's report
substitute s = w − 6, t = l − 20 into Dora's line: l = 0.00431w + 1.10
recalculating from the summary data was long and usually unsuccessful
June 2019 · Paper 4B (Further Statistics 2) · Q2(a)2 marks
Mark scheme (whole question; this part is marked with the orange bar)
Examiner's comment
This question was well answered with the majority of candidates gaining the marks in the first four parts.
Key points from the mark scheme and examiner's report
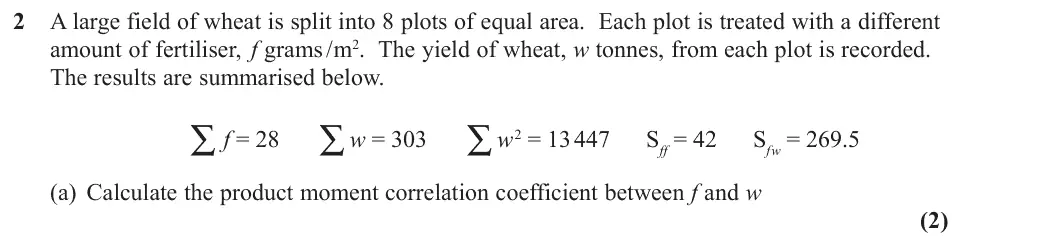
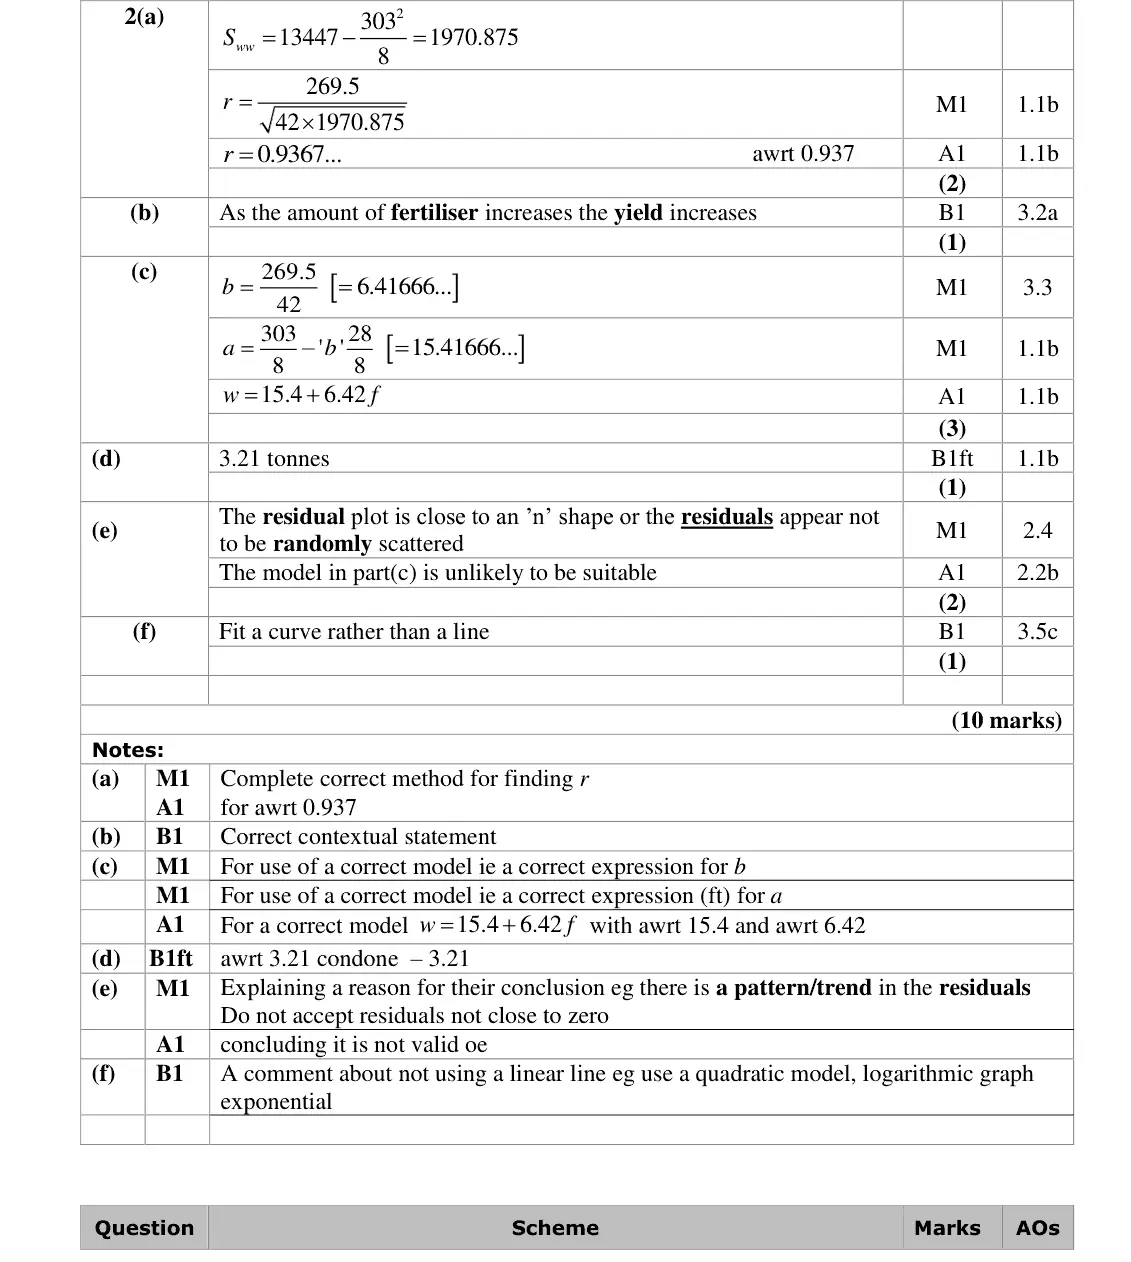
Sww = 13447 − 303²/8 = 1970.875
r = 269.5/√(42 × 1970.875) = 0.937
June 2019 · Paper 4B (Further Statistics 2) · Q2(b)1 mark
Mark scheme (whole question; this part is marked with the orange bar)
Examiner's comment
This question was well answered with the majority of candidates gaining the marks in the first four parts.
Key points from the mark scheme and examiner's report
contextual: as the amount of fertiliser increases the yield increases
June 2018 · AS Paper 2 (Further Statistics 2) · Q1(a)2 marks
Mark scheme (whole question; this part is marked with the orange bar)
Examiner's comment
Virtually all students made a good start to the paper in part (a) by being able to use the given formulae to obtain the product moment correlation coefficient. Answers should be given to at least 3 significant figure accuracy (although here 0.97 was allowed following correct working).
Key points from the mark scheme and examiner's report
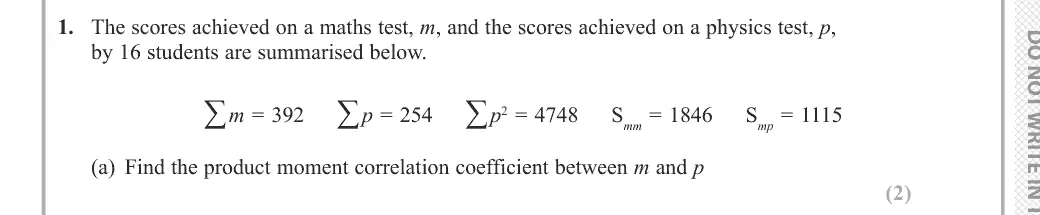
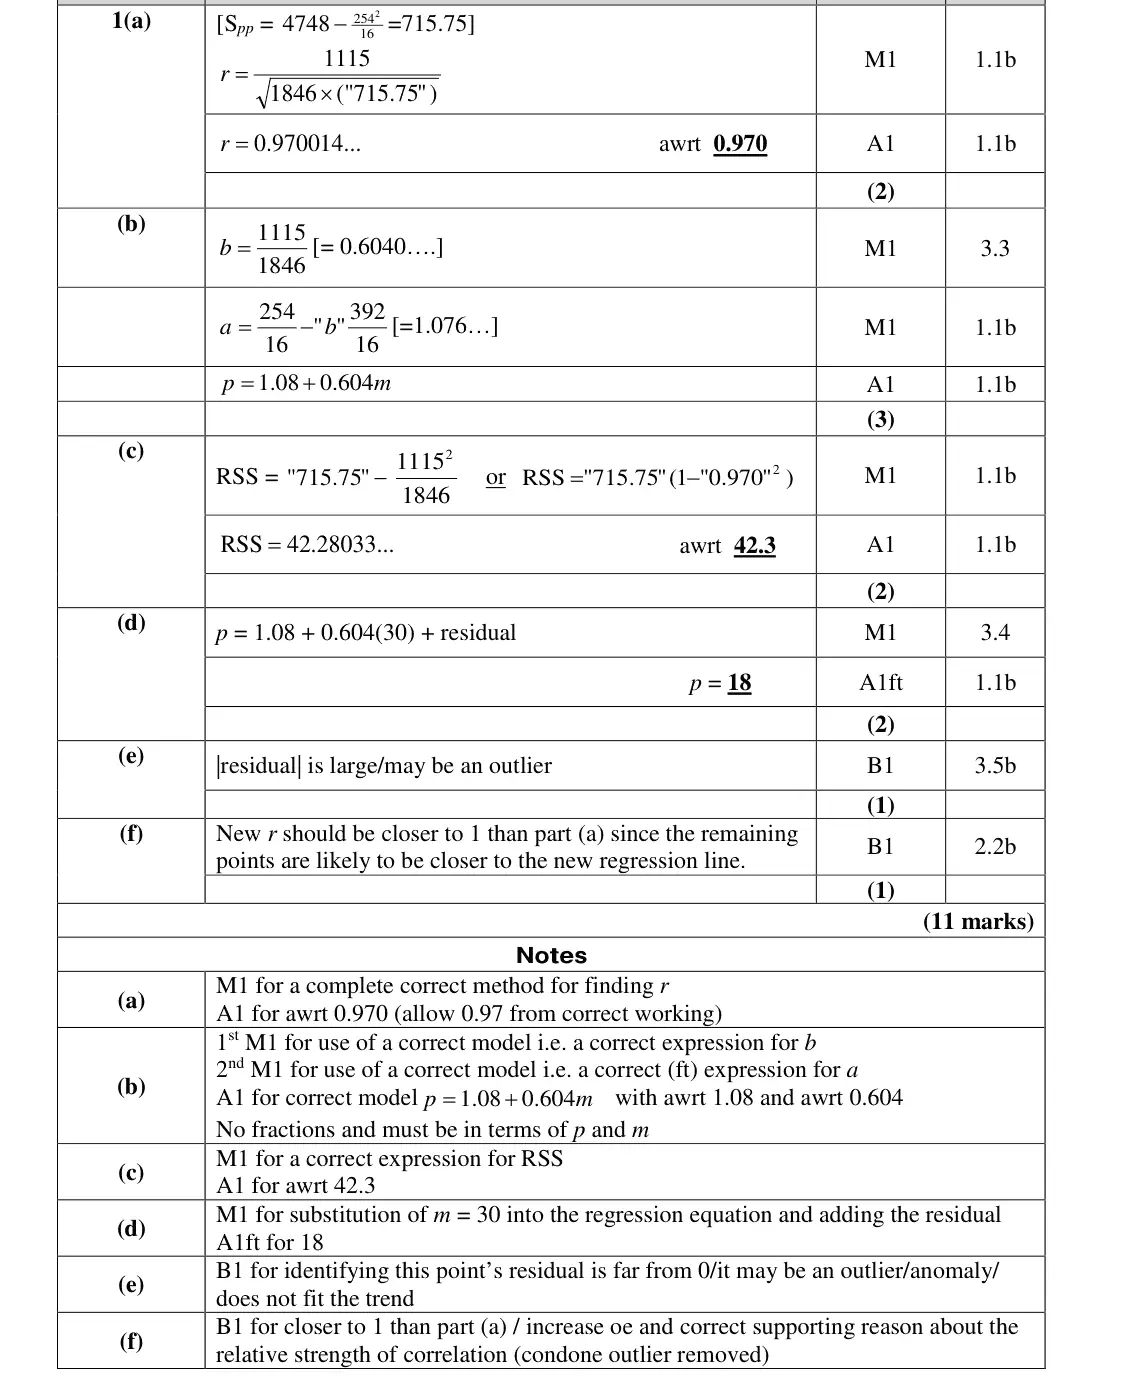
find Spp = 715.75 first
r = Smp/√(Smm Spp) = 0.970
give at least 3 s.f.
June 2018 · AS Paper 2 (Further Statistics 2) · Q1(f)1 mark
Mark scheme (whole question; this part is marked with the orange bar)
Examiner's comment
was to identify it as being an outlier. Part (f) was less successfully answered as it required both a statement about the relative size of the correlation coefficient and a correct supporting reason. Though some were able to identify that the new r would be closer to 1, many did not sufficiently justify why this was the case.
Key points from the mark scheme and examiner's report
r closer to 1 (increases) because the remaining points lie closer to a line
many gave the direction without a valid reason
June 2018 · AS Paper 2 (Further Statistics 2) · Q3(e)1 mark
Mark scheme (whole question; this part is marked with the orange bar)
Examiner's comment
This question was designed to test understanding of how to deal with tied ranks when calculating the Spearman’s rank correlation coefficient. It was clear that this is one aspect of not many correct responses seen in part (d). Likewise in part (e), students struggled to show they understood that the answers to parts (c) and (d) indicate that the results in high jump and
Key points from the mark scheme and examiner's report
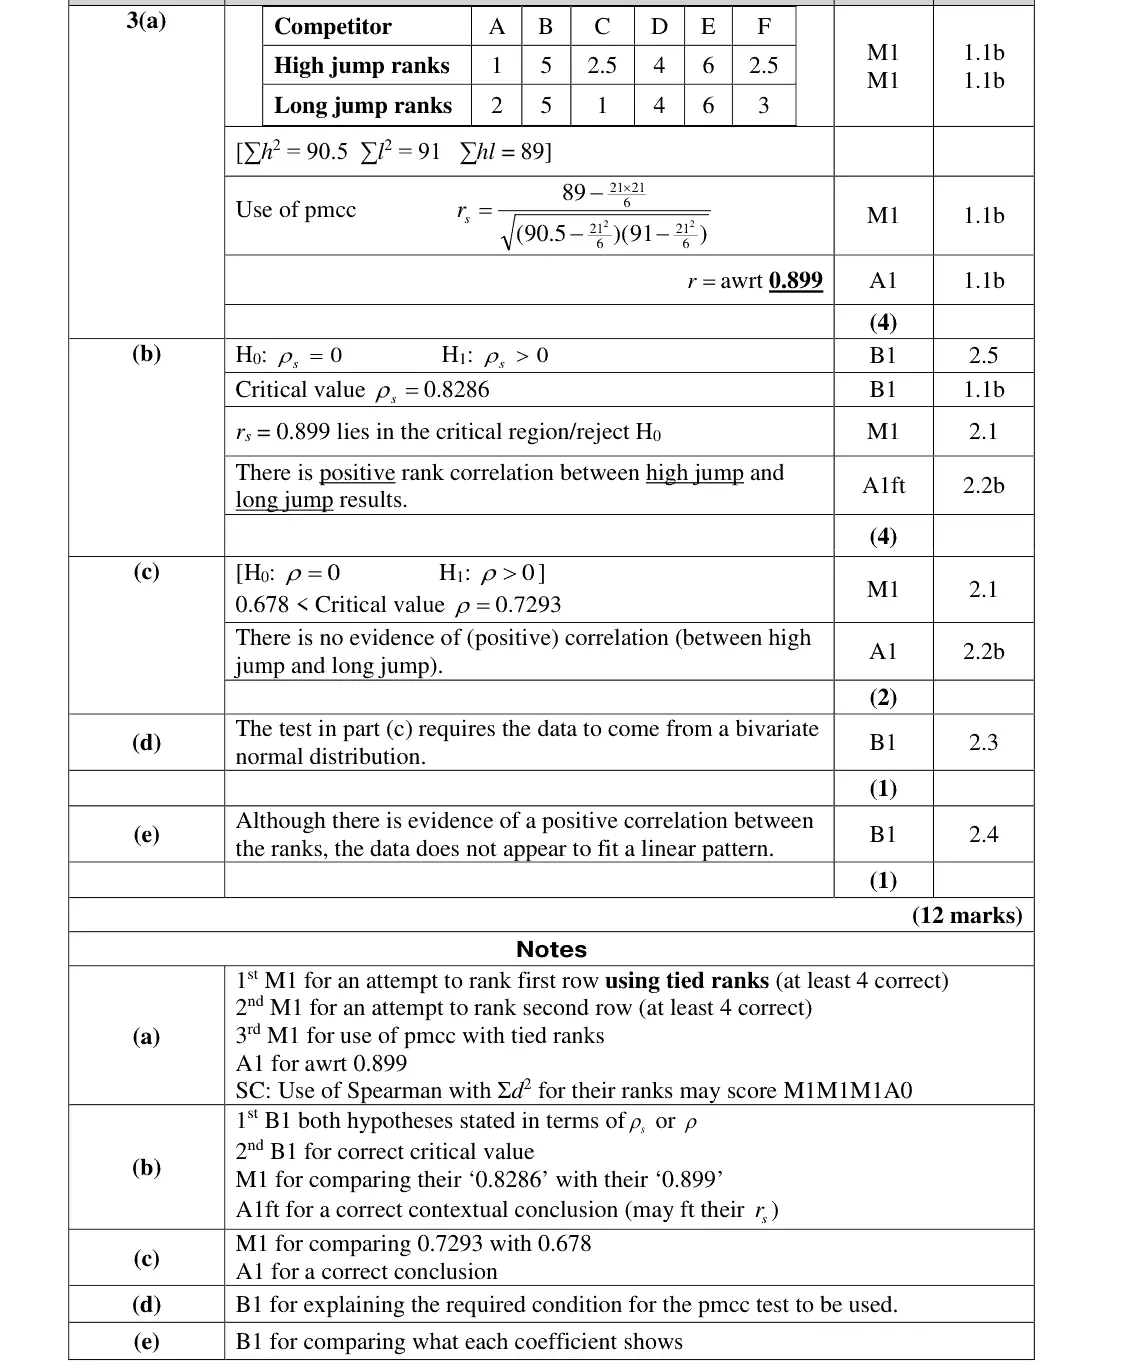
ranks agree but the relationship is not linear
few understood this
Find an Edexcel Further Maths tutor
Stuck on this? Book a trial lesson with our Further Maths tutor.