The binomial and Poisson cumulative tables are given.
Since 2018
19 question parts, 71 marks
Notes, worked examples and practice for this topic are being written by our tutors. The past-paper questions below are ready now: work each one on paper, then open the mark scheme and the examiner's comment.
Tap a question to zoom it. Mark scheme and examiner's comment open under each question.
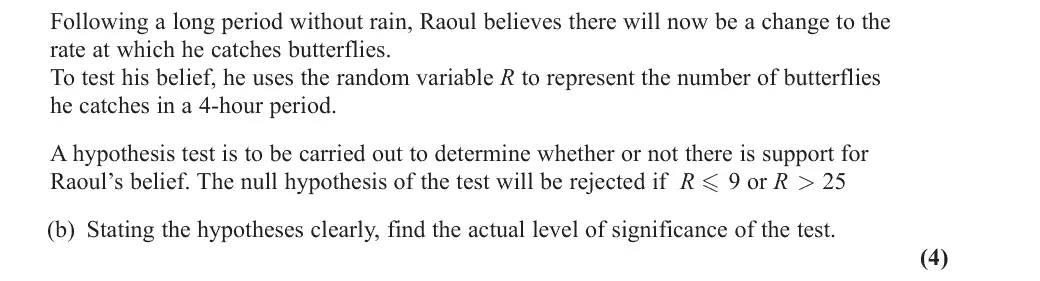
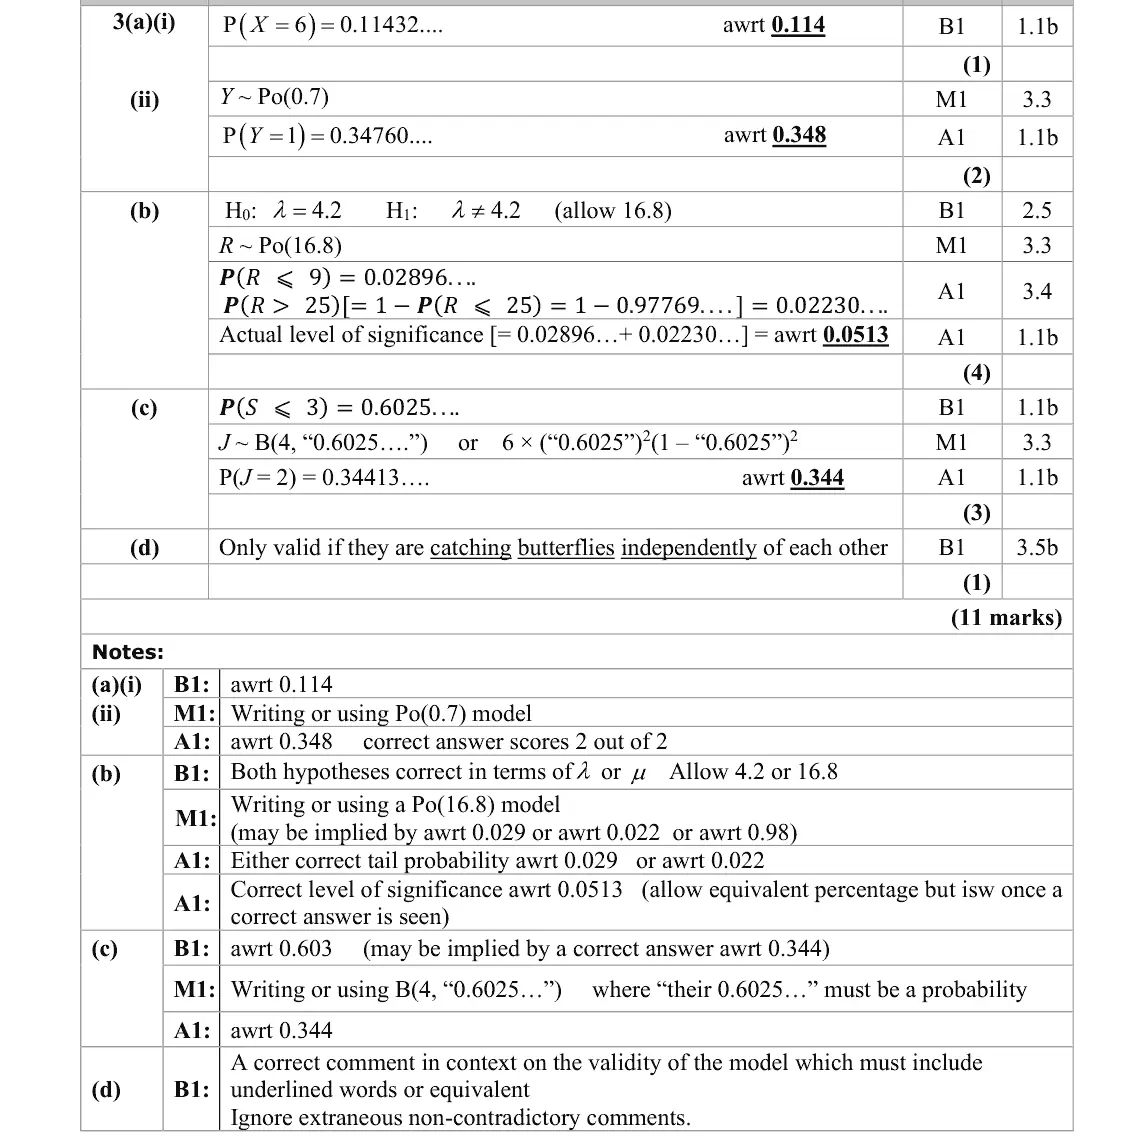
June 2025 · AS Paper 2 (Further Statistics 1) · Q3(b)4 marks
Mark scheme (whole question; this part is marked with the orange bar)
Examiner's comment
(b) In general, the hypotheses were stated with correct notation and in terms of λ. Nearly all identified the appropriate Poisson distribution in this part and most calculated a correct lower tail probability. Of those also finding a correct upper tail probability, some went on to approximate the actual level of significance and gave an answer of 5% or 6% rather than simply adding together the two tails.
Key points from the mark scheme and examiner's report
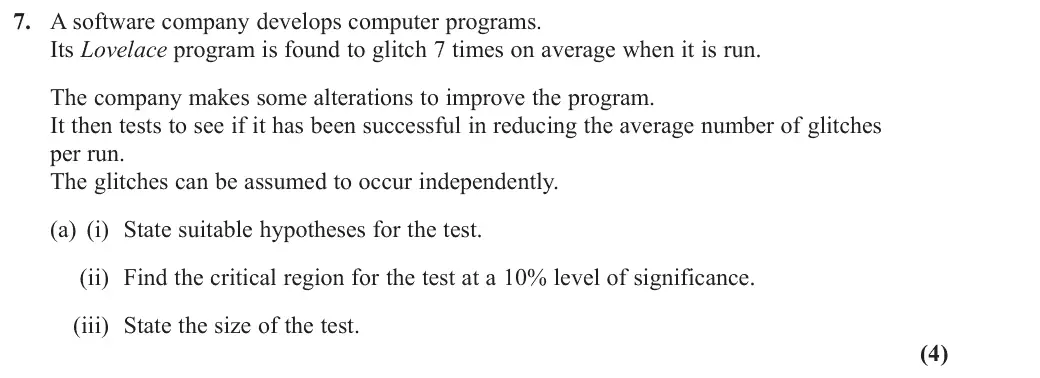
June 2025 · Paper 3B (Further Statistics 1) · Q7(a)4 marks
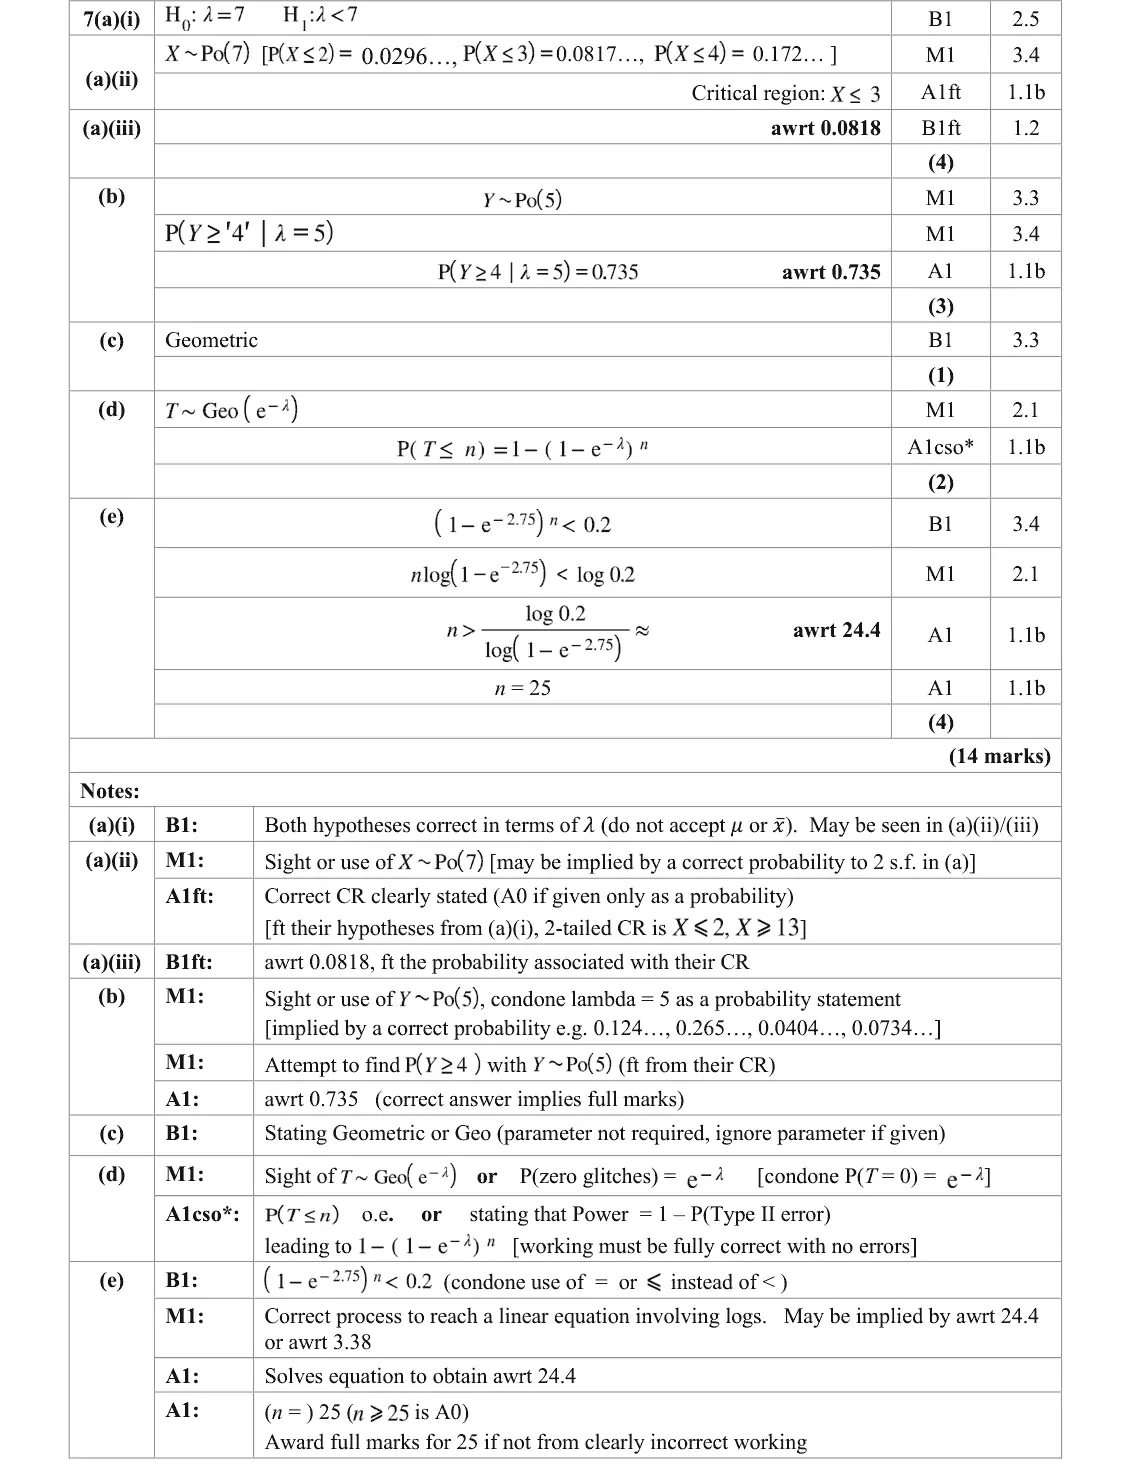
Mark scheme (whole question; this part is marked with the orange bar)
Examiner's comment
In general, candidates scored well in this question, with the exception of part (d), which was very challenging. The great majority of candidates gave the hypotheses in the required form in part (a)(i), although there were some which were expressed in words only. A very small minority a different symbol, which was not accepted for this part. Similarly, most candidates used the appropriate Poisson distribution and gave a correct critical region to score both marks in (a)(ii), with a small minority leaving it expressed within a probability statement, hence losing the final mark. In part (a)(iii) the correct size of the test was given by almost all candidates; there was occasionally a loss of accuracy.
Key points from the mark scheme and examiner's report
H0: λ = 7, H1: λ < 7
Po(7) CR X ≤ 3
size 0.0818
CR not as a probability statement
June 2024 · AS Paper 2 (Further Statistics 1) · Q2(d)4 marks
Mark scheme (whole question; this part is marked with the orange bar)
Examiner's comment
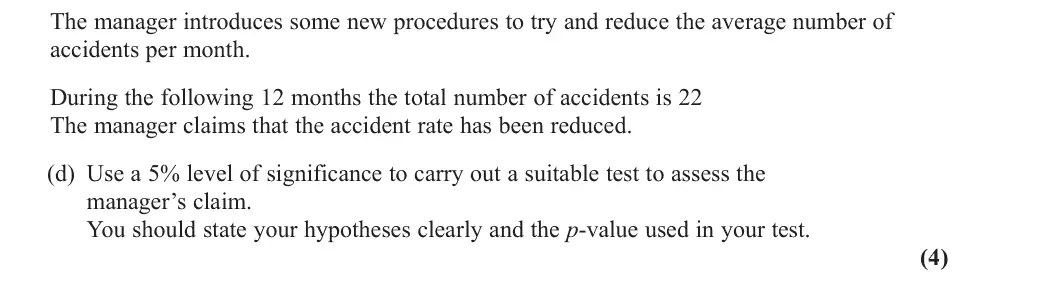
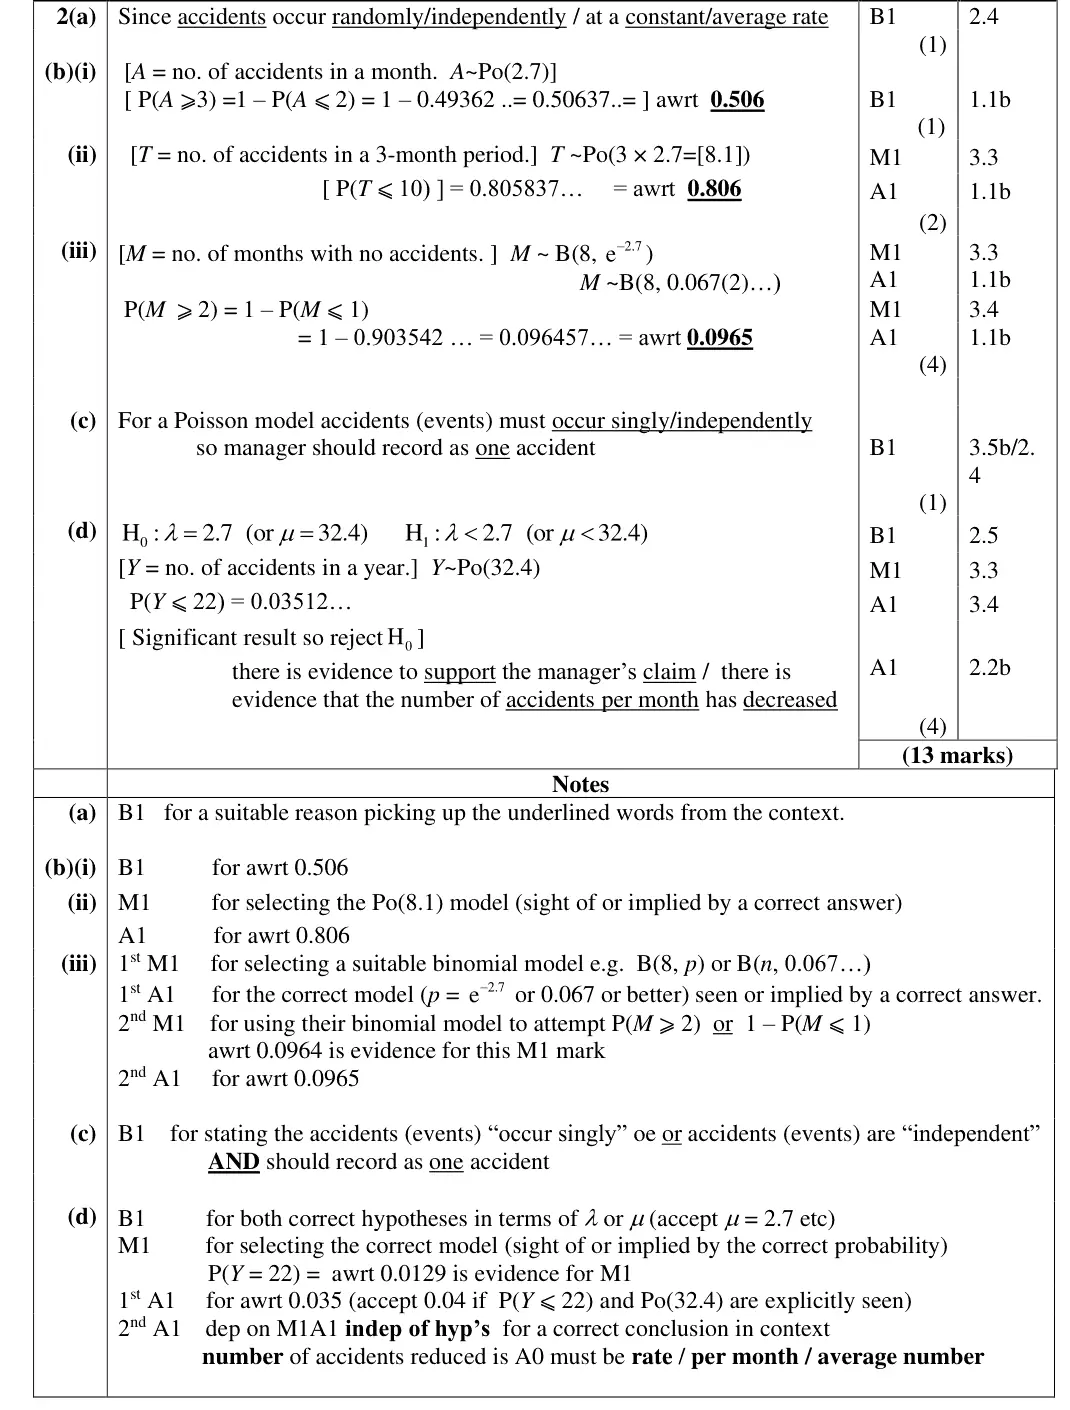
This question required students to give answers in context which they often find difficult. Finally, in part (d) the correct hypotheses with the required parameter stated were a common occurrence. A small number of students used p rather than λ or mu Most students were able to appreciate the requirement to calculate a p-value using P(X <= 22) but there are still students who are incorrectly calculating P(X = 22). Those students who used the given wording in the question were generally most successful. Far too many referred to the number of accidents reducing rather than it being the rate of accidents or number of accidents per month.
Key points from the mark scheme and examiner's report
H₀: λ = 2.7, H₁: λ < 2.7 (or μ = 32.4)
Y ~ Po(32.4)
p-value P(Y ≤ 22) = 0.0351 < 0.05, reject H₀: the accident rate (per month) has decreased
errors: P(Y = 22), using p, "number of accidents reduced"
June 2024 · Paper 3B (Further Statistics 1) · Q2(b)4 marks
Mark scheme (whole question; this part is marked with the orange bar)
Examiner's comment
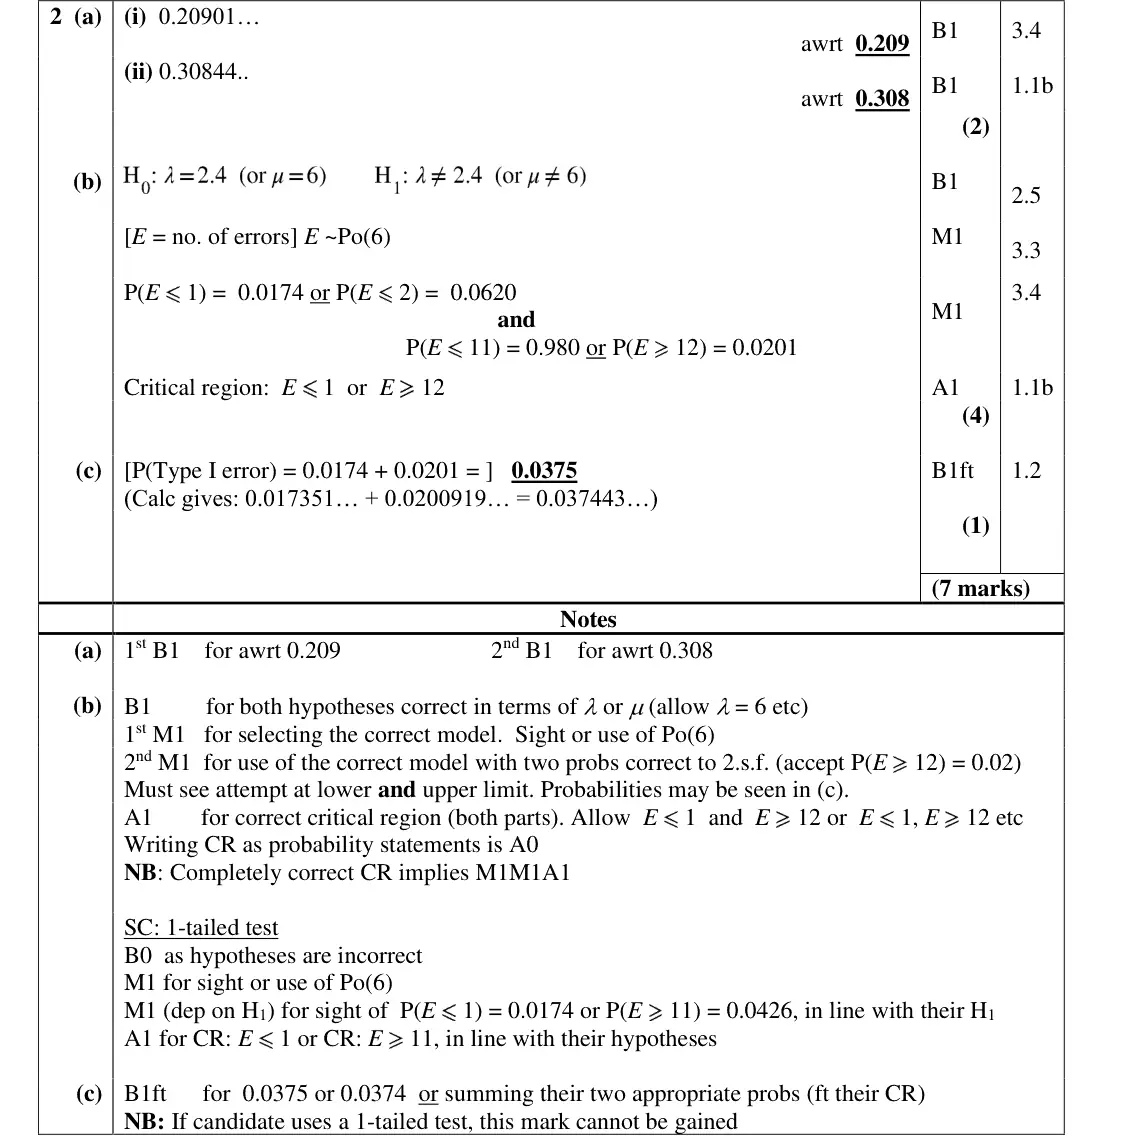
for part (b). Candidates understood how to state a distribution clearly, they tended to use good notation throughout. The only common exception to this was that many often did not connect the two pieces of their critical region properly. However, in many cases a less than precise presentation was condoned, and candidates did not lose marks for poor notation here. While poor notation was condoned here, candidates should aim to use rigorous notation when giving critical regions in general. Candidates appeared to know what was required for the P(Type I error), though some might have been making an educated guess that this was equivalent to the actual significance level – as this is a common thing to be asked to give after a hypothesis test such as this. Barely any candidates were unfamiliar with the methods required for this question. The discriminating factor tended to be the execution of these methods. To ensure full marks on questions such as these, candidates should be sure to retain a high level of accuracy in their tail probabilities, define their distribution clearly, show their working on the way to finding their critical values, and use rigorous notation throughout.
Key points from the mark scheme and examiner's report
H0: λ = 2.4, H1: λ ≠ 2.4 per 100 words
Po(6) for 250 words
two-tailed CR E ≤ 1 (0.0174) or E ≥ 12 (0.0201)
CR must not be written as probability statements
join the two tails properly
June 2024 · Paper 3B (Further Statistics 1) · Q4(d)4 marks
Mark scheme (whole question; this part is marked with the orange bar)
Examiner's comment
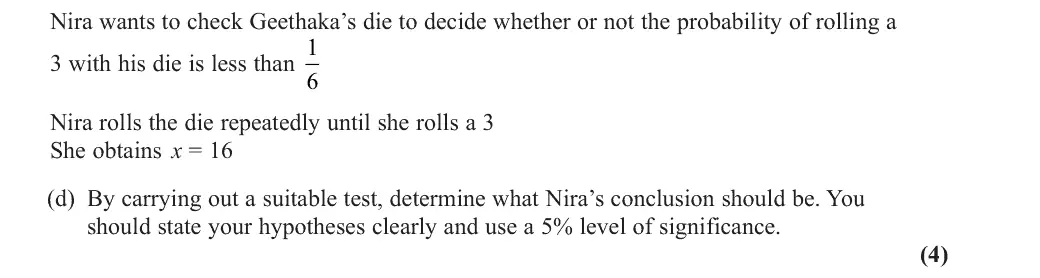
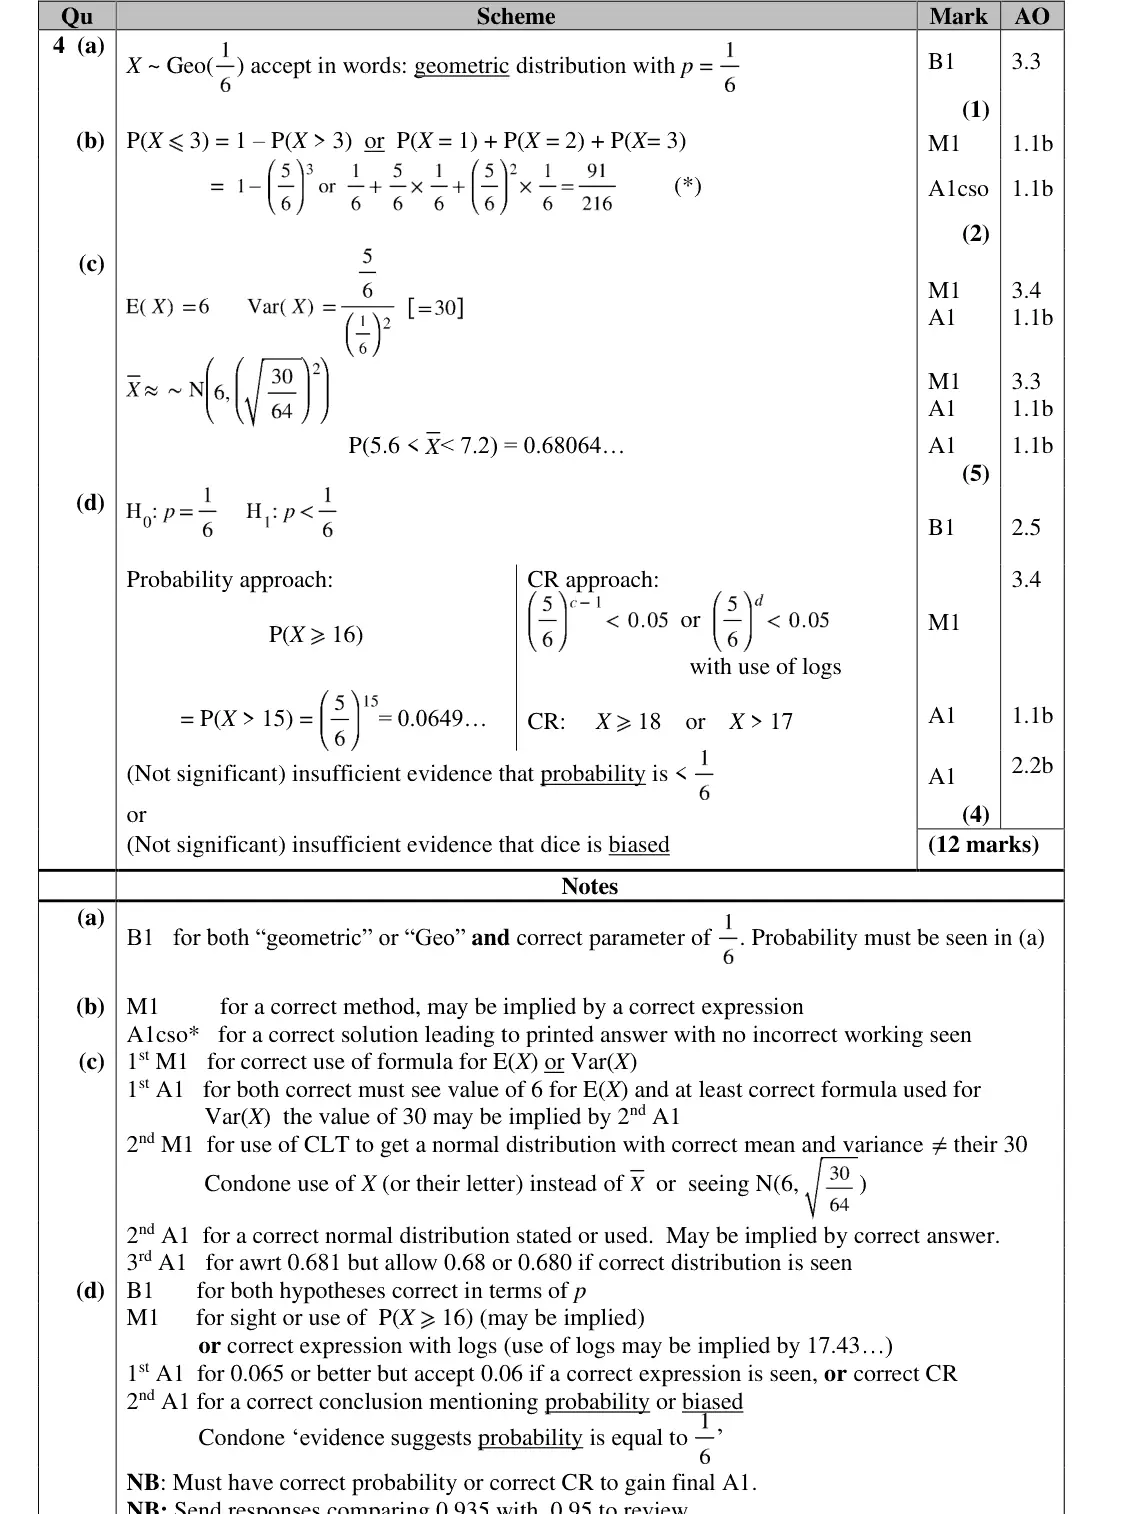
Part (d) was answered well in general. Most candidates gave the hypotheses correctly – though some gave them in words and hence did not gain the mark. A few candidates used P(X = 16), but the majority were able to reach the correct probability, going on to conclude correctly and gain all the marks in (d). A small number chose a critical region approach, and these candidates did so correctly in general. However, overall, it seemed that the critical region approach was less likely to lead to a correct answer, since some candidates gave a critical value of 17 rather than 18 due to not solving the inequality correctly. A small number of candidates chose to compare 0.935 with 0.95, but again, those that did generally did so successfully. Overall, candidates showed a lot of skill when answering Question 5. They showed they were generally adept at modelling with different distributions (including the more challenging aspects such as use of CLT) and were able to conduct a Geometric hypothesis test correctly in the majority of cases.
Key points from the mark scheme and examiner's report
H0: p = 1/6, H1: p < 1/6 (in symbols)
P(X ≥ 16) = (5/6)¹⁵ = 0.0649 > 0.05, not significant: no evidence the probability of a 3 is less than 1/6
P(X = 16) used in error
CR route gives X ≥ 18 (17 a slip)
June 2023 · AS Paper 2 (Further Statistics 1) · Q3(e)4 marks
Mark scheme (whole question; this part is marked with the orange bar)
Examiner's comment
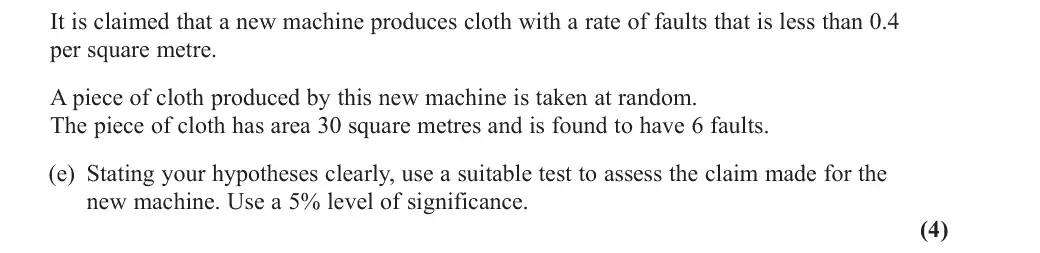
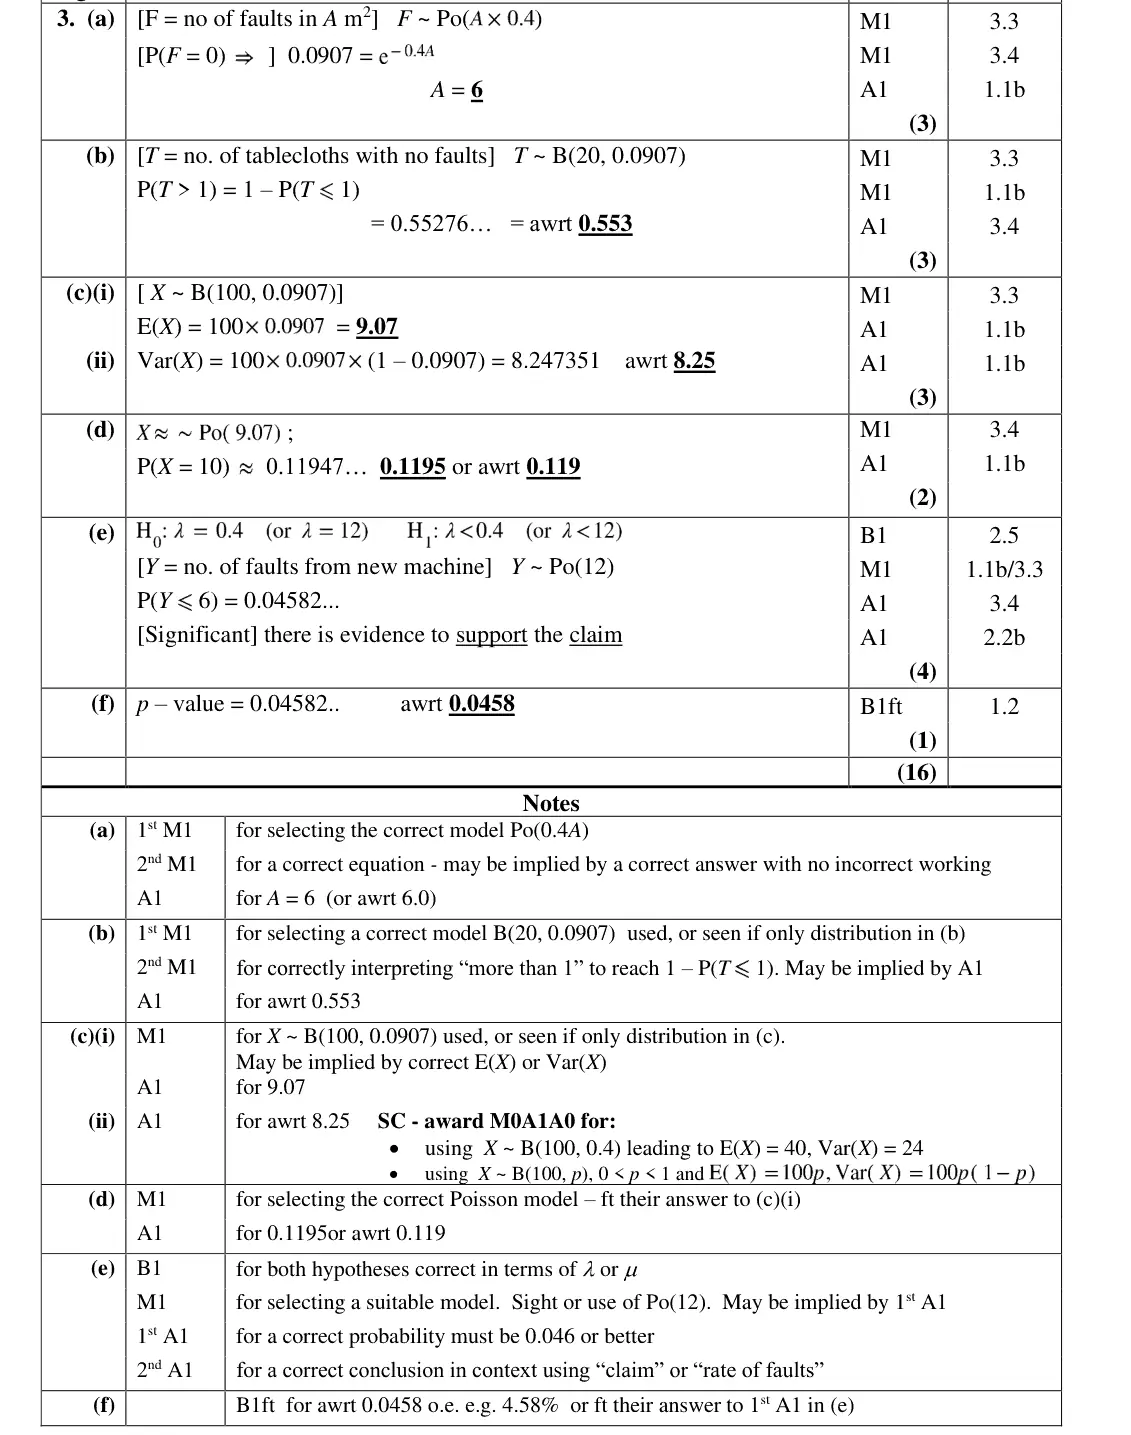
Part (e) was a routine hypothesis test using the Poisson distribution and as such most candidates gained a lot of marks here. There was nothing out of the ordinary and candidates responded well, with a large number gaining all four marks. Most candidates gave a full contextual conclusion rather than commenting on the claim; this was perhaps poor exam technique as less was required in a comment relating to the claim compared to a full contextual comment. Part (e) required the candidates to understand what a p-value was, and unfortunately a large number were unfamiliar with this aspect of the course. As such most answers to this part were guesses, the most common answer being 0.4 from the question. Overall, this question was an excellent opportunity to pick up a large number of marks that could offset issues elsewhere in the paper. All parts were independent of one another except one mark in part (d), and as such gave the candidates lots of opportunities to recover from any
Key points from the mark scheme and examiner's report
H₀: λ = 0.4, H₁: λ < 0.4 (or 12 for 30 m²)
Y ~ Po(12)
P(Y ≤ 6) = 0.0458 < 0.05, significant: evidence to support the claim
June 2023 · AS Paper 2 (Further Statistics 1) · Q3(f)1 mark
Mark scheme (whole question; this part is marked with the orange bar)
Examiner's comment
This was a lengthy question that was well broken down to be accessible to candidates. Most candidates gained twelve or more marks out of sixteen, which is a considerable amount on a paper such as this.
Key points from the mark scheme and examiner's report
p-value = P(Y ≤ 6) = 0.0458
many did not know what a p-value is (0.4 a common guess)
June 2023 · Paper 3B (Further Statistics 1) · Q2(a)4 marks
Mark scheme (whole question; this part is marked with the orange bar)
Examiner's comment
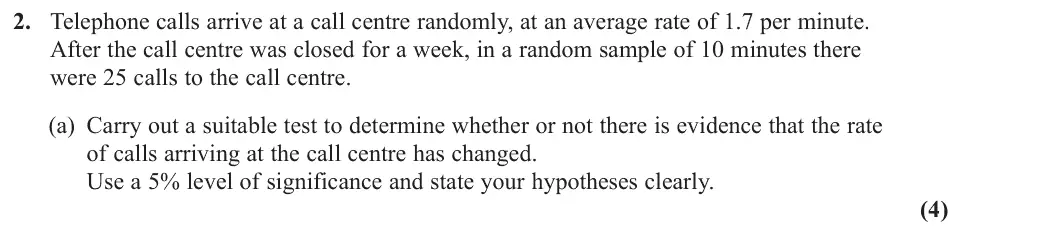
On the whole, this question proved to be one of the more demanding on the paper particularly due to part (c). Students had little difficulty in accessing the marks in part (a) and most were able to secure all 4. Most students choose hypotheses involving = 17 (rather than = 1.7) and most chose a correct two-tailed alternative. Most students successfully navigated their calculators to obtain the correct probability for P(X … 25). Most also chose to find the probability, rather than the critical region, though a typical mistake was to compare the probability to 5% rather than the required 2.5%. Nevertheless the vast majority of students completed the test accurately and were able to give a sufficiently contextual conclusion involving the rate of calls. The most typical errors in failing to secure the final mark was a non-contextual conclusion or one involving the ‘number’, rather than the rate, of calls. Almost all students were able to identify the required binomial distribution in part (b) and of
Key points from the mark scheme and examiner's report
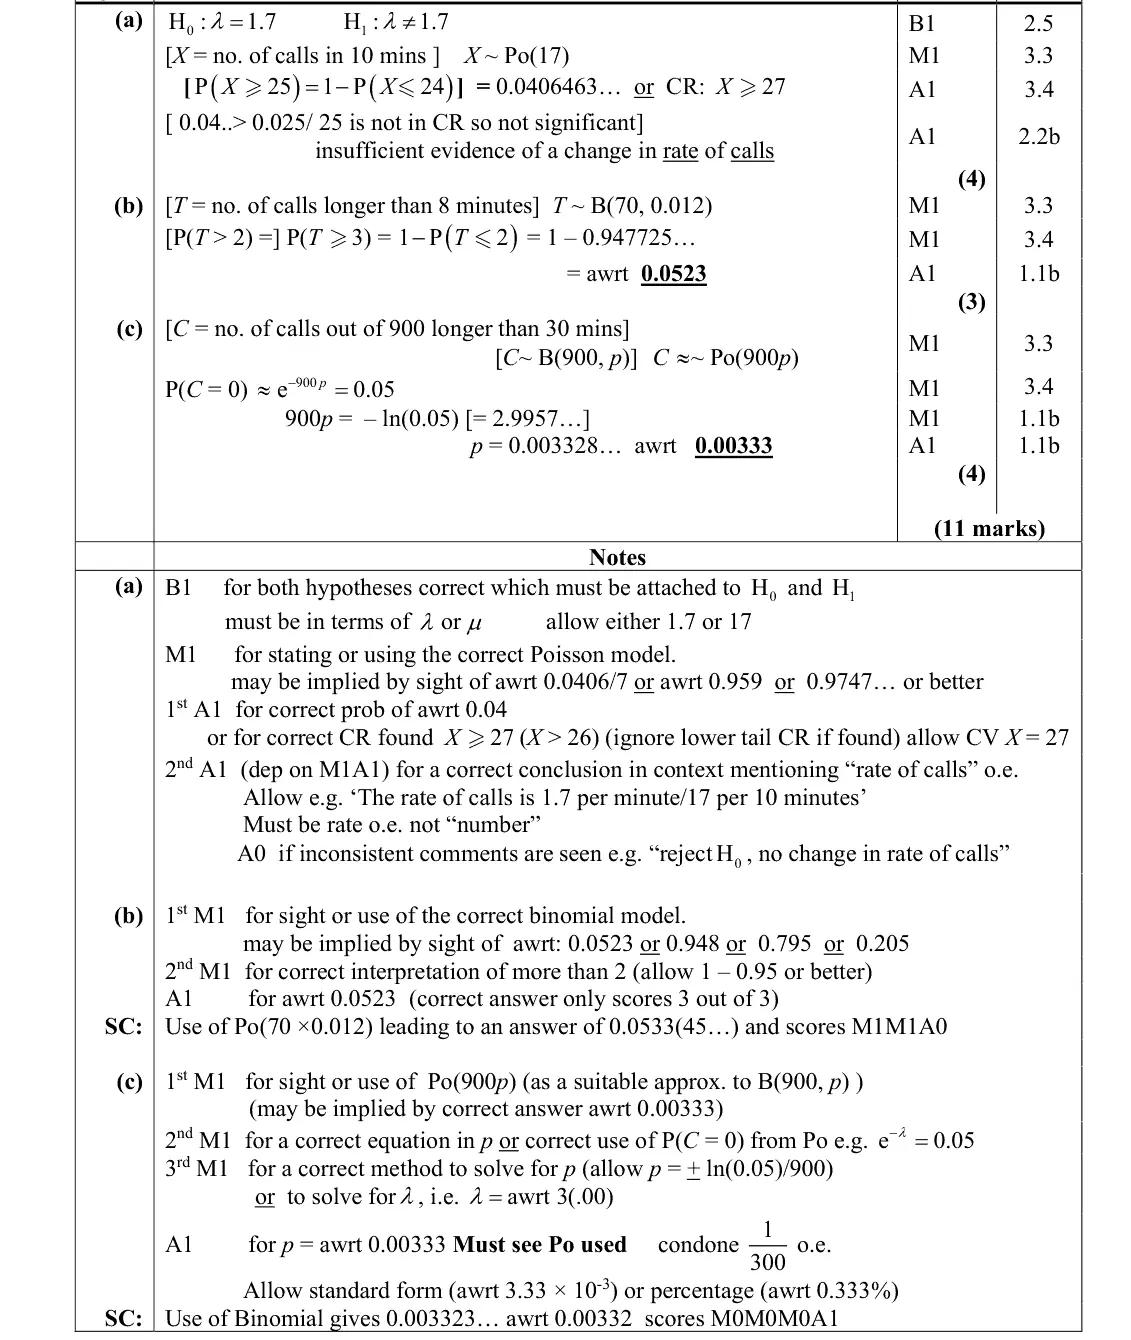
H0: λ = 1.7, H1: λ ≠ 1.7
Po(17) per 10 minutes
P(X ≥ 25) = 0.0406 > 0.025 (two-tailed), not significant: no evidence of a change in the rate of calls
comparing with 5%
conclusion must mention rate, not number
June 2022 · AS Paper 2 (Further Statistics 1) · Q2(c)5 marks
Mark scheme (whole question; this part is marked with the orange bar)
Examiner's comment
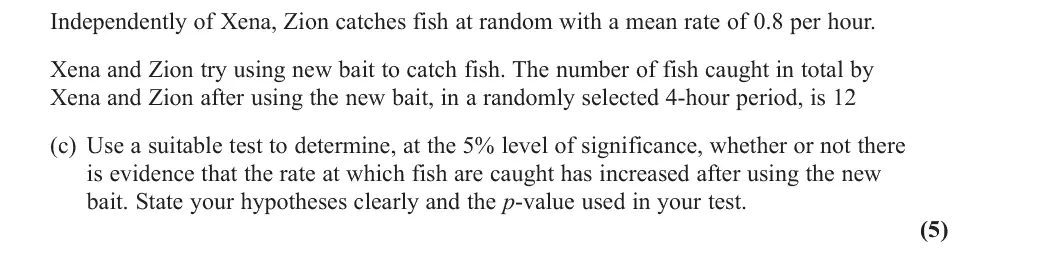
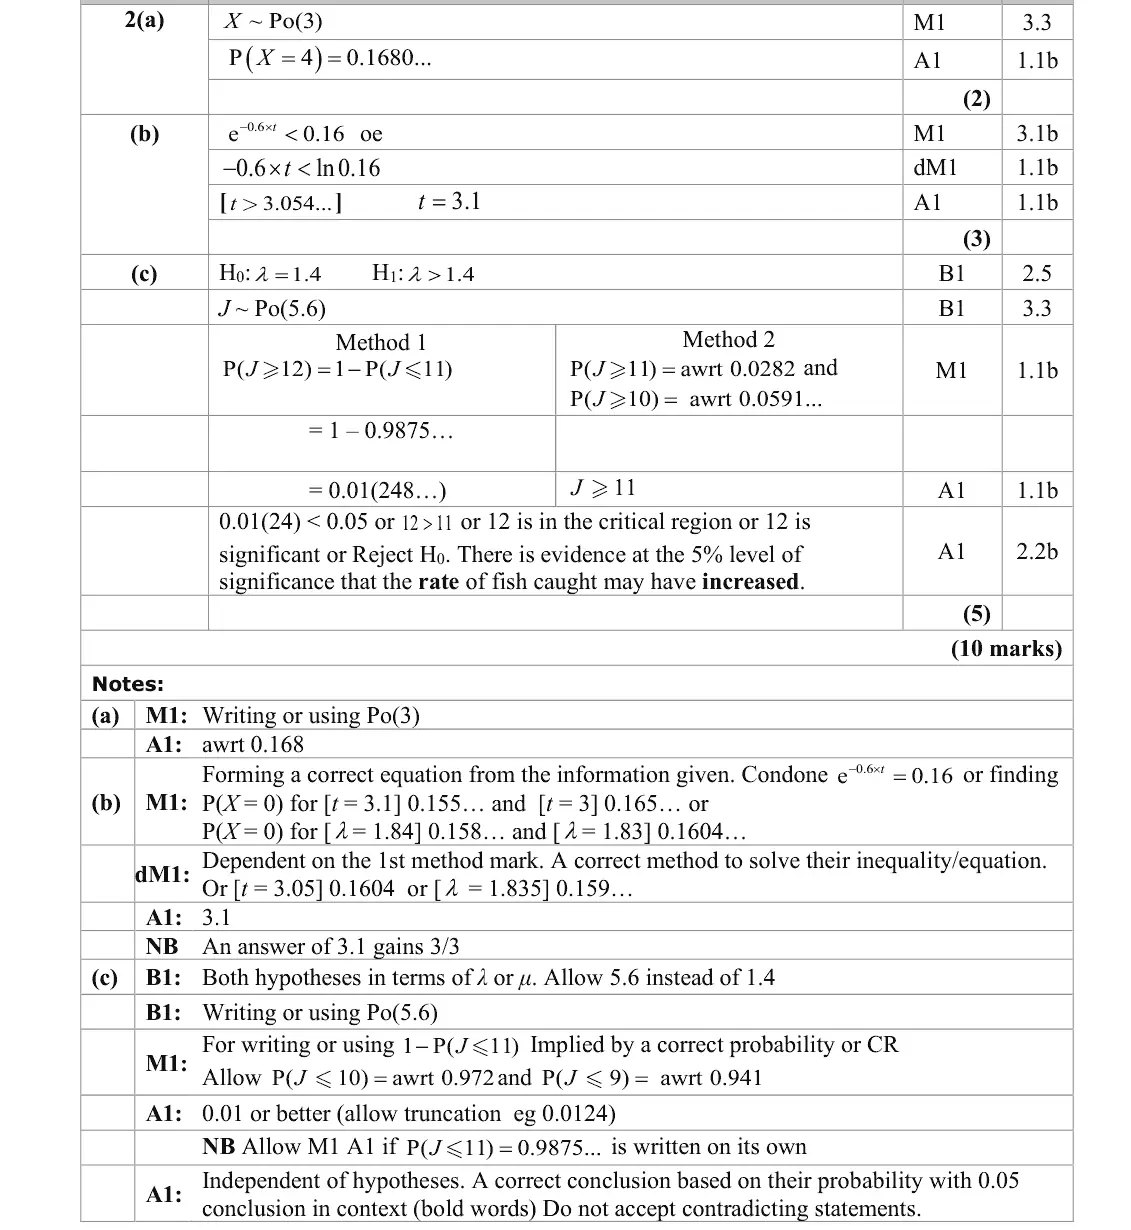
Part (c) was done well with candidates showing an understanding of conducting a hypothesis test using a Poisson distribution. The Hypotheses were generally written correctly in terms of λ or mu and with 1.4 or 5.6 and the correct way round. If this mark was lost it was using a value of 3.2, putting the hypotheses the wrong way round or giving them in words rather than using a parameter. Most students knew to use Po (5.6) with the majority writing it down, although it could be implied if they had the correct probability value. The most successful and common approach was to calculate the probability. It was pleasing to see that the conclusion given was often in context and if this mark was lost it was because of contradicting statements, or thinking it was the number of fish has increased.
Key points from the mark scheme and examiner's report
errors used 3.2, hypotheses in words, or "number of fish has increased"
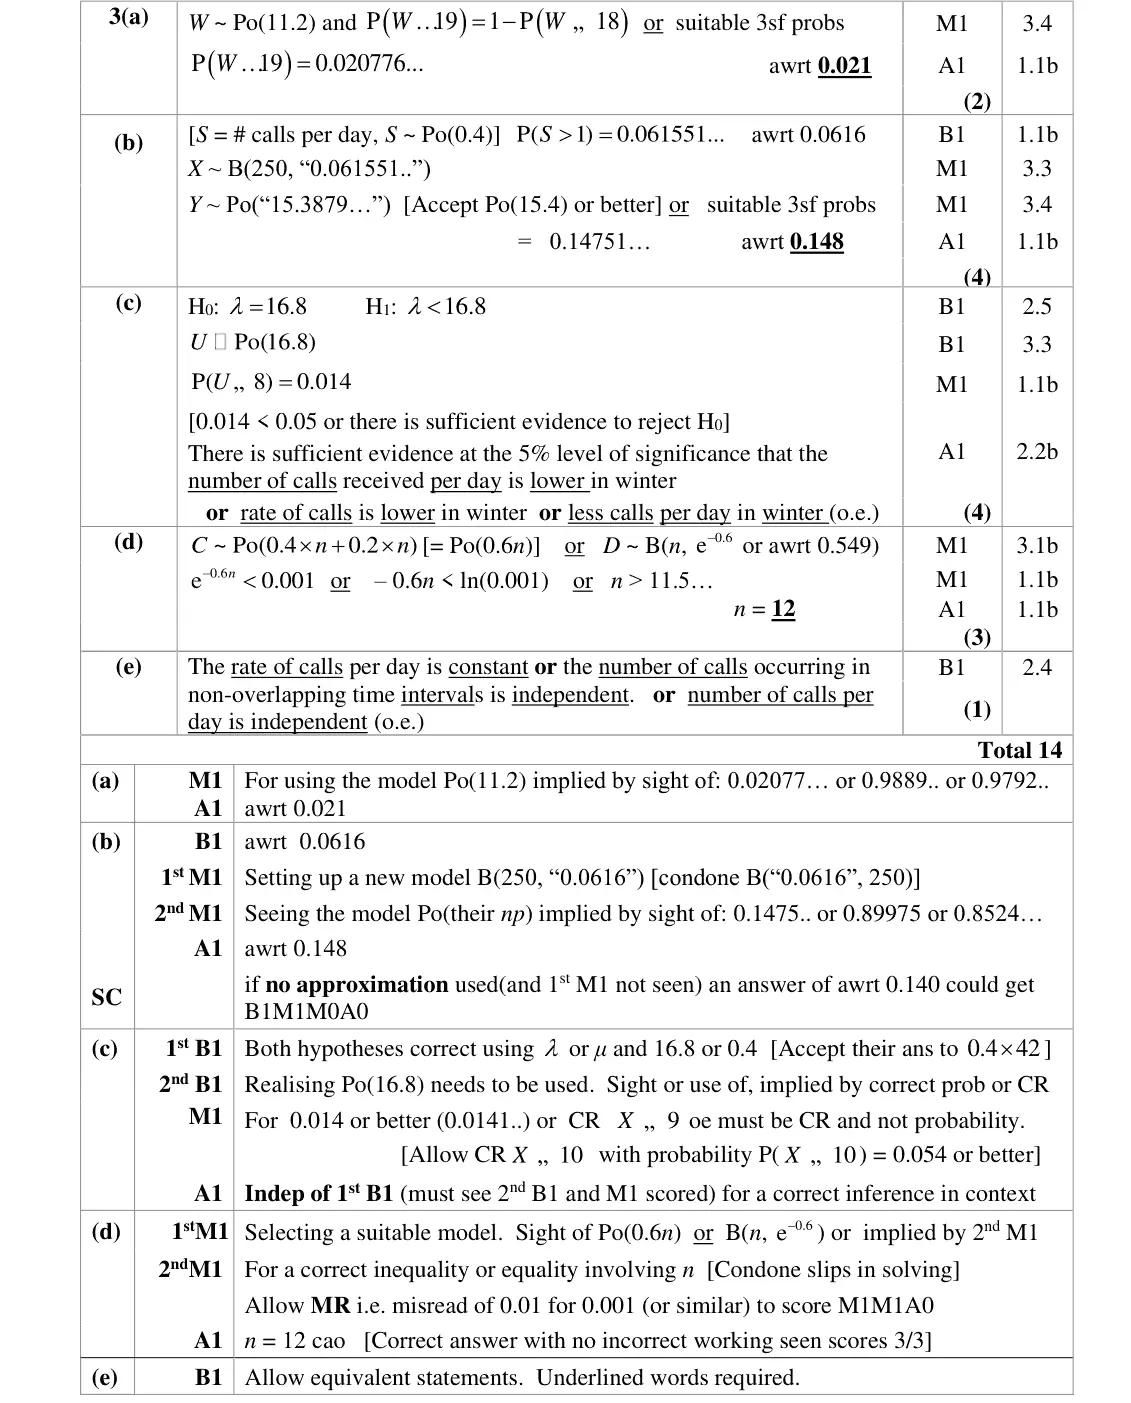
June 2022 · Paper 3B (Further Statistics 1) · Q3(c)4 marks
Mark scheme (whole question; this part is marked with the orange bar)
Examiner's comment
The hypothesis test in part (c) was answered well with most using a suitable parameter for their hypotheses ( a few cases of no parameter or p being used were seen) and most using a correct Poisson probability and finding the appropriate probability correctly. There was usually an attempt to give the conclusion in context but this wasn’t always precise enough. The test is about the “rate of calls per day” and so a conclusion simply saying that “the number of calls is lower in winter” was not suitable. The final two parts were more discriminating. In part (d) many knew how to combine
Key points from the mark scheme and examiner's report
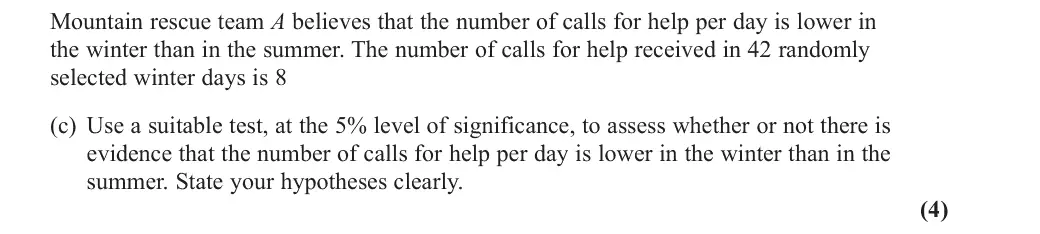
H0: λ = 16.8, H1: λ < 16.8 for 42 days
P(U ≤ 8) = 0.014 < 0.05, significant
conclusion must be about the rate of calls per day being lower in winter
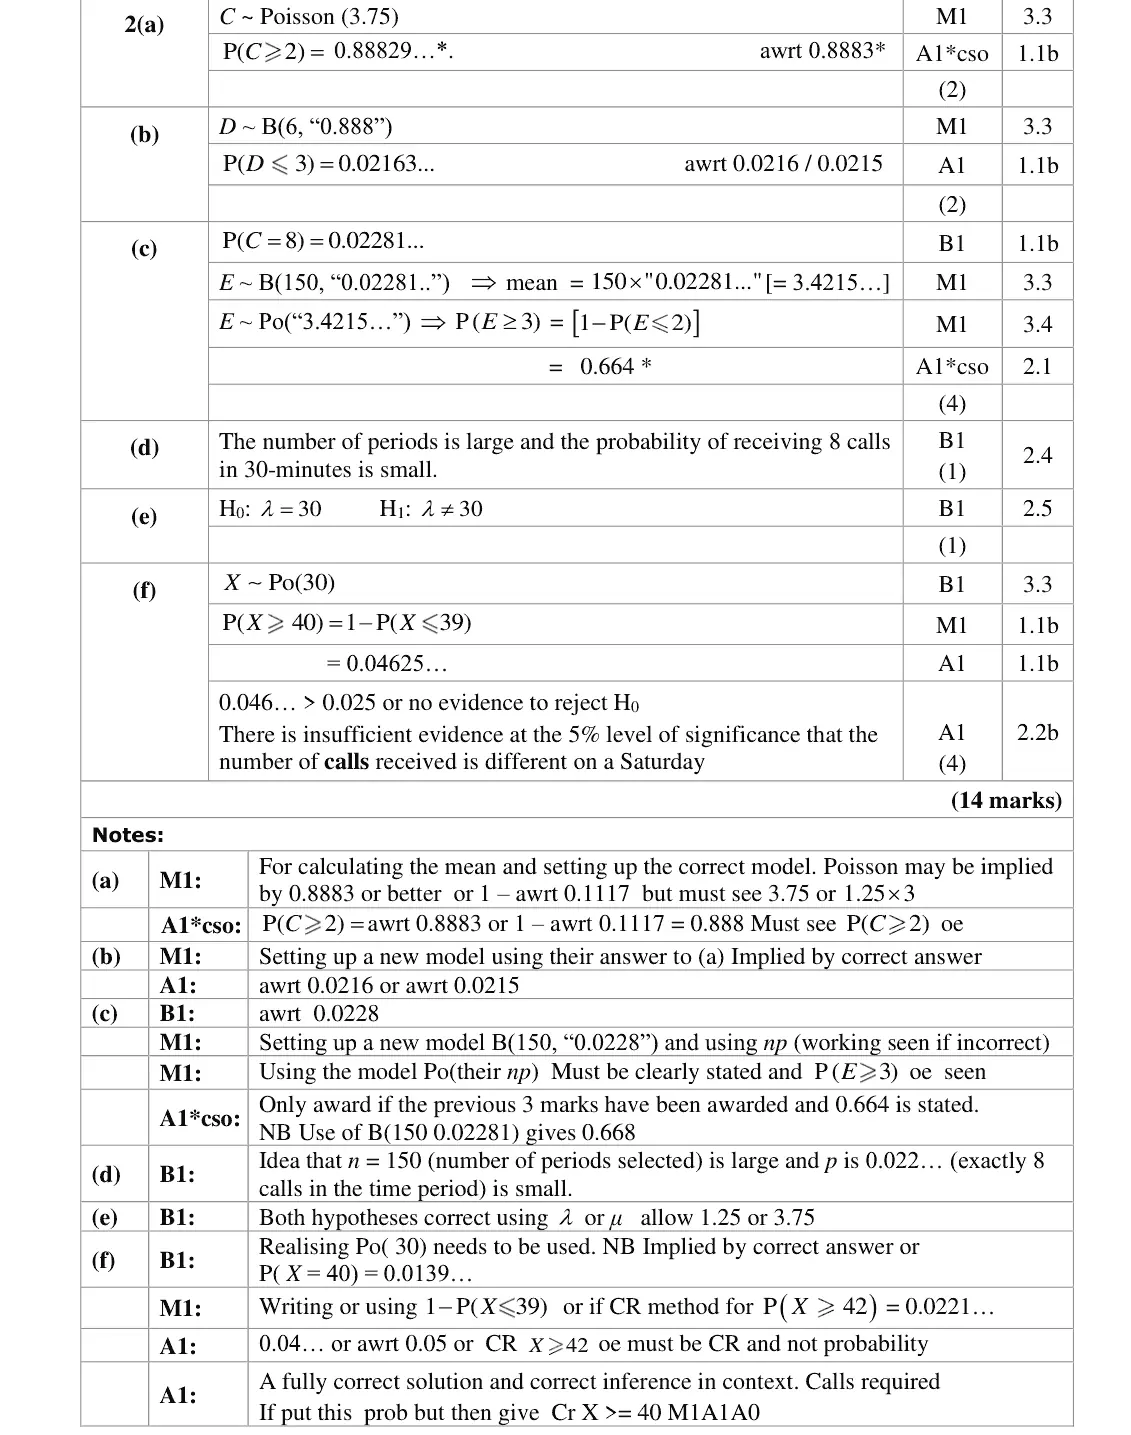
Nov 2021 · Paper 3B (Further Statistics 1) · Q2(e)1 mark
Mark scheme (whole question; this part is marked with the orange bar)
Examiner's comment
This was a well answered question although few candidates gained full marks. It was pleasing to see that in part (e) most candidates used the correct parameters.
Key points from the mark scheme and examiner's report
H0: λ = 30, H1: λ ≠ 30 (4 hours
1.25 or 3.75 per period allowed)
Nov 2021 · Paper 3B (Further Statistics 1) · Q2(f)4 marks
Mark scheme (whole question; this part is marked with the orange bar)
Examiner's comment
This was a well answered question although few candidates gained full marks. In part (f) most candidates realised they needed to use Po(30). Many candidates were then able to go on and gain full marks. There are still a number of candidates who calculate P(X = 40) rather than. It was pleasing that most candidates give their final conclusion in context.
Key points from the mark scheme and examiner's report
Po(30)
P(X ≥ 40) = 1 − P(X ≤ 39) = 0.0463 > 0.025 (two-tailed), not significant: no evidence the number of calls differs on a Saturday
P(X = 40) wrongly used
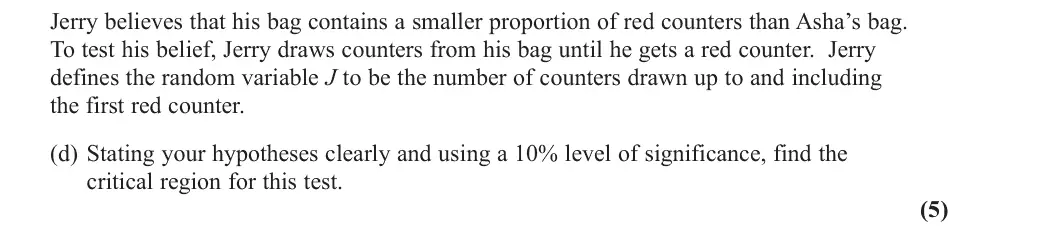
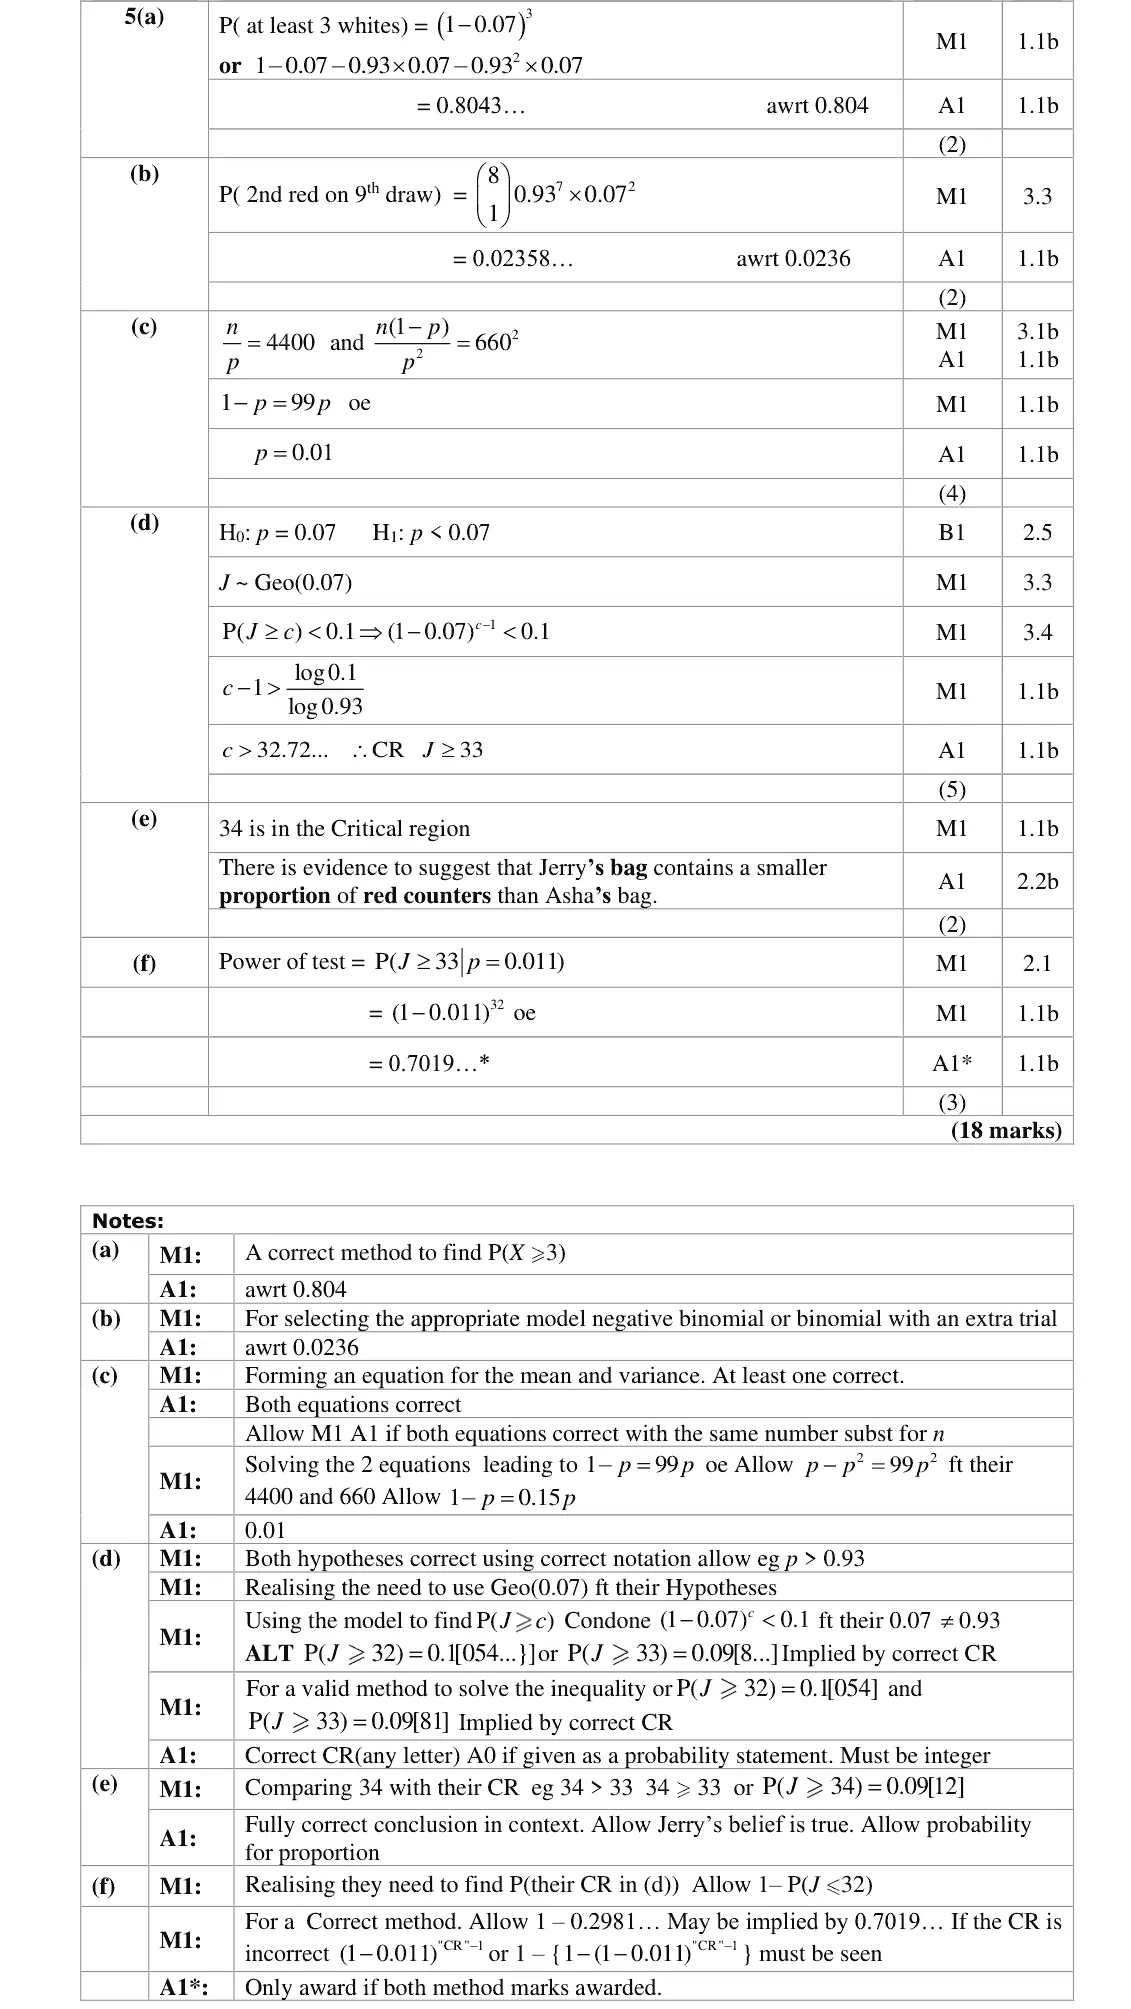
Nov 2021 · Paper 3B (Further Statistics 1) · Q5(d)5 marks
Mark scheme (whole question; this part is marked with the orange bar)
Examiner's comment
In part (d) it was pleasing to see that the hypotheses were generally correct with most using the appropriate parameter along with the distribution being clearly stated. Those candidates who chose to form and solve an inequality were generally successful. However, those who chose to compare probability statements often selected the incorrect region 32 J .
Key points from the mark scheme and examiner's report
H0: p = 0.07, H1: p < 0.07
J ~ Geo(0.07)
P(J ≥ c) = 0.93^(c−1) < 0.1 so CR J ≥ 33
comparing probabilities often picked J ≥ 32
Nov 2021 · Paper 3B (Further Statistics 1) · Q5(e)2 marks
Mark scheme (whole question; this part is marked with the orange bar)
Examiner's comment
Part (e) most candidates compared their CR with 34 correctly although many did not have the correct conclusion with the required context.
Key points from the mark scheme and examiner's report
34 lies in the CR: evidence that Jerry's bag has a smaller proportion of red counters
conclusion in context needed
Oct 2020 · AS Paper 2 (Further Statistics 1) · Q4(c)3 marks
Mark scheme (whole question; this part is marked with the orange bar)
Examiner's comment
A number of fully correct hypothesis tests were seen in part (c) with most conclusions given in context. On a number of occasions, candidates used incorrect notation or attempted to write their hypotheses using words. When calculating the test statistic, was sometimes used instead of P( . P( 14) 14) X = X <=
Key points from the mark scheme and examiner's report
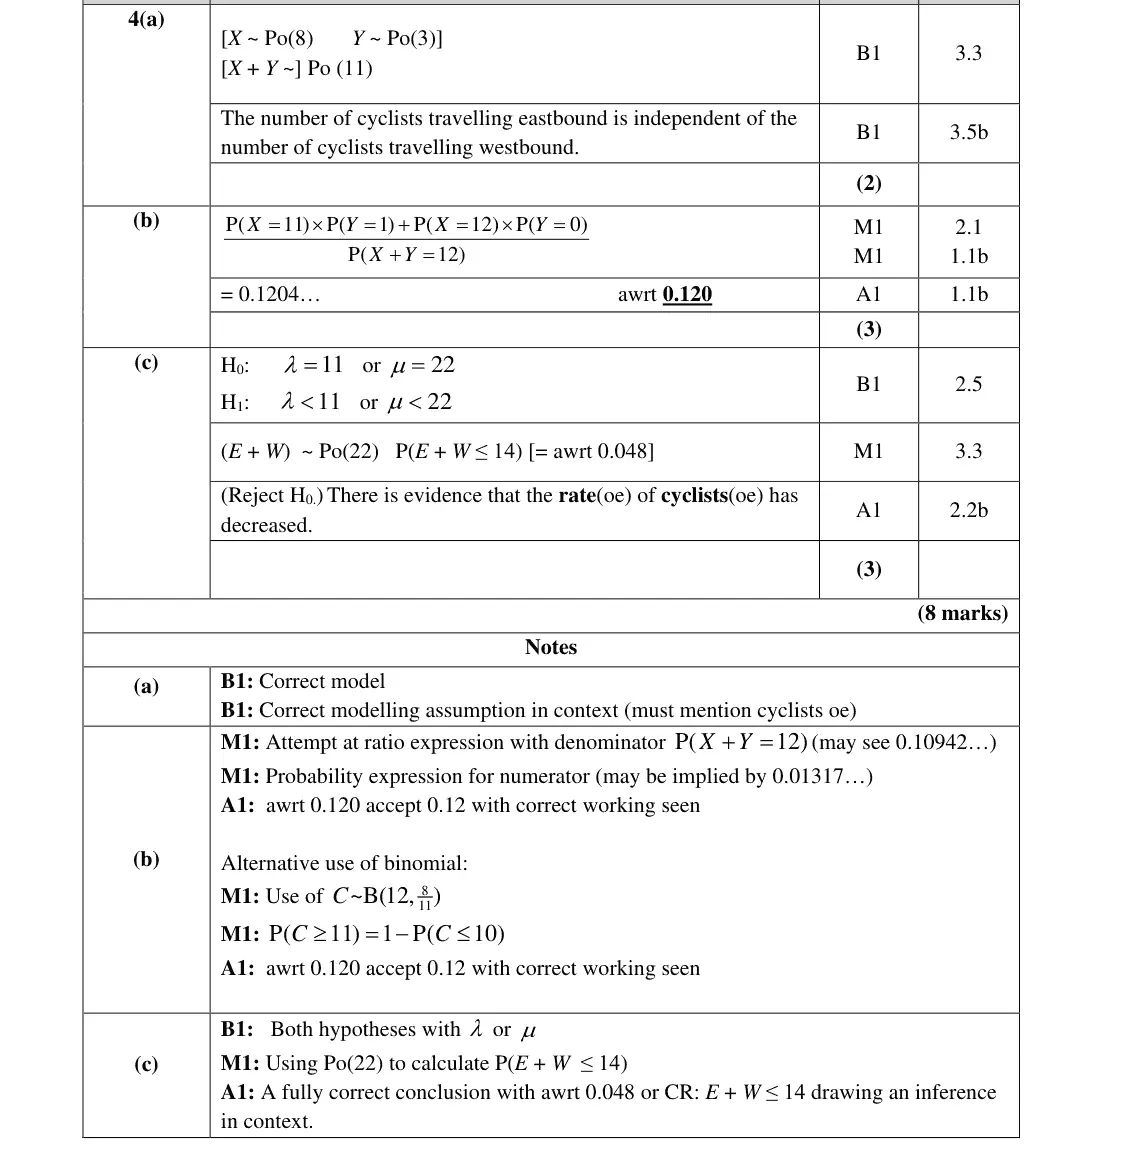
H₀: λ = 11, H₁: λ < 11 (or μ = 22)
Po(22) for 20 minutes
P(T ≤ 14) = 0.048 < 0.05, reject H₀: the rate of cyclists has decreased
errors were hypotheses in words and using P(T = 14)
Oct 2020 · Paper 3B (Further Statistics 1) · Q1(b)4 marks
Mark scheme (whole question; this part is marked with the orange bar)
Examiner's comment
In part (b) the majority of candidates were successful, but on some occasions some did not form appropriate hypotheses in terms of a parameter. A common error was the minority finding P(X=10) instead of the tail probability. Most took the easier route of finding the probability to compare with 5%, rather than finding the critical region. The interpretation of the found probability was generally correct and in context but there were a few who thought a ‘value’ higher than 0.05 was significant.
Key points from the mark scheme and examiner's report
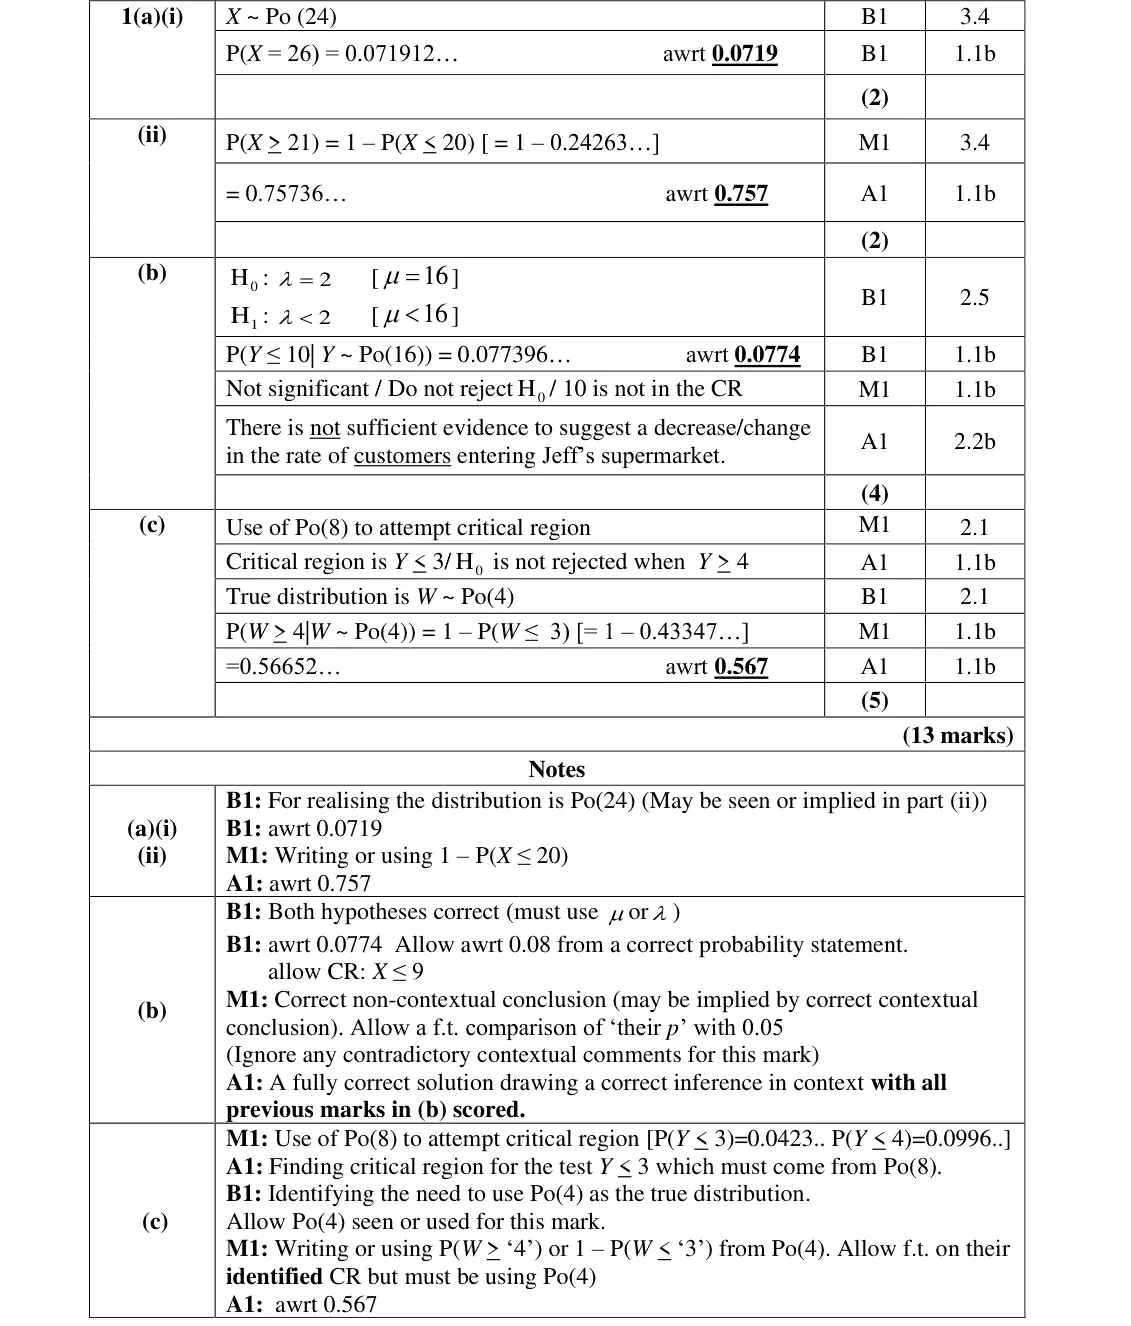
H0: λ = 2, H1: λ < 2 (per 5 min), so Po(16) for 40 minutes
P(Y ≤ 10) = 0.0774 > 0.05, not significant, no evidence of a decrease
some found P(Y = 10) instead of the tail
hypotheses must use a parameter
June 2019 · AS Paper 2 (Further Statistics 1) · Q3(d)4 marks
Mark scheme (whole question; this part is marked with the orange bar)
Examiner's comment
Only few candidates did not realise the significance of the terms “random” and “average rate” and used binomial rather than Poisson models throughout the question but for most candidates this question correctly recommend scheme A. There were many correct answers to part (d) with hypotheses usually given correctly in terms of or but the common errors were to leave the final answer as P(E 3) rather than E 3 or confusing a critical region with a critical value and having a final error of E = 3.
Key points from the mark scheme and examiner's report
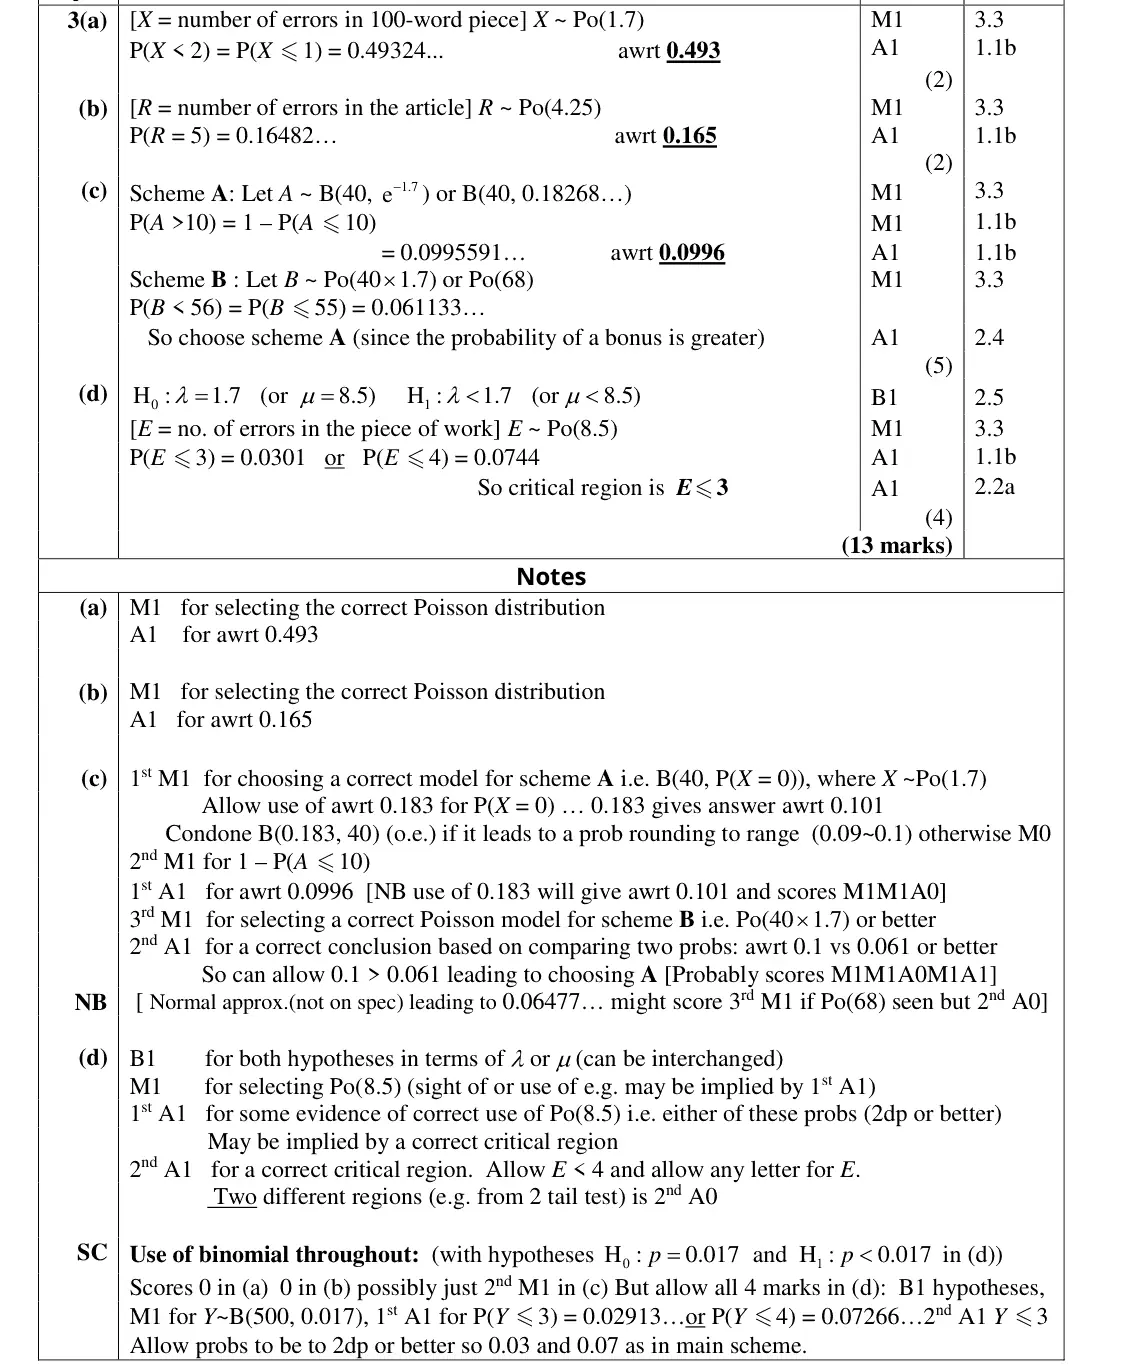
H₀: λ = 1.7, H₁: λ < 1.7 (or μ = 8.5)
E ~ Po(8.5)
P(E ≤ 3) = 0.0301, P(E ≤ 4) = 0.0744
CR E ≤ 3
errors were giving a probability or a critical value (E = 3) instead of a region
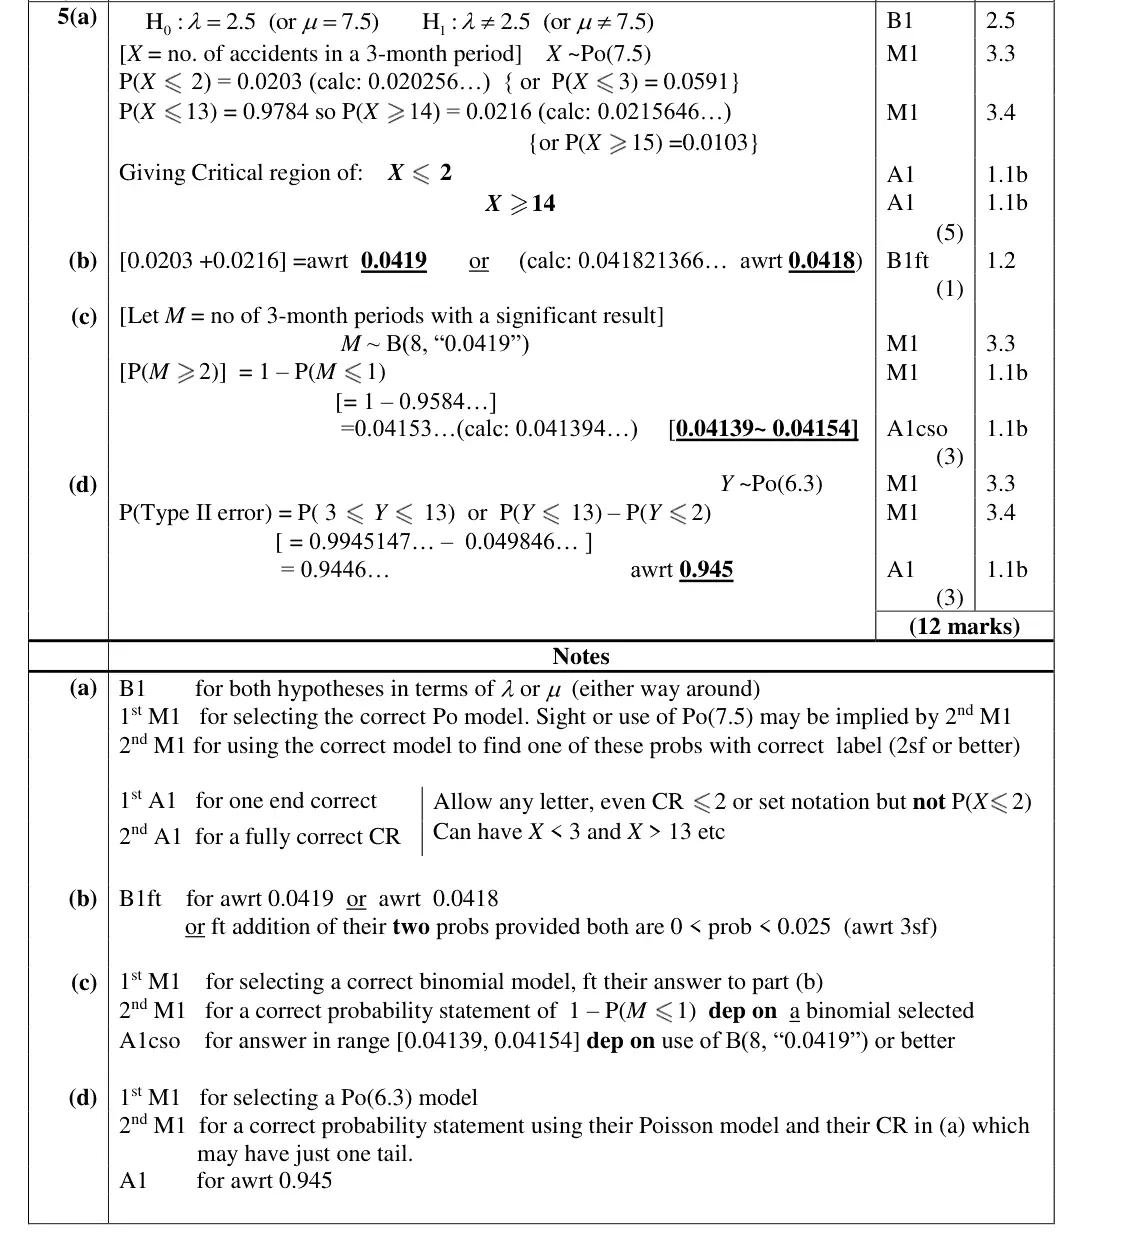
June 2019 · Paper 3B (Further Statistics 1) · Q5(a)5 marks
Mark scheme (whole question; this part is marked with the orange bar)
Examiner's comment
Part (a) was usually answered well but a few candidates were going from P(X 13) to X 13 as the critical region and occasionally candidates were using Po(2.5) instead of of Po(7.5). Most candidates knew how to find the probability in part (b). Many identified the binomial model in part (c) but some
Key points from the mark scheme and examiner's report
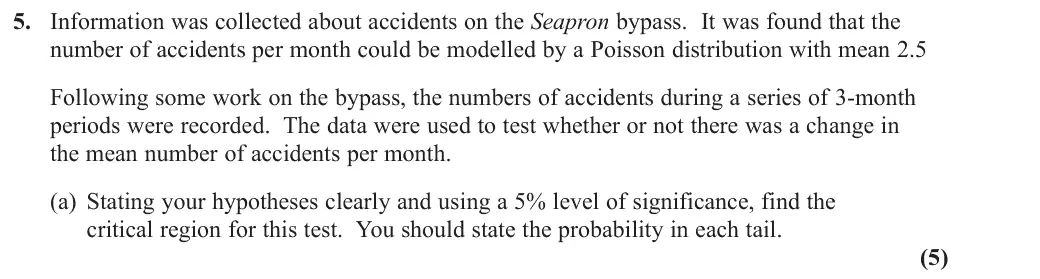
H0: λ = 2.5, H1: λ ≠ 2.5 (two-tailed)
Po(7.5) per 3 months
CR X ≤ 2 (0.0203) or X ≥ 14 (0.0216)
writing X ≥ 13 from P(X ≤ 13), or using Po(2.5)
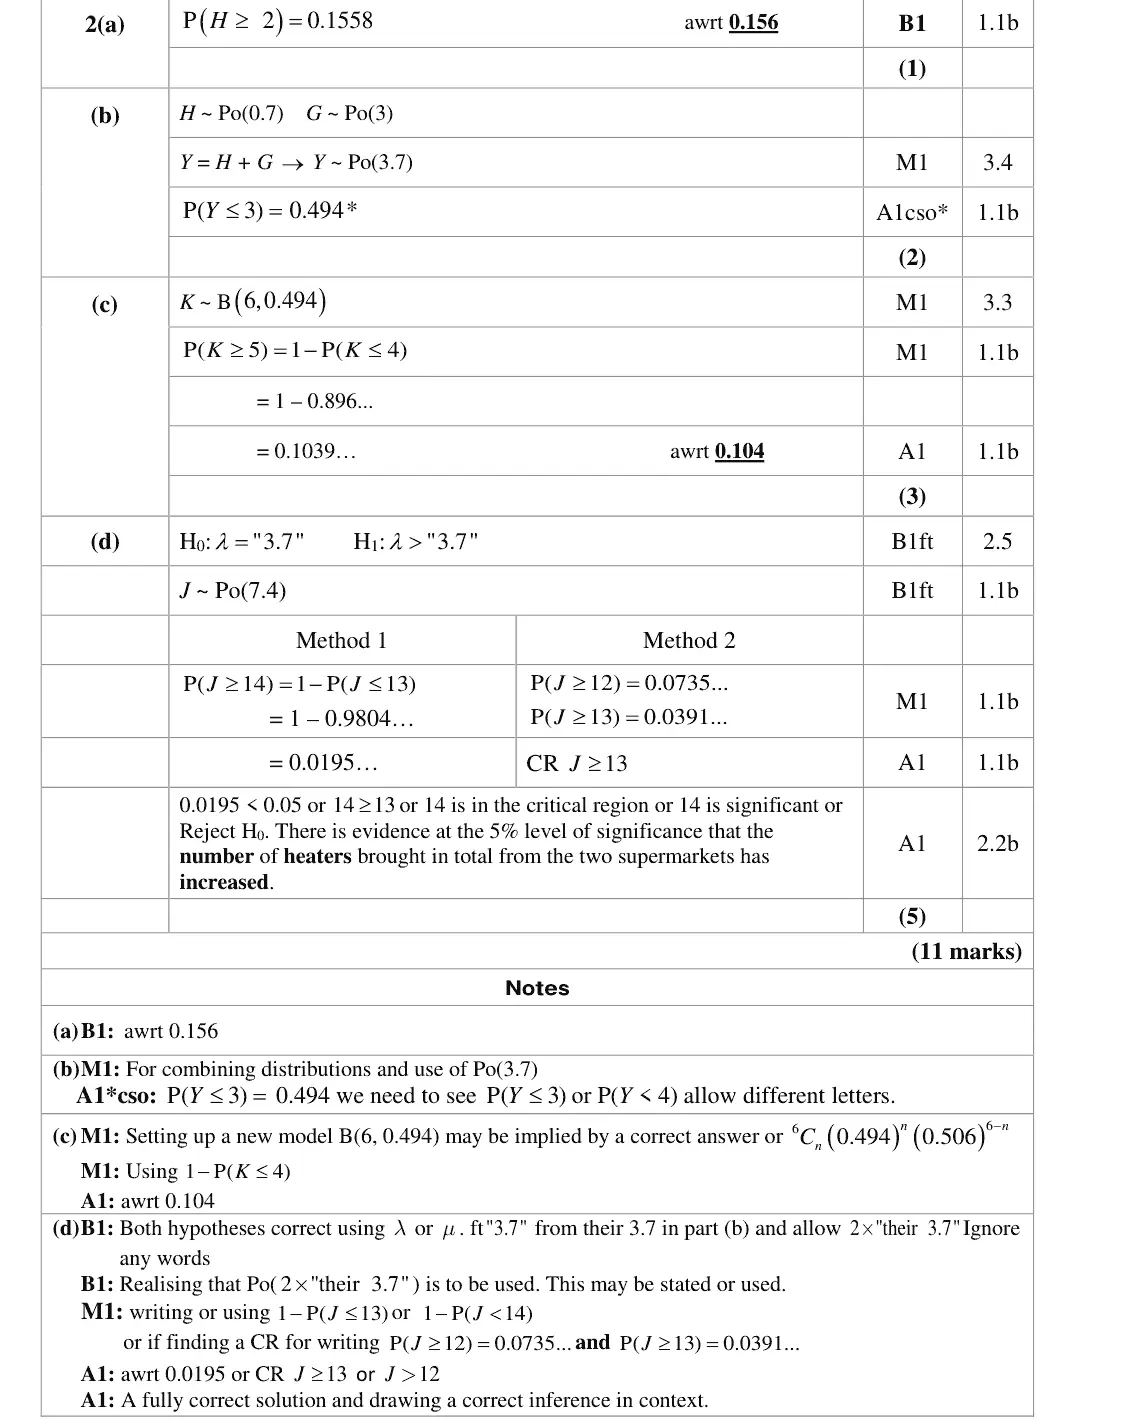
June 2018 · AS Paper 2 (Further Statistics 1) · Q2(d)5 marks
Mark scheme (whole question; this part is marked with the orange bar)
Examiner's comment
In part (d) the hypotheses were generally stated with the correct parameter although a minority of students tried to write them in words. The most common errors appeared in the X calculation where a common error was to use the mean of 3.7 or to calculate the P( . 14) Pleasingly conclusions were generally given in context for this question.
Key points from the mark scheme and examiner's report
H₀: λ = 3.7, H₁: λ > 3.7 (or 7.4 for two days)
J ~ Po(7.4)
P(J ≥ 14) = 0.0195 < 0.05 or CR J ≥ 13, reject H₀: the mean number of heaters has increased
common errors were using mean 3.7 or P(J > 14)
Find an Edexcel Further Maths tutor
Stuck on this? Book a trial lesson with our Further Maths tutor.