D1.4.5 Construct resource histograms (including resource levelling) based…

Section
D1.4 Critical path analysis
Level
A level only
Statement
Construct resource histograms (including resource levelling) based on the number of workers required to complete each activity.
Guidance
The number of workers required to complete each activity of a project will be given and the number or workers required may not necessarily be one.
Since 2018
6 parts, 19 marks · topic pages: Critical path analysis

Back to the checklist

June 2025 · Paper 3D (Decision 1) · Q6(d) 3 marks
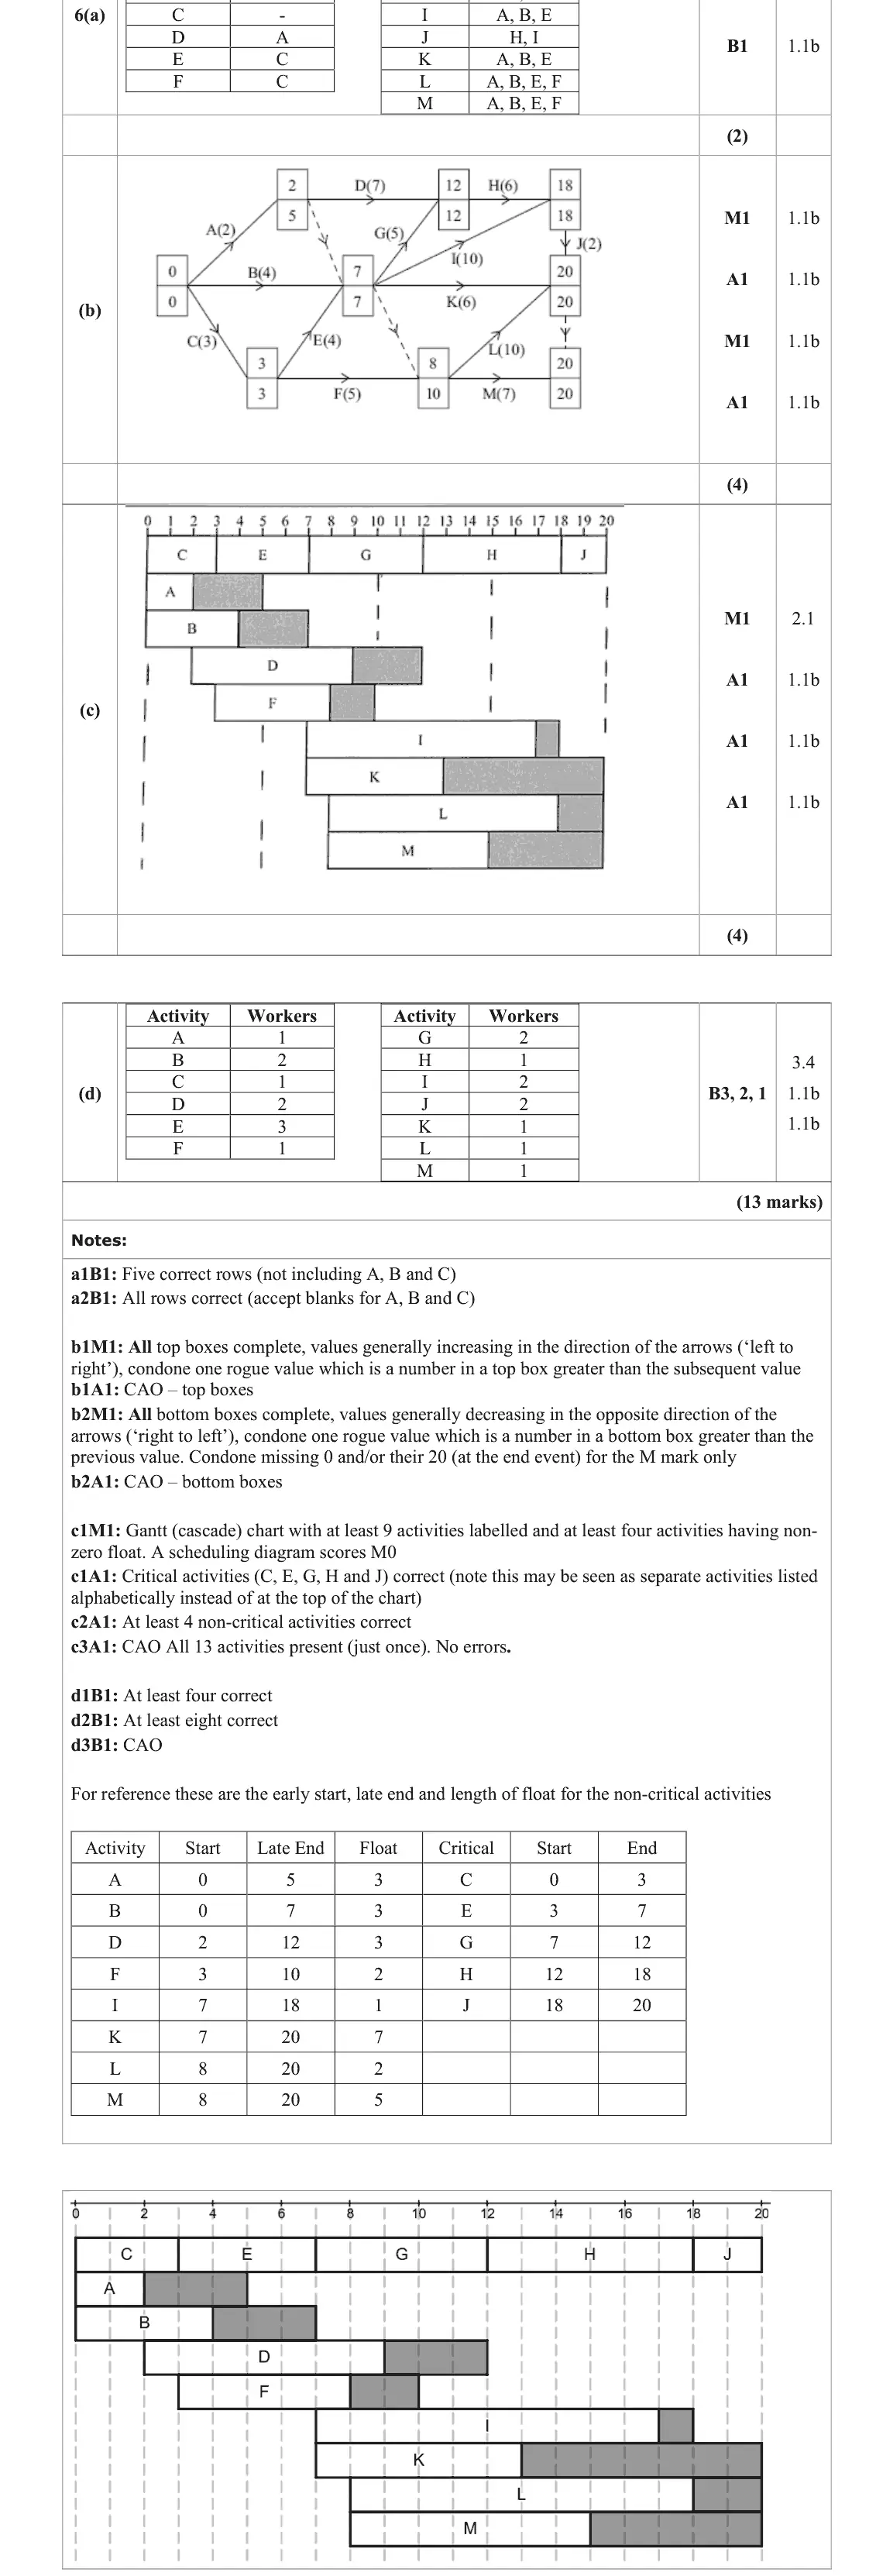
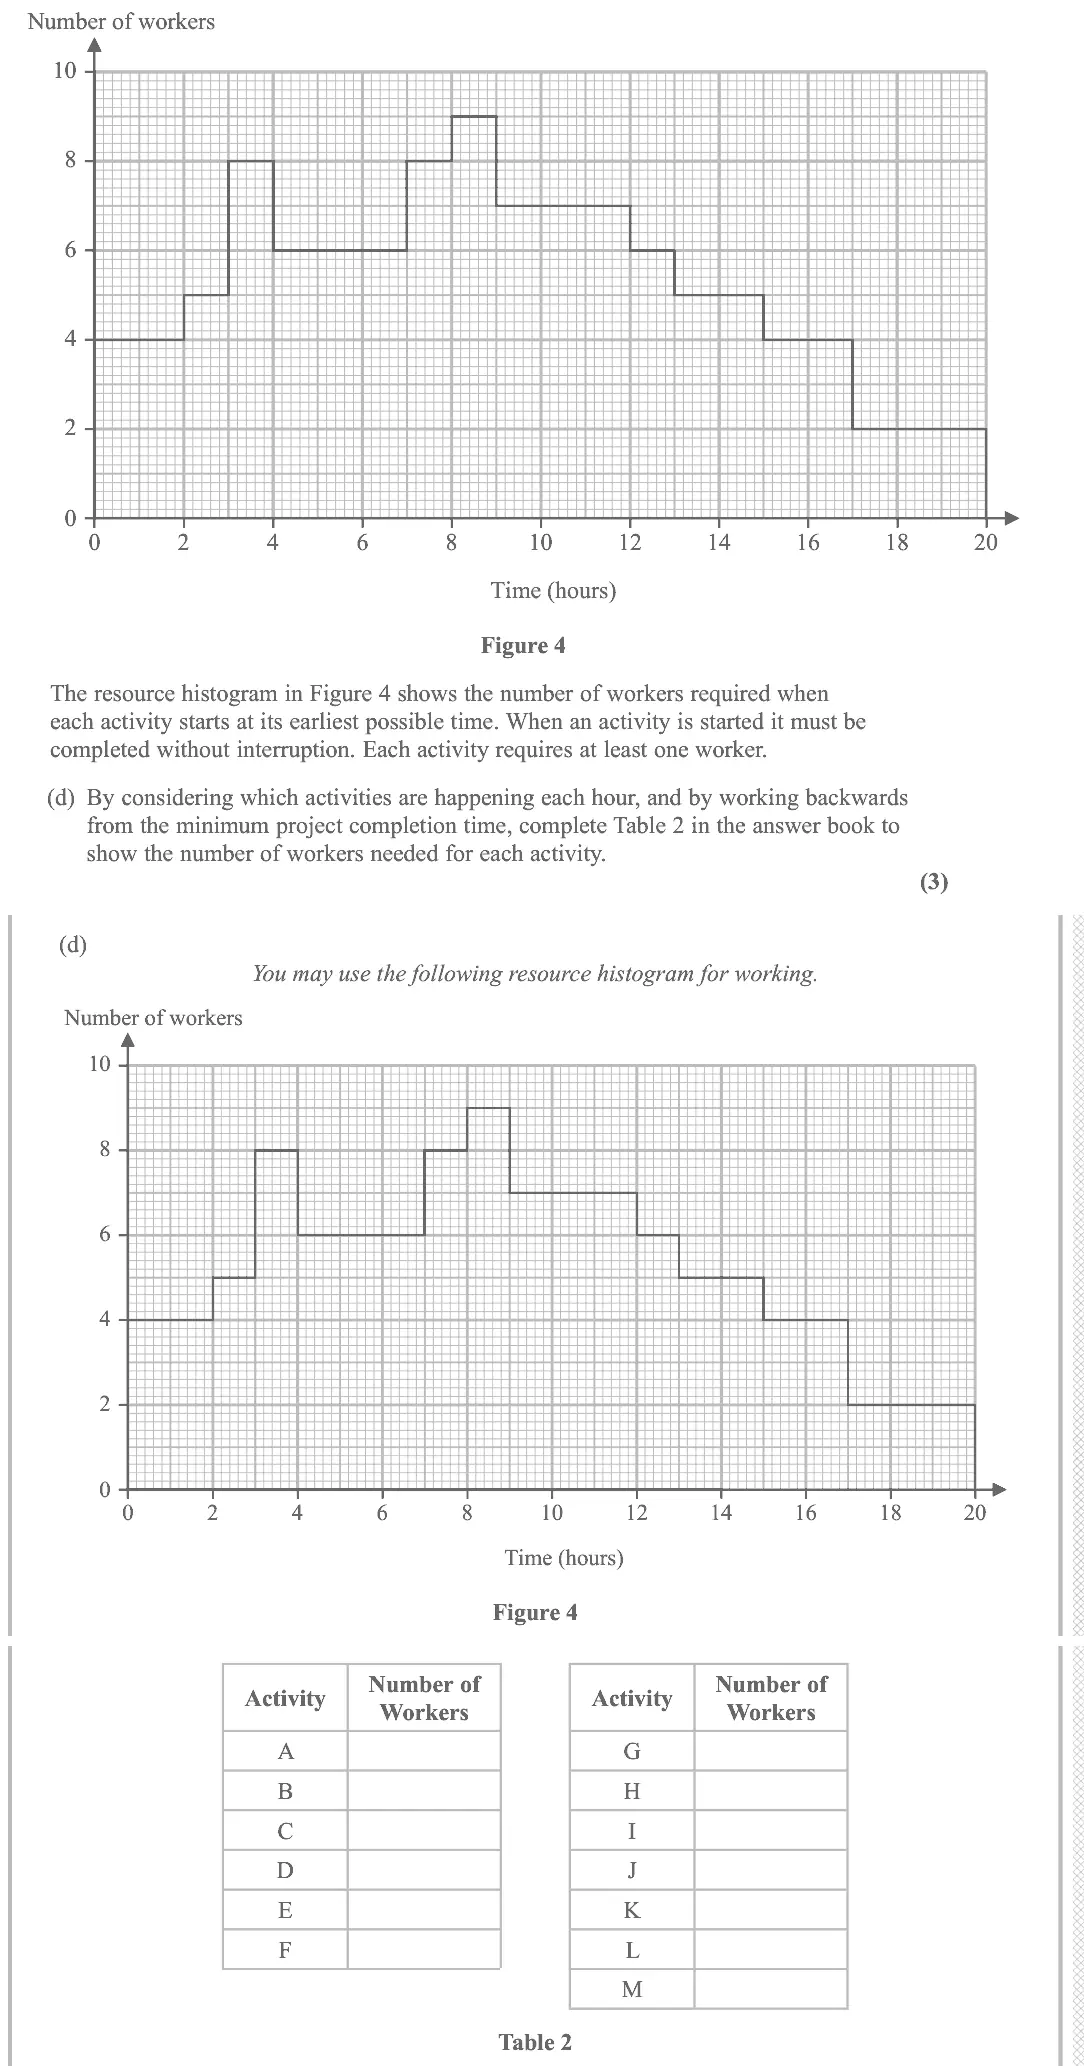
Number of workers Time (hours) Figure 4 The resource histogram in Figure 4 shows the number of workers required when each activity starts at its earliest possible time. When an activity is started it must be completed without interruption. Each activity requires at least one worker. (d) By considering which activities are happening each hour, and by working backwards from the minimum project completion time, complete Table 2 in the answer book to show the number of workers needed for each activity. (3)
June 2023 · Paper 3D (Decision 1) · Q2(b) 4 marks
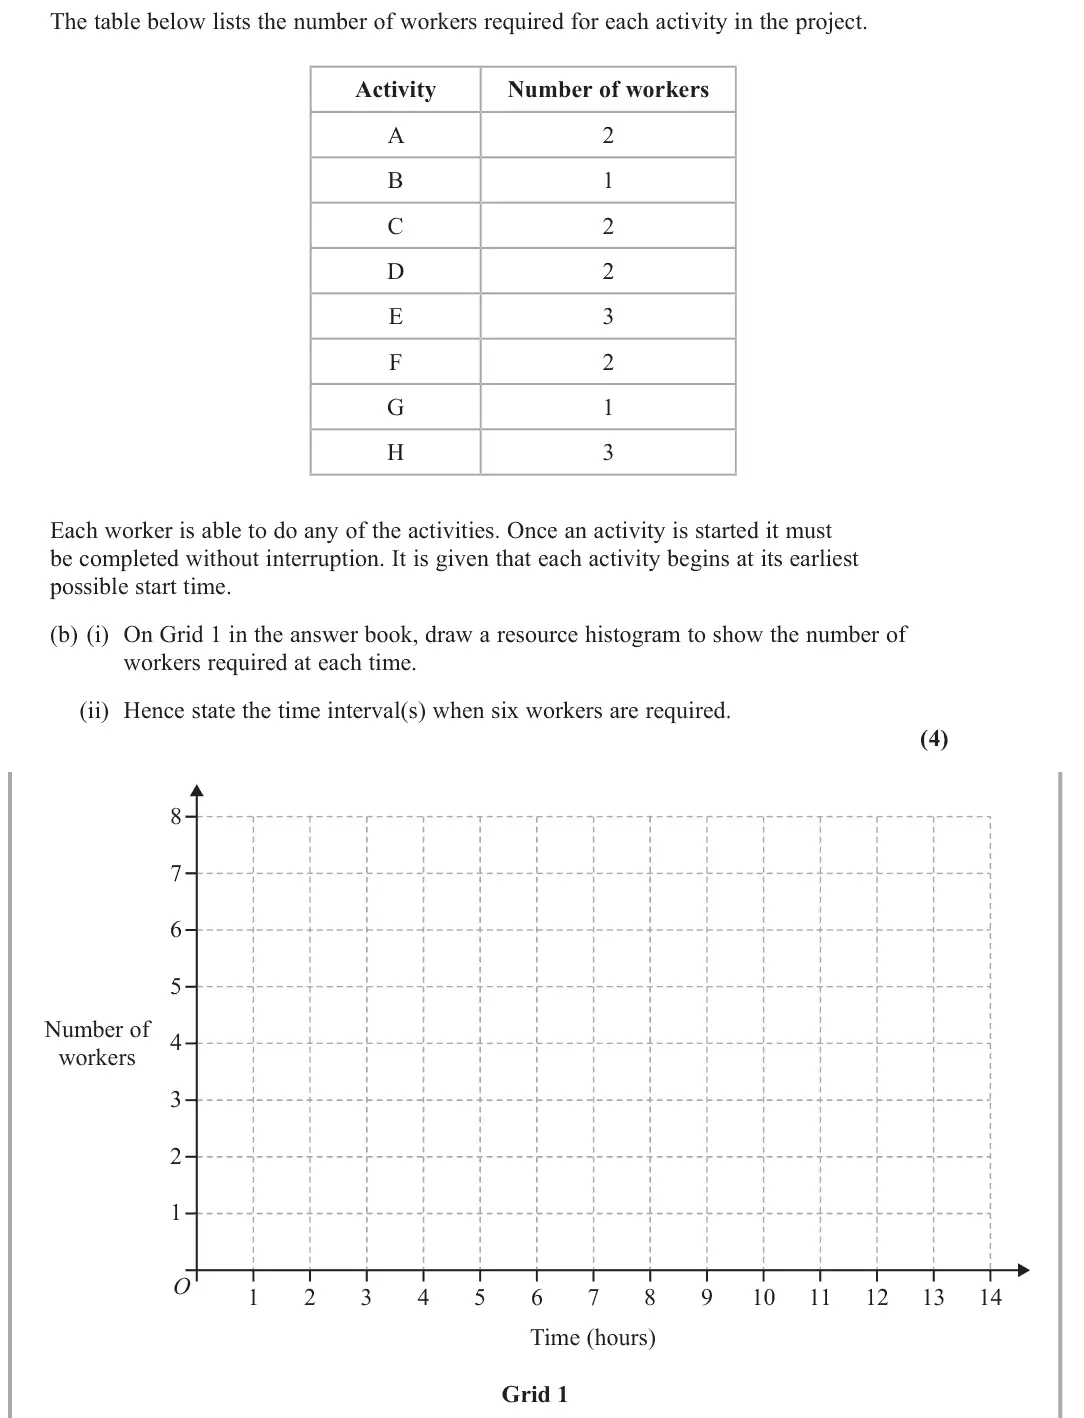
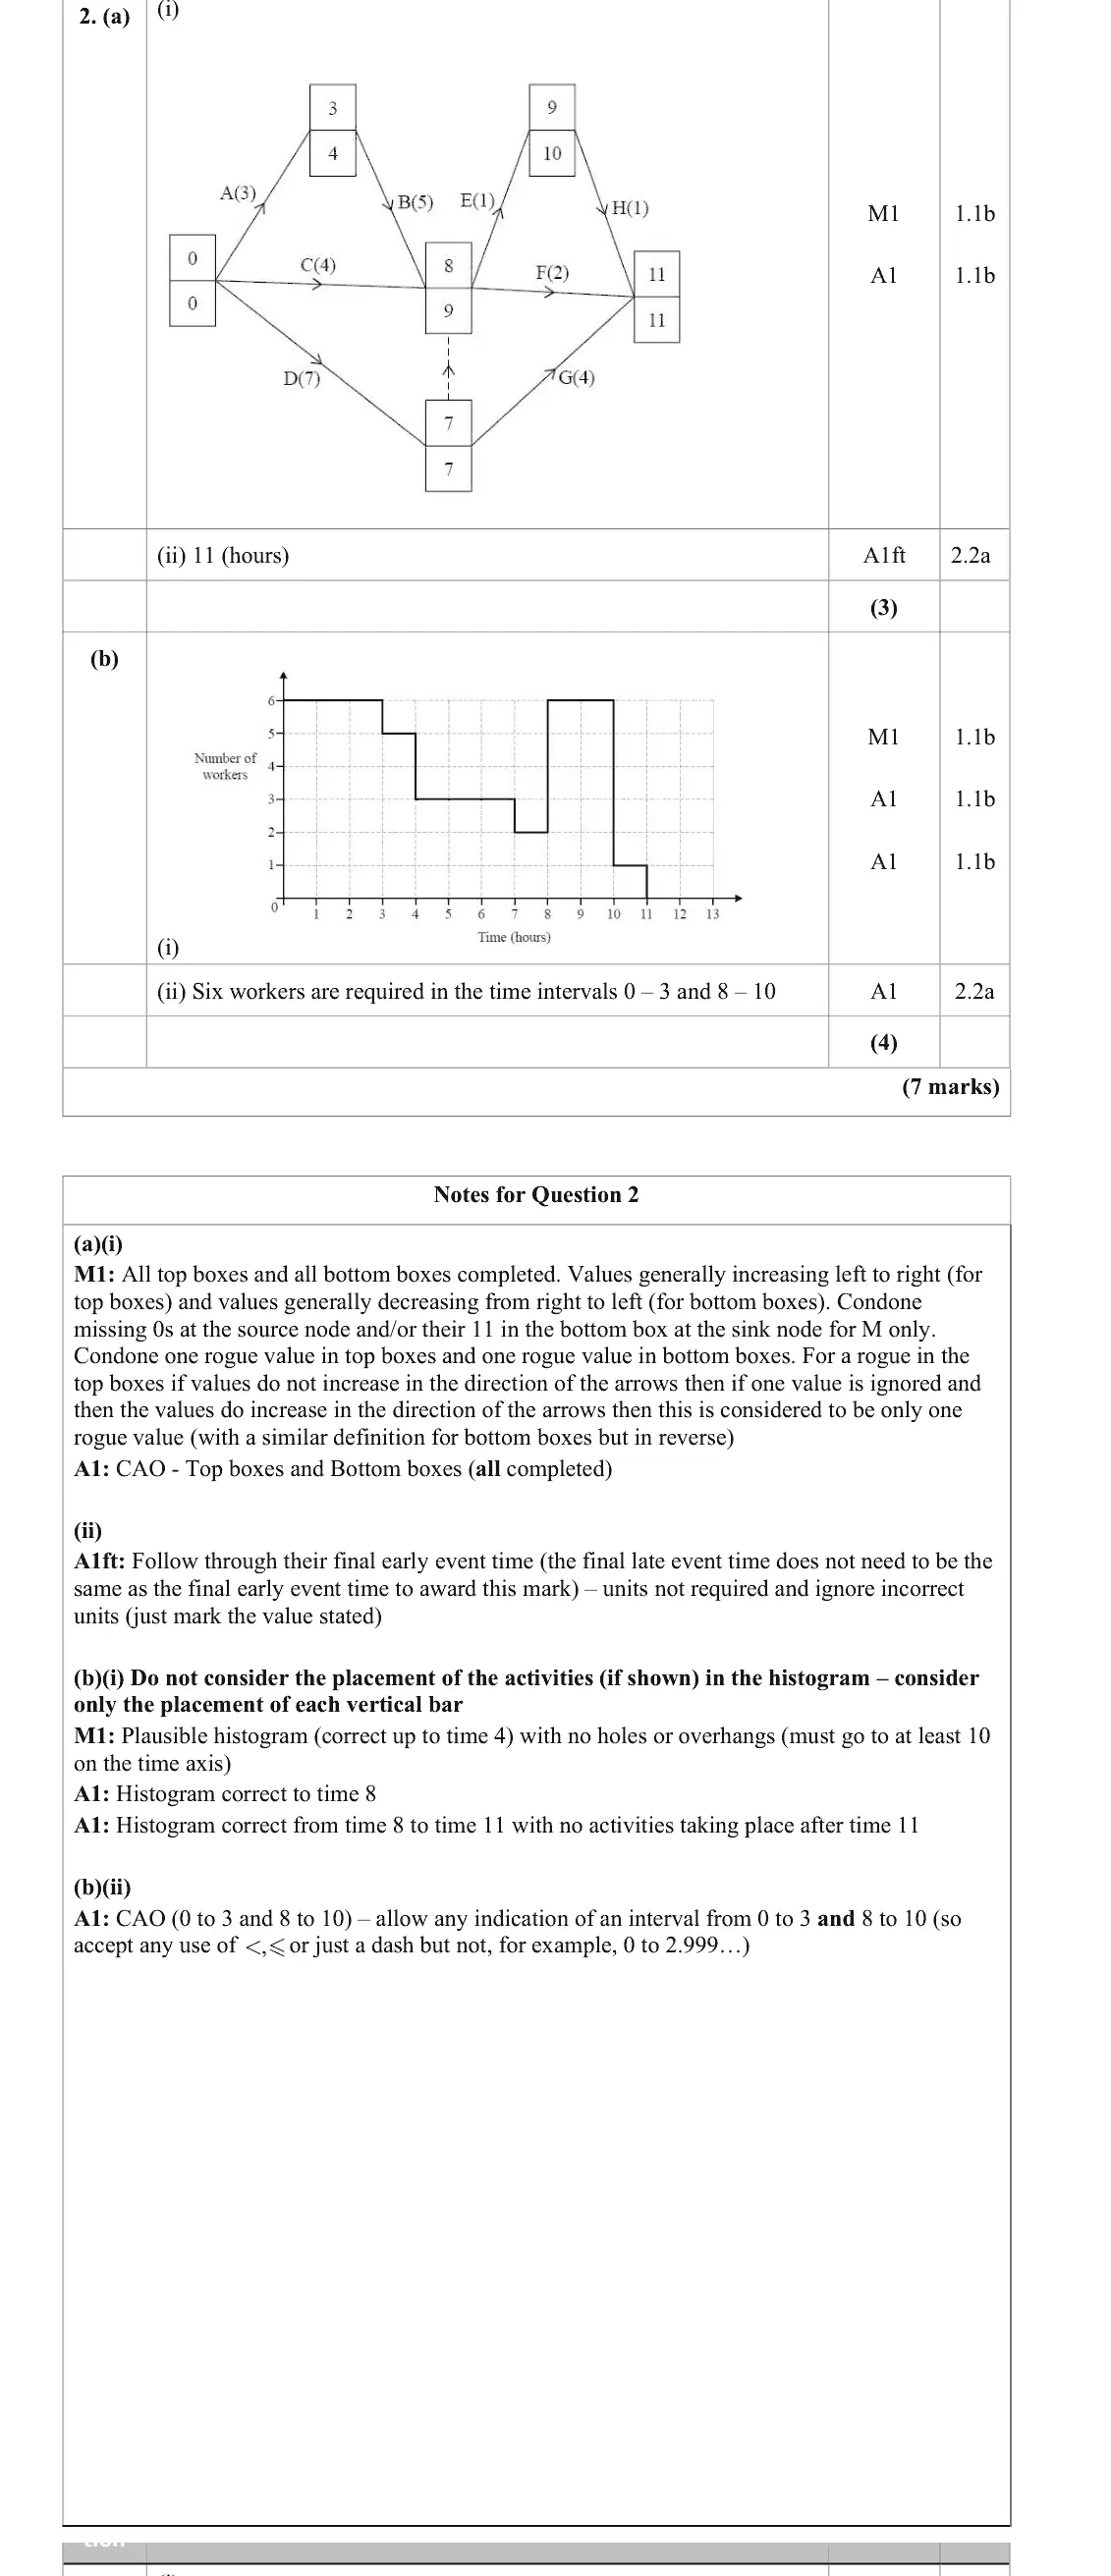
The table below lists the number of workers required for each activity in the project. Activity Number of workers A B C E F G H Each worker is able to do any of the activities. Once an activity is started it must be completed without interruption. It is given that each activity begins at its earliest possible start time. (b) (i) On Grid 1 in the answer book, draw a resource histogram to show the number of workers required at each time. (ii) Hence state the time interval(s) when six workers are required. (4)
June 2022 · Paper 3D (Decision 1) · Q5(e) 2 marks
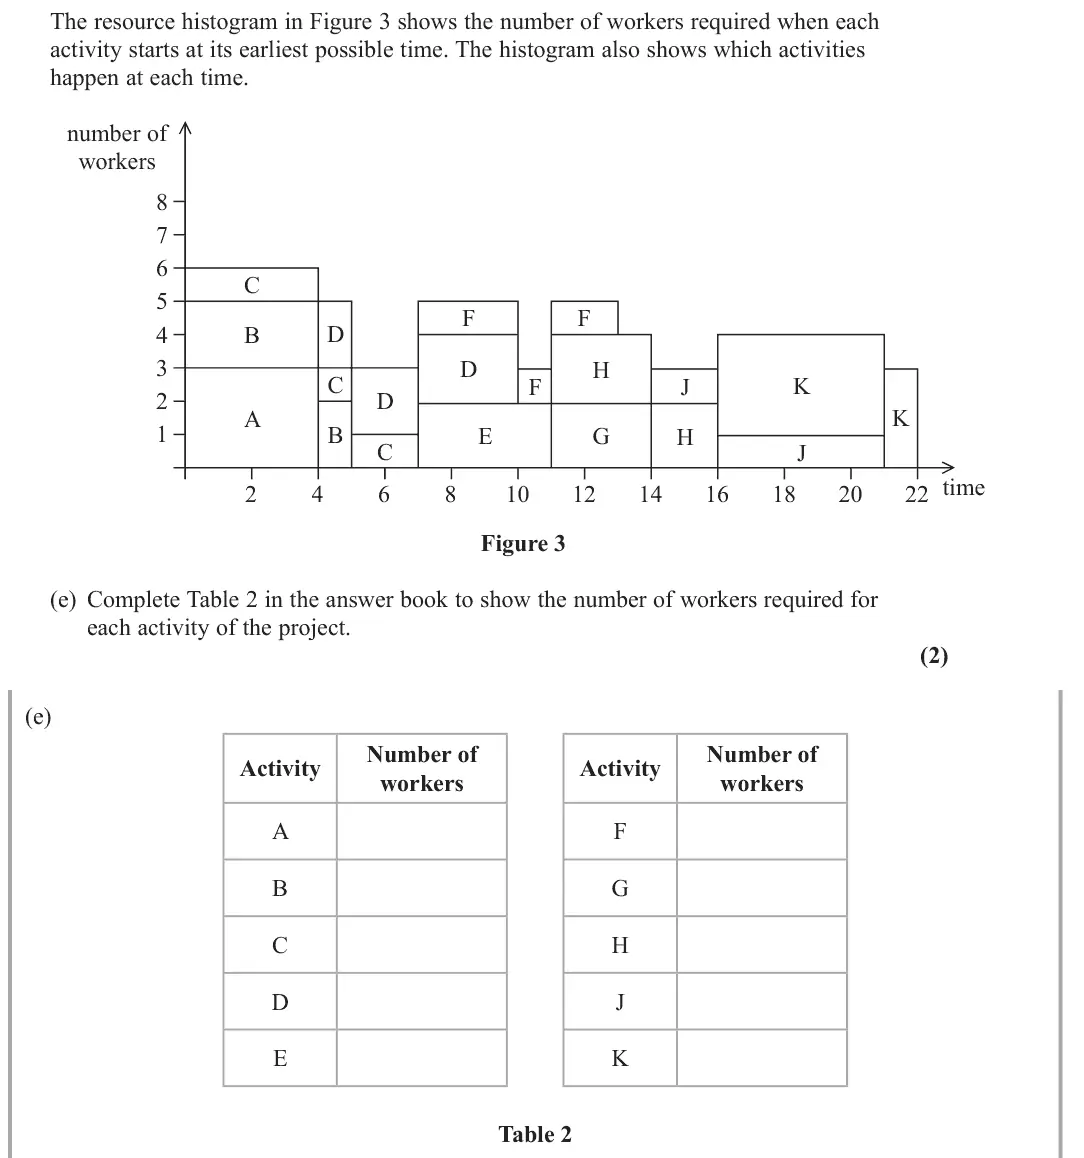
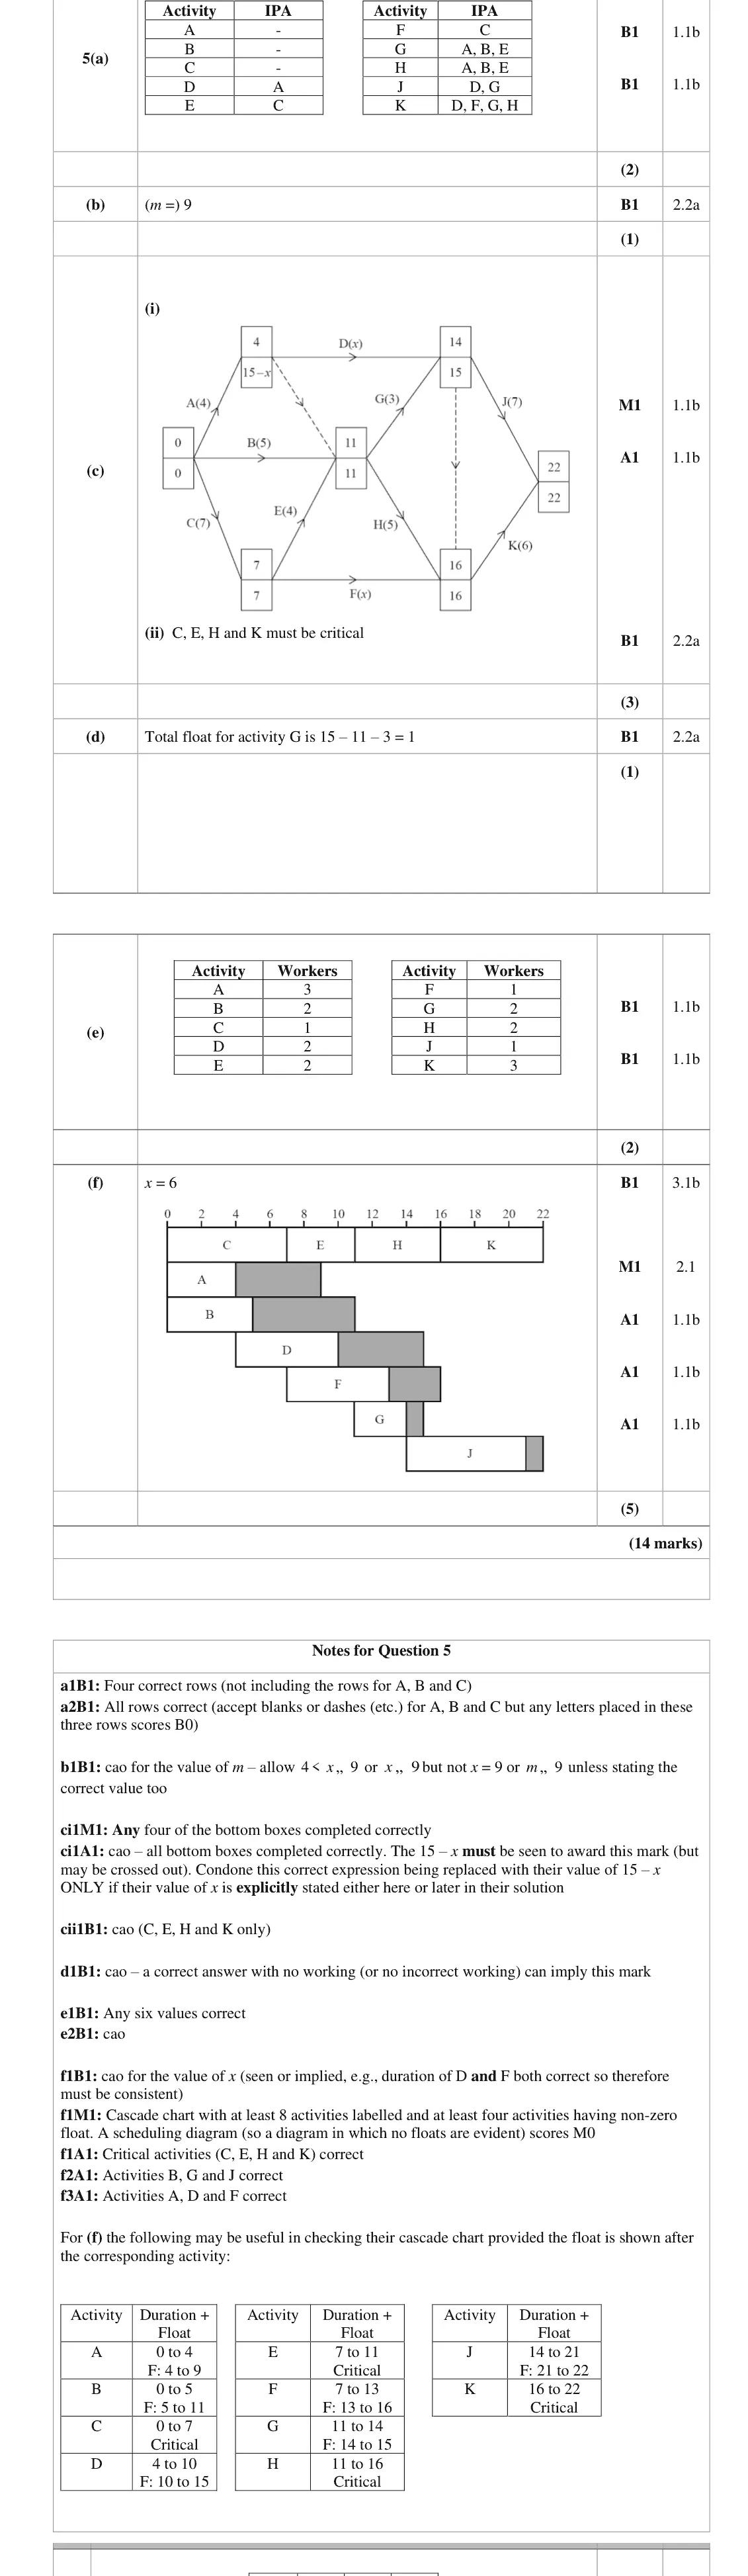
The resource histogram in Figure 3 shows the number of workers required when each activity starts at its earliest possible time. The histogram also shows which activities happen at each time. number of workers C F F B H C F J K K A B E G H C J 22 time Figure 3 (e) Complete Table 2 in the answer book to show the number of workers required for each activity of the project. (2)
June 2022 · Paper 3D (Decision 1) · Q5(f) 5 marks
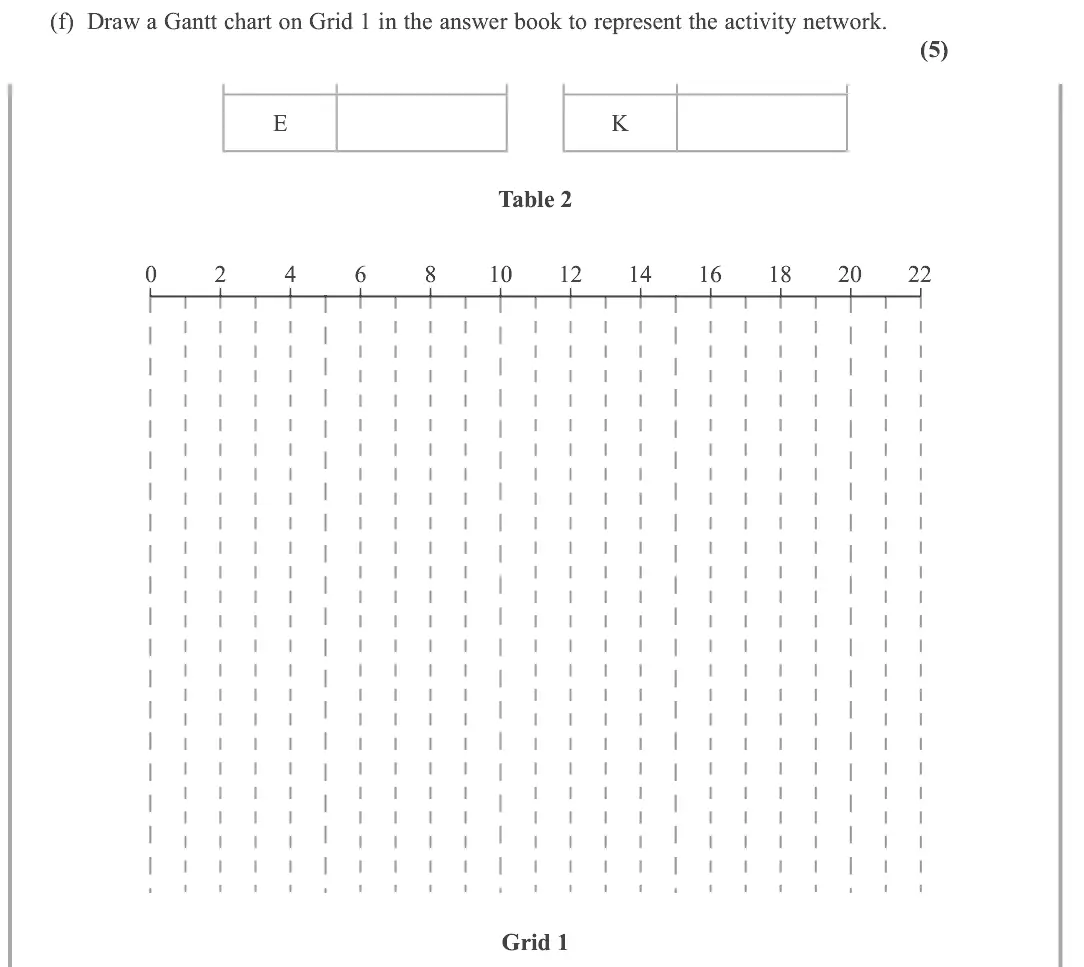
(f) Draw a Gantt chart on Grid 1 in the answer book to represent the activity network. (5)
Oct 2020 · Paper 3D (Decision 1) · Q2(d) 3 marks
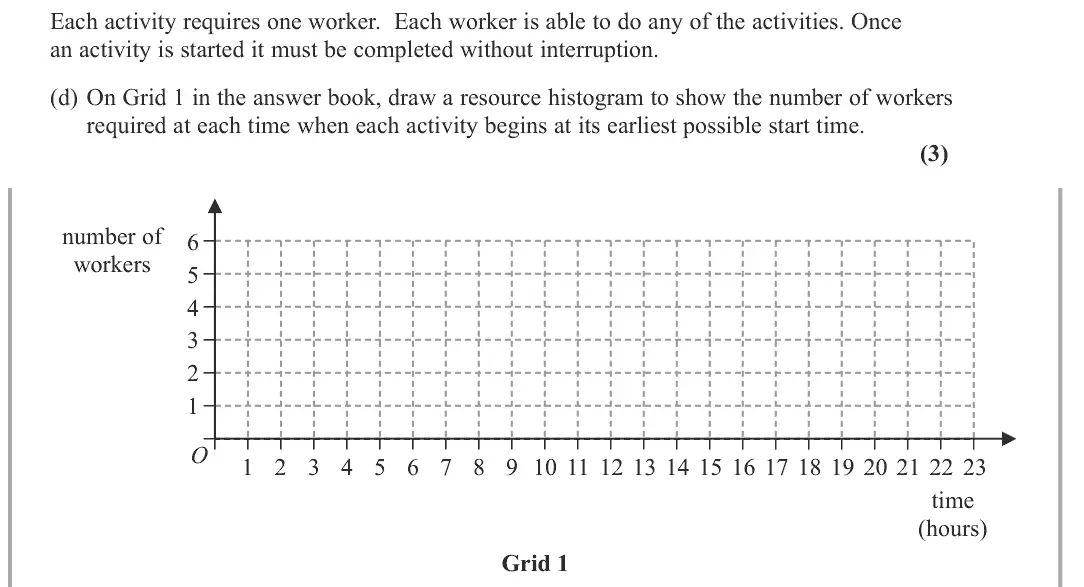
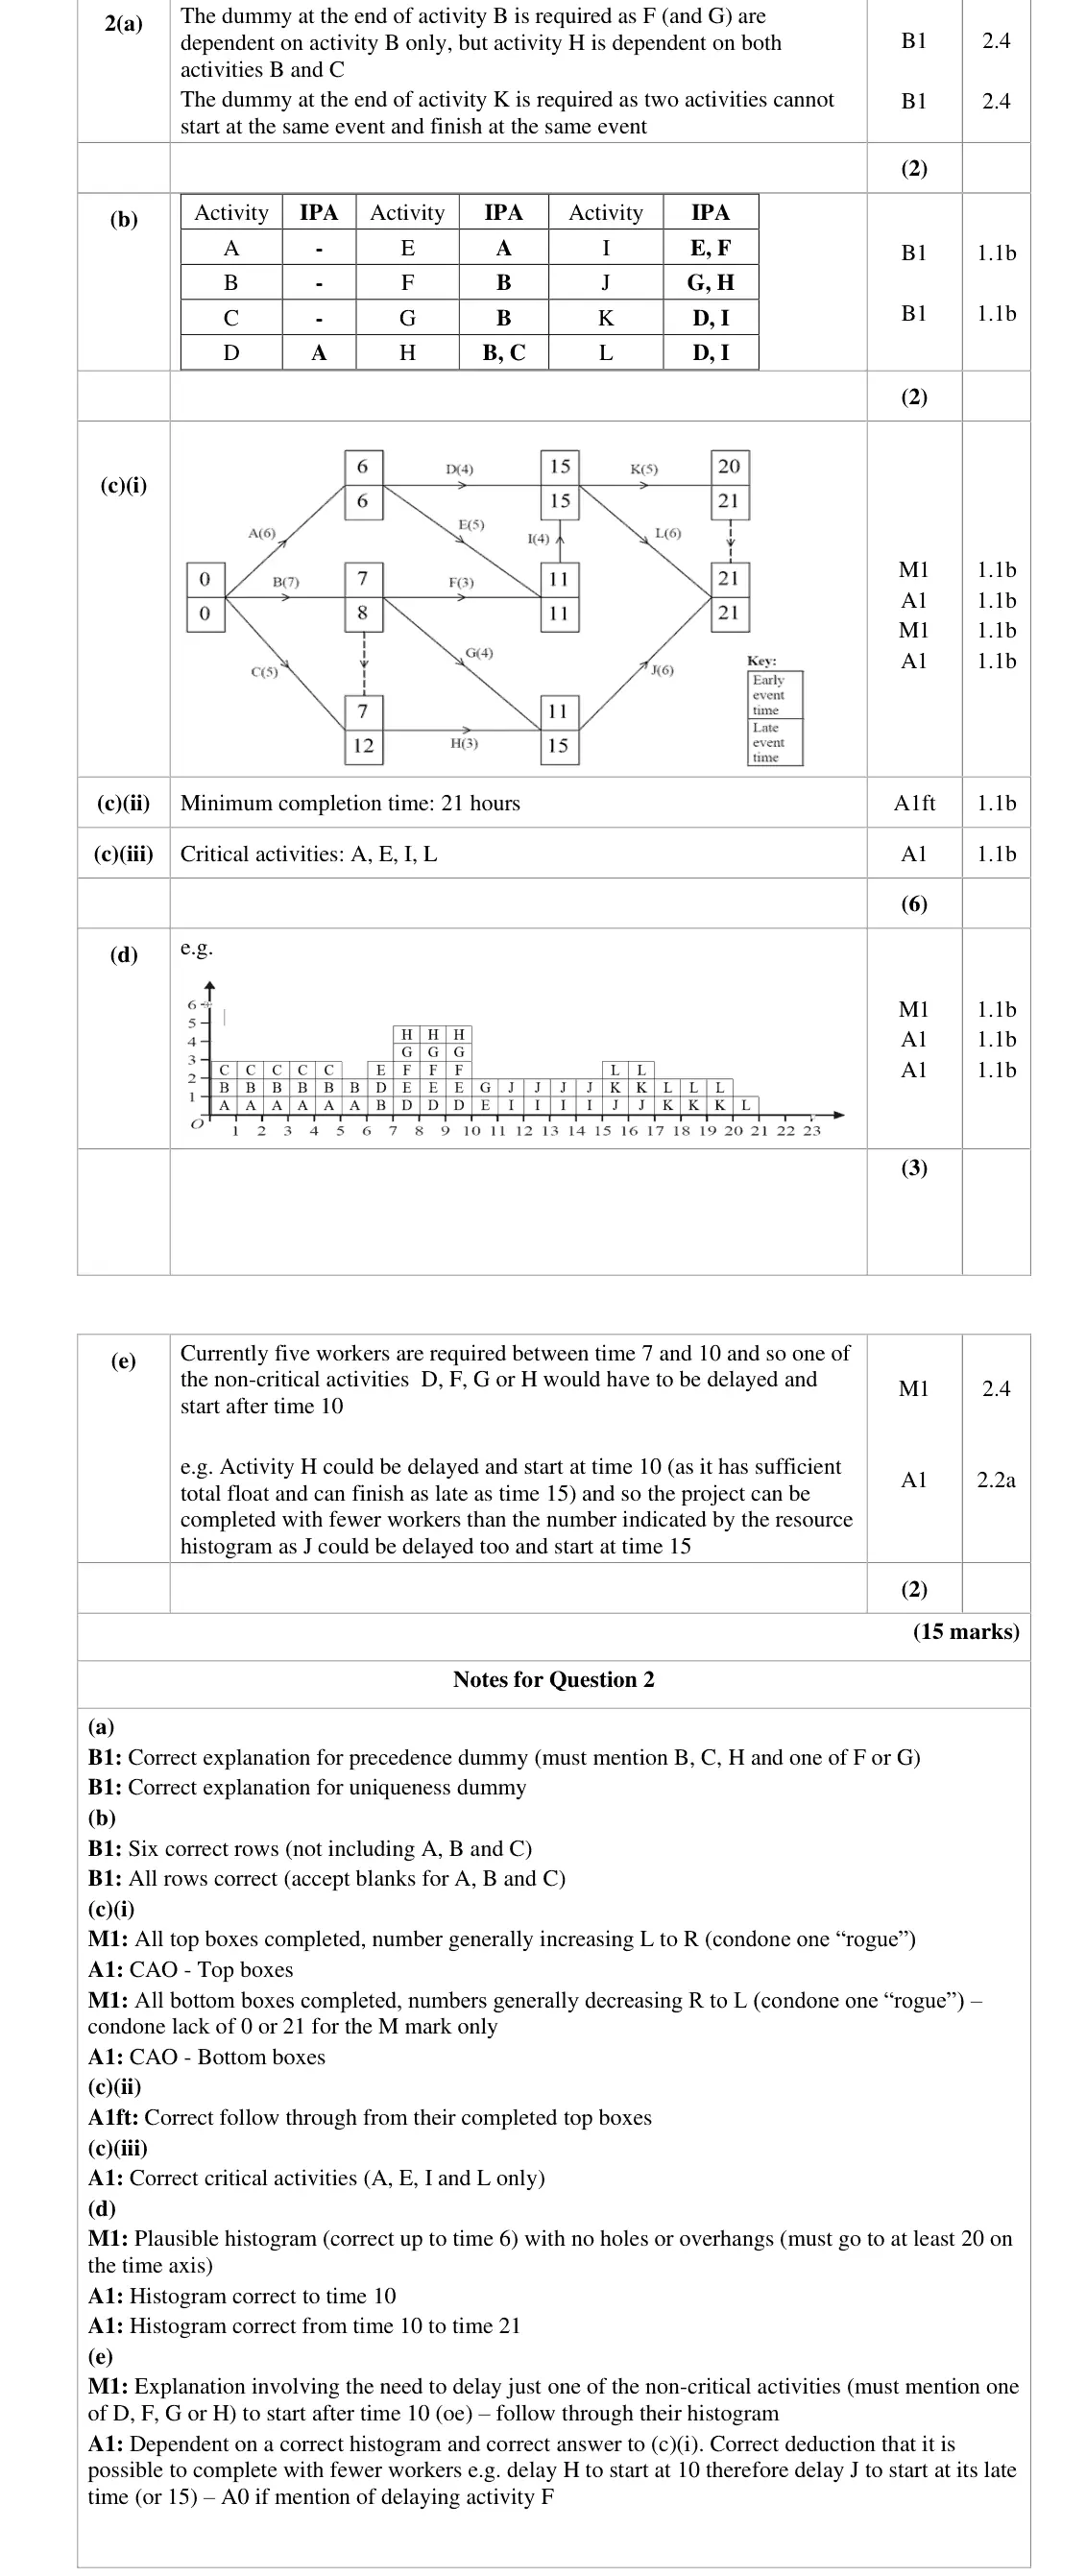
Each activity requires one worker. Each worker is able to do any of the activities. Once an activity is started it must be completed without interruption. (d) On Grid 1 in the answer book, draw a resource histogram to show the number of workers required at each time when each activity begins at its earliest possible start time. (3)
Oct 2020 · Paper 3D (Decision 1) · Q2(e) 2 marks
(e) Determine whether or not the project can be completed in the minimum possible time using fewer workers than the number indicated by the resource histogram in (d). You must justify your answer with reference to the resource histogram and the completed Diagram 1. (2)

Find an Edexcel Further Maths tutor

Stuck on this? Book a trial lesson with our Further Maths tutor.

Prefer email? Send an enquiry

If you are under 18, please include a parent's contact details. Enquiries go to enquiries@alevelfurthermathstutor.com and are deleted once handled.