Notes, worked examples and practice for this topic are being written by our tutors. The past-paper questions below are ready now: work each one on paper, then open the mark scheme and the examiner's comment.
Tap a question to zoom it. Mark scheme and examiner's comment open under each question.
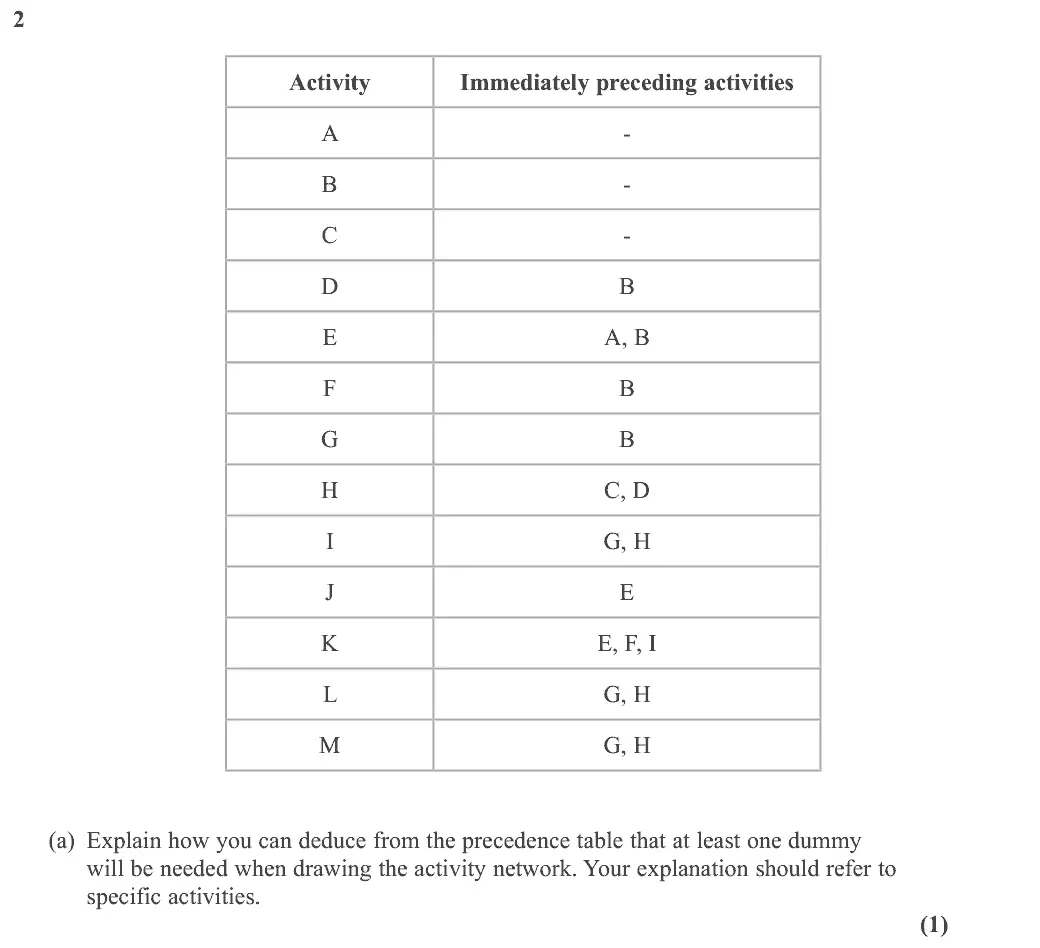
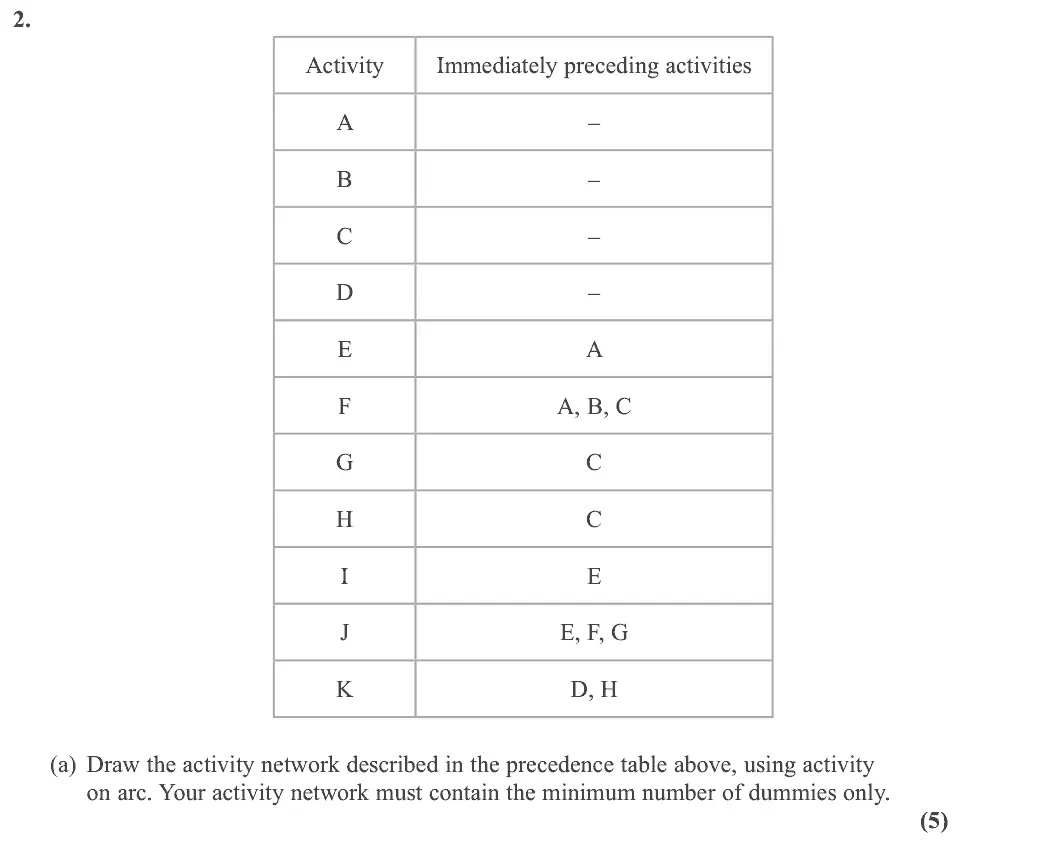
June 2025 · AS Paper 2 (Decision 1) · Q2(a)1 mark
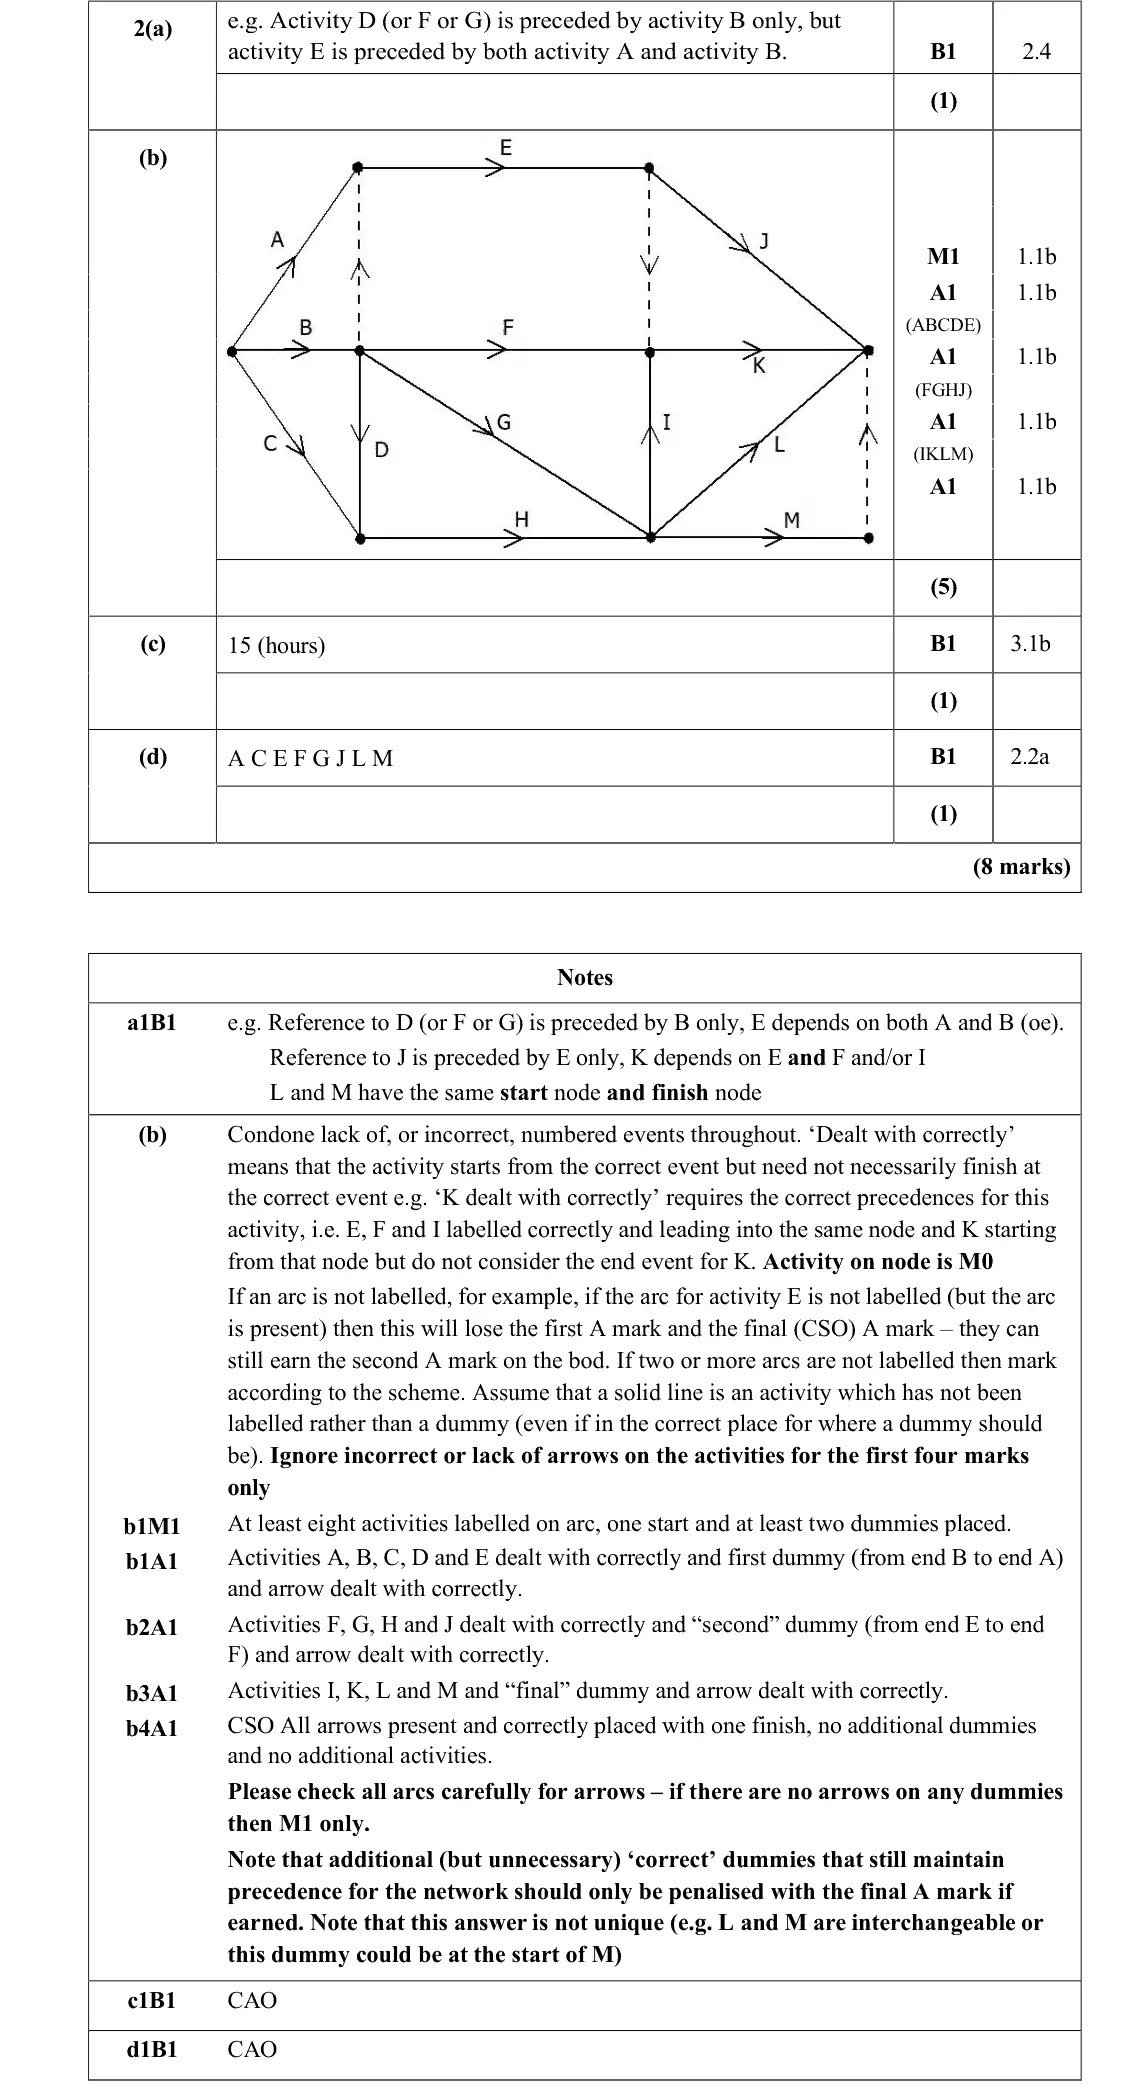
Mark scheme (whole question; this part is marked with the orange bar)
Examiner's comment
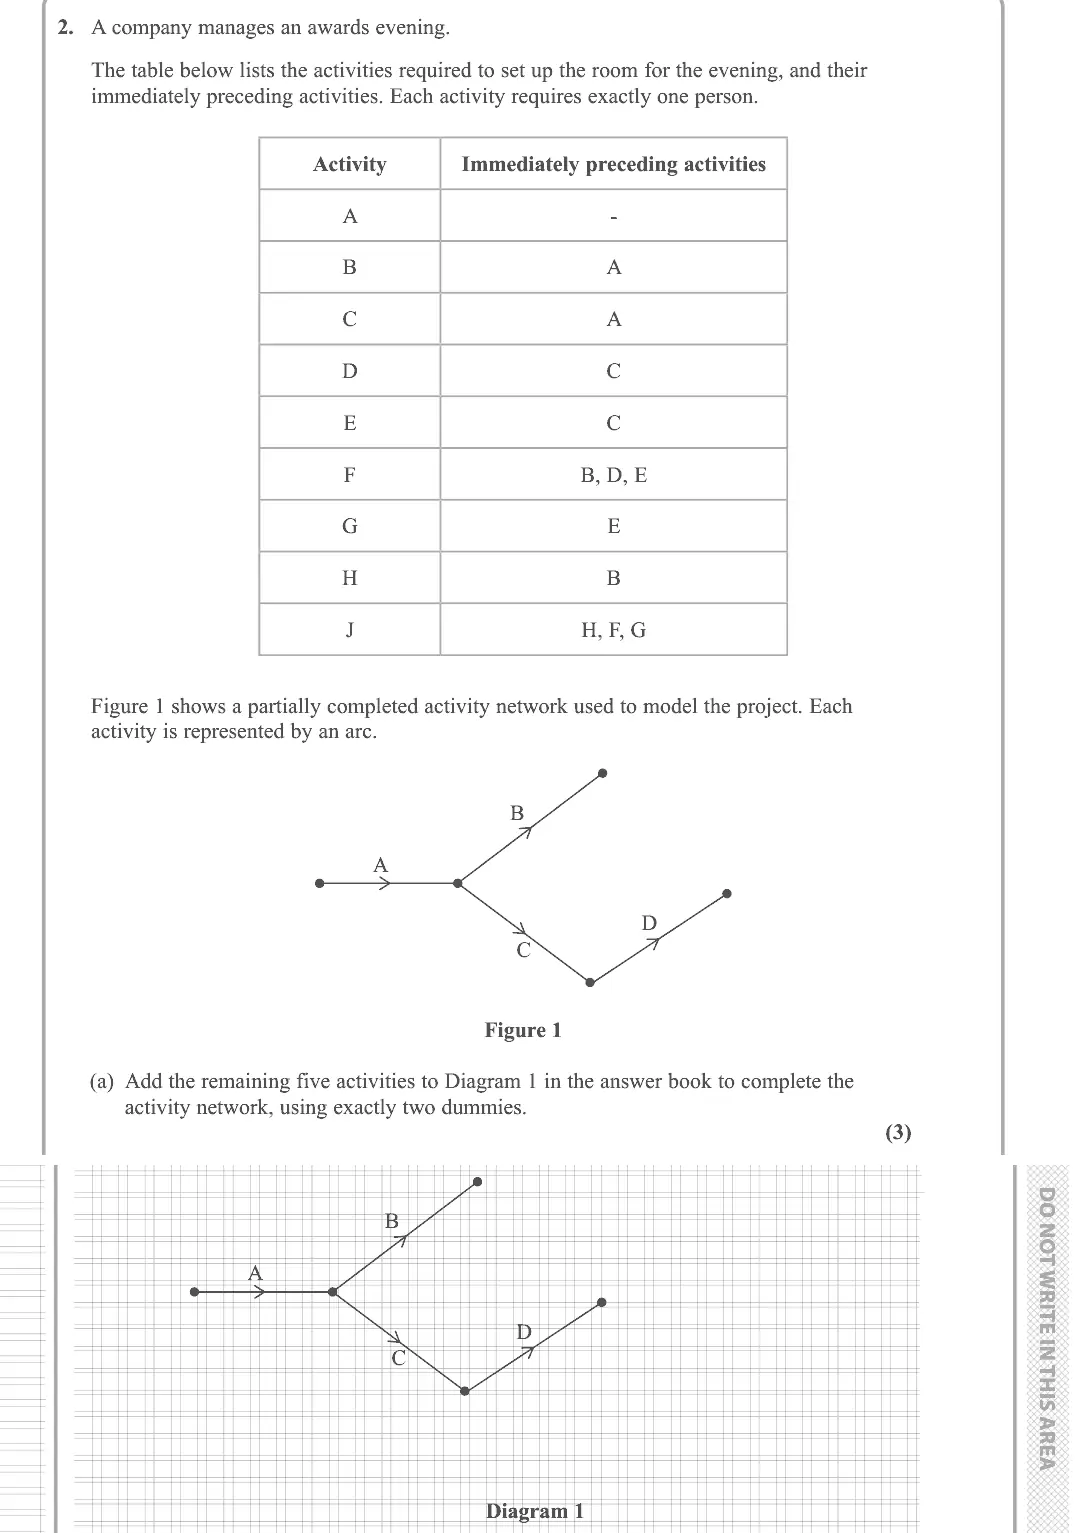
The first two parts of this question were very standard definitions and procedures and therefore very accessible to all learners, however the advanced understanding required for the final two parts were able to clearly discriminate between learners who could follow procedure and those at the higher end of the scoring scale who really understood it. Part a) was generally well answered with a majority of learners scoring this mark for a correct explanation. The most common non-scoring response was to only consider the dependency of E on A and B, which was not acceptable in the context of the whole network. Those attempting to use the unique argument sometimes failed to mention both the start and end notes, and a loss of the B mark in this question was often due to lack of accuracy rather than a wrong idea. Part b) was generally very well drawn overall, with a large number of responses scoring full marks. The most common error was to share the same start and end node for L and M, thus losing the last two marks, otherwise learners handled the network well (though some of the responses were not user-friendly to navigate. A small number of activity-on-node responses were attempted; learners should be aware that this scores no marks. A few did not have a single start node, which also scored no marks. Lack of arrows on the dummies caused some to gain only the M mark. A more common error tended to be either the lack of Activity J, or additional activities when the candidate’s lines were not long enough or they used additional dummies. Part c) was answered correctly on approximately half of the scripts. It was still well attempted, however a full range of multiples of 3 seen from 9 to 39 which demonstrated a lack of understanding of this particular application. Part d) was only answered correctly by the most able learners. Those that did get 15 generally found at least some of the non-critical activities, often listing only a small number of the required list. Those that first identified the critical path generally found the full set.
Key points from the mark scheme and examiner's report
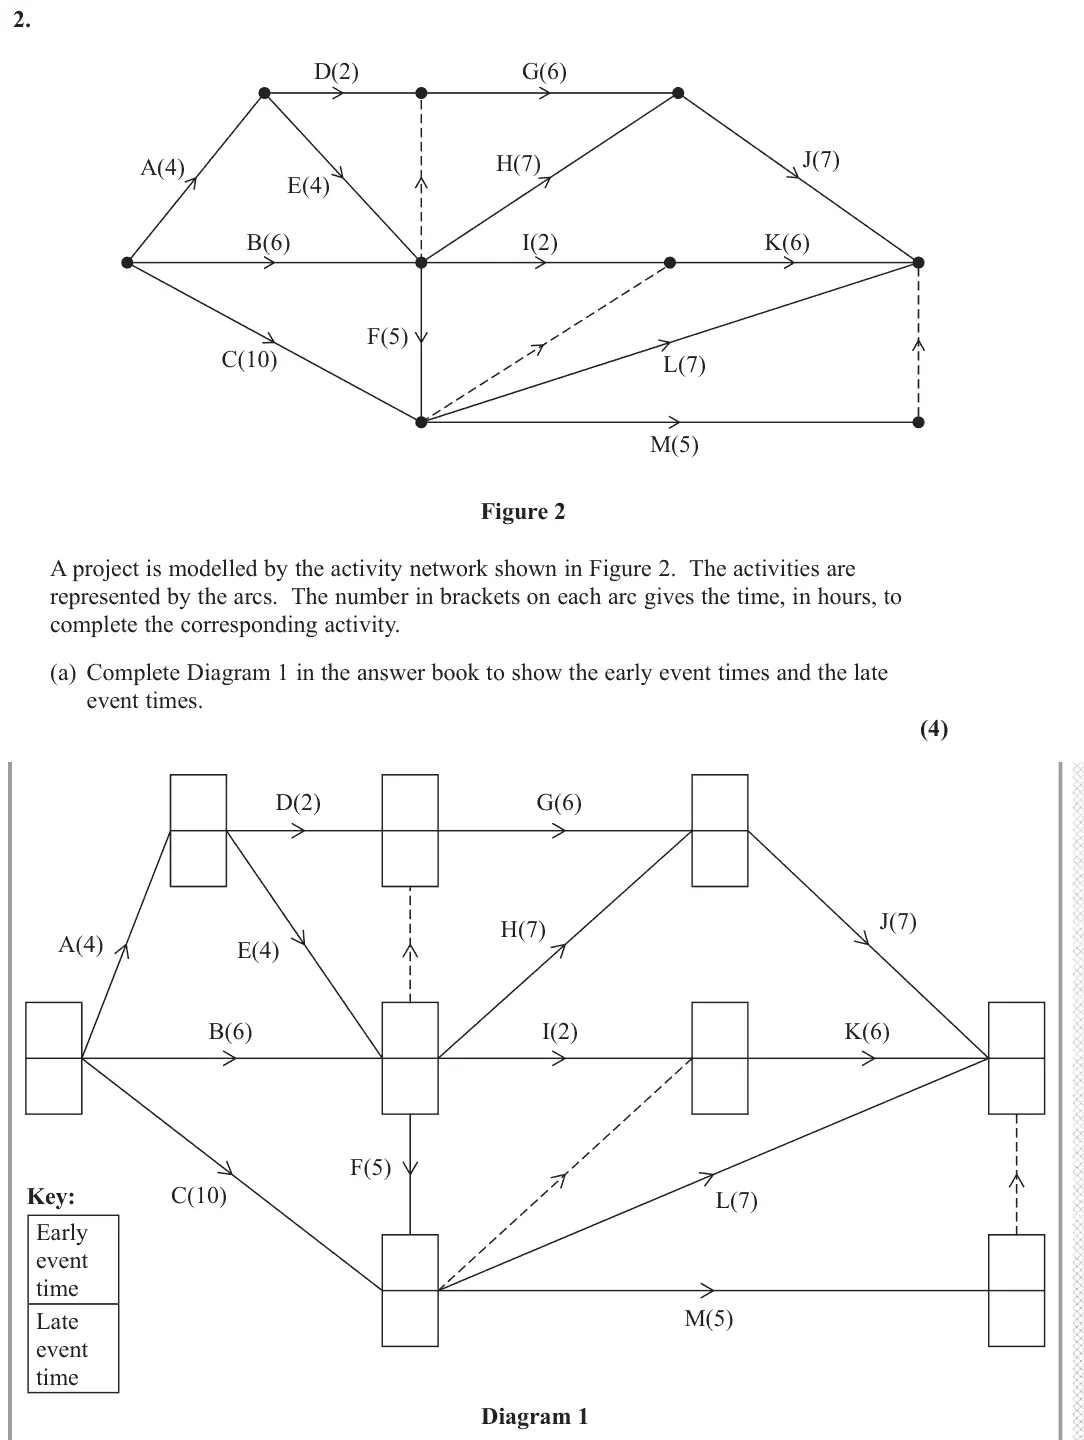
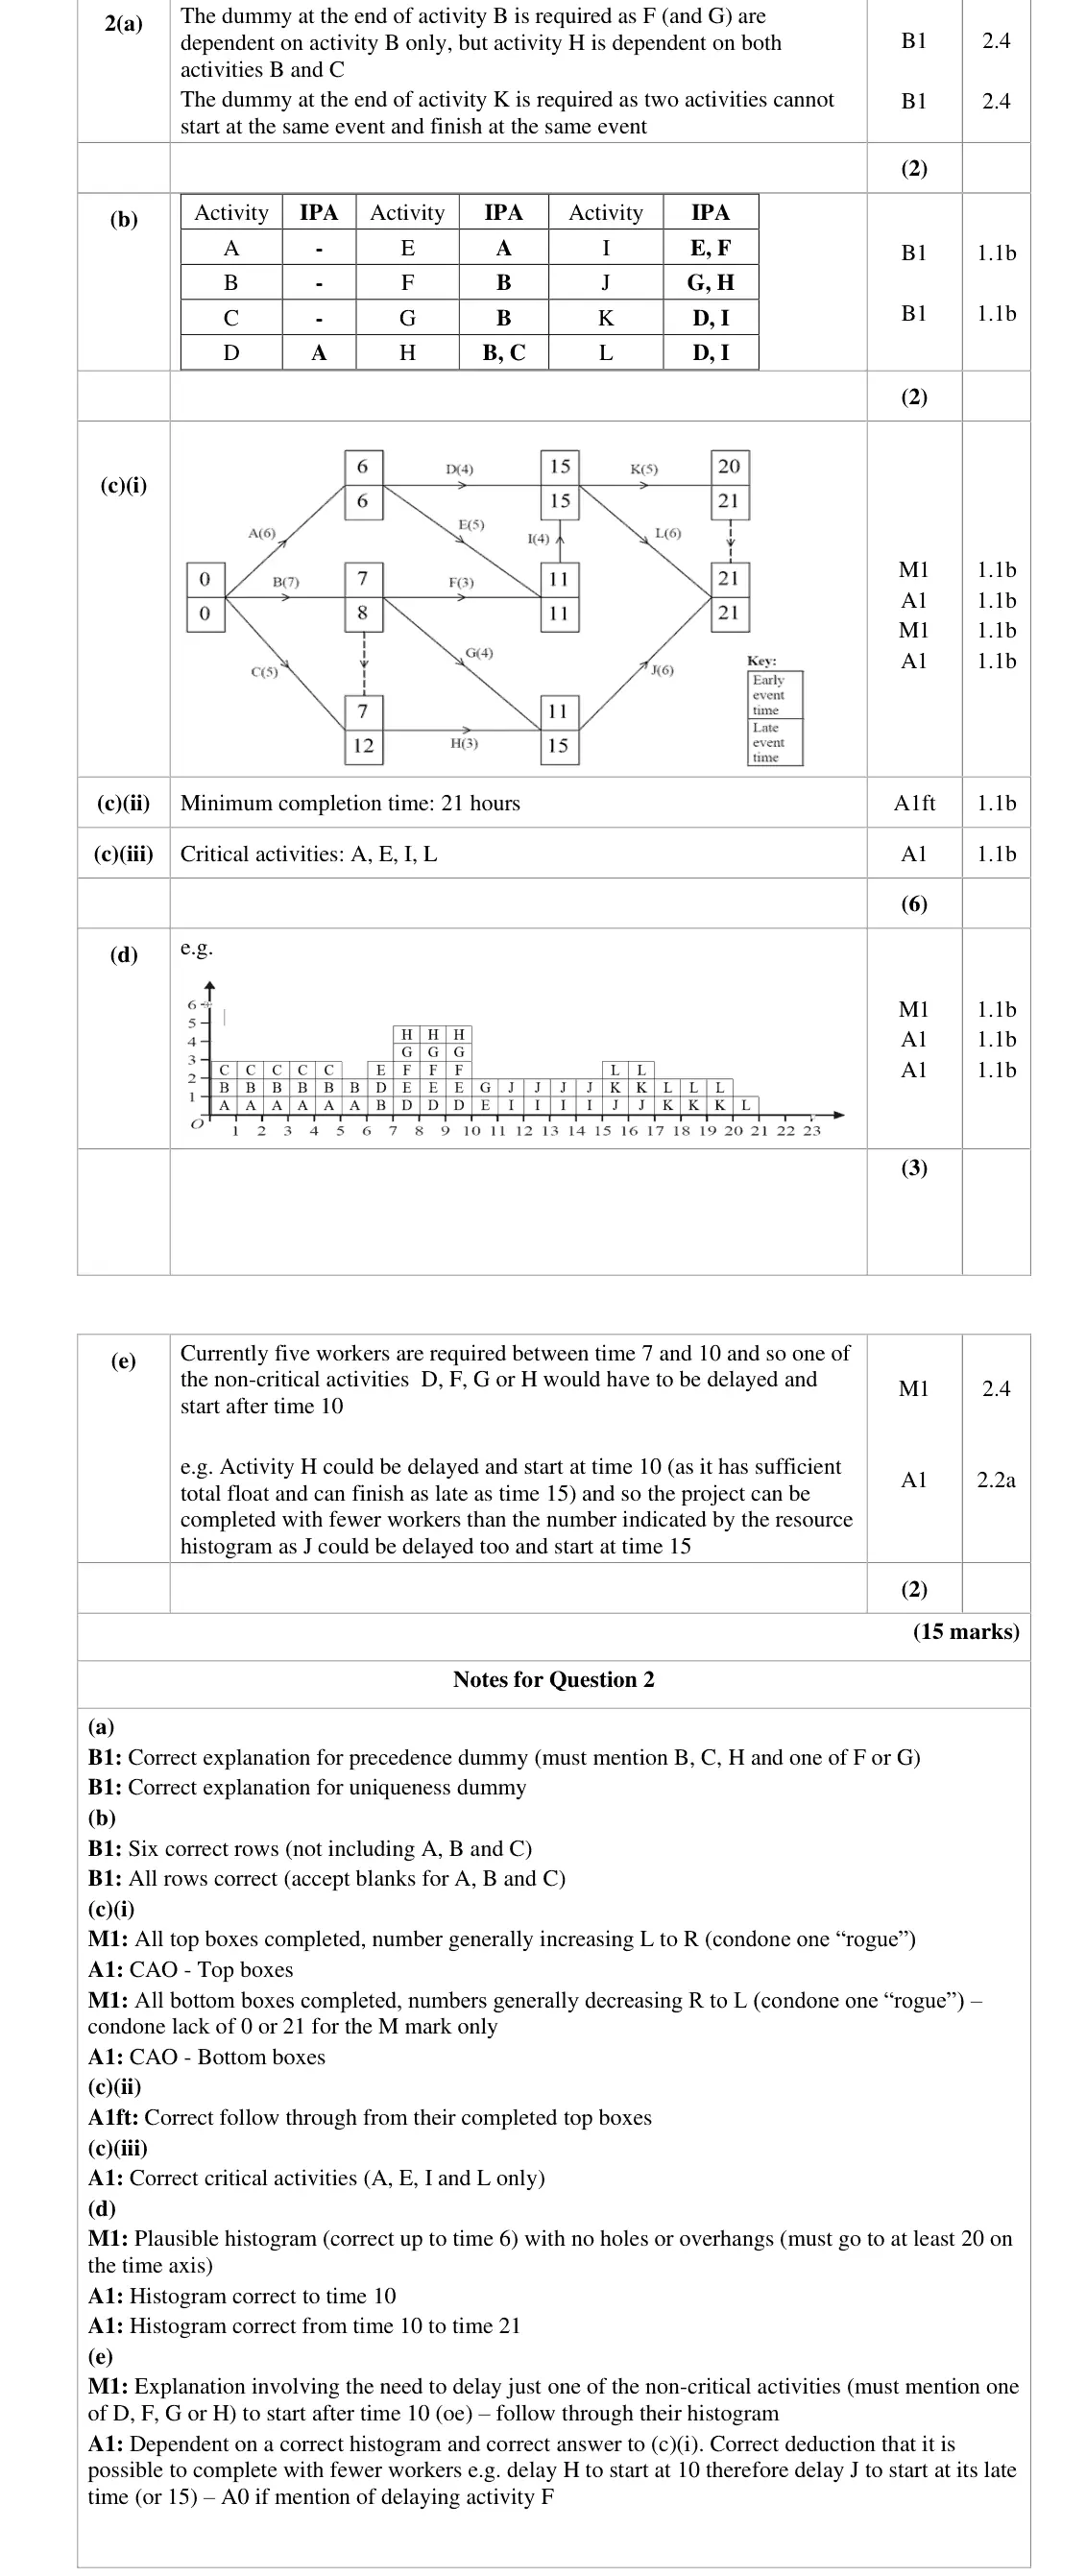
D (or F or G) depends on B only but E depends on A and B (or L and M share start and end events)
must refer to specific activities
E on A and B alone is not enough
June 2025 · AS Paper 2 (Decision 1) · Q2(b)5 marks
Mark scheme (whole question; this part is marked with the orange bar)
Examiner's comment
The first two parts of this question were very standard definitions and procedures and therefore very accessible to all learners, however the advanced understanding required for the final two parts were able to clearly discriminate between learners who could follow procedure and those at the higher end of the scoring scale who really understood it. Part a) was generally well answered with a majority of learners scoring this mark for a correct explanation. The most common non-scoring response was to only consider the dependency of E on A and B, which was not acceptable in the context of the whole network. Those attempting to use the unique argument sometimes failed to mention both the start and end notes, and a loss of the B mark in this question was often due to lack of accuracy rather than a wrong idea. Part b) was generally very well drawn overall, with a large number of responses scoring full marks. The most common error was to share the same start and end node for L and M, thus losing the last two marks, otherwise learners handled the network well (though some of the responses were not user-friendly to navigate. A small number of activity-on-node responses were attempted; learners should be aware that this scores no marks. A few did not have a single start node, which also scored no marks. Lack of arrows on the dummies caused some to gain only the M mark. A more common error tended to be either the lack of Activity J, or additional activities when the candidate’s lines were not long enough or they used additional dummies. Part c) was answered correctly on approximately half of the scripts. It was still well attempted, however a full range of multiples of 3 seen from 9 to 39 which demonstrated a lack of understanding of this particular application. Part d) was only answered correctly by the most able learners. Those that did get 15 generally found at least some of the non-critical activities, often listing only a small number of the required list. Those that first identified the critical path generally found the full set.
Key points from the mark scheme and examiner's report
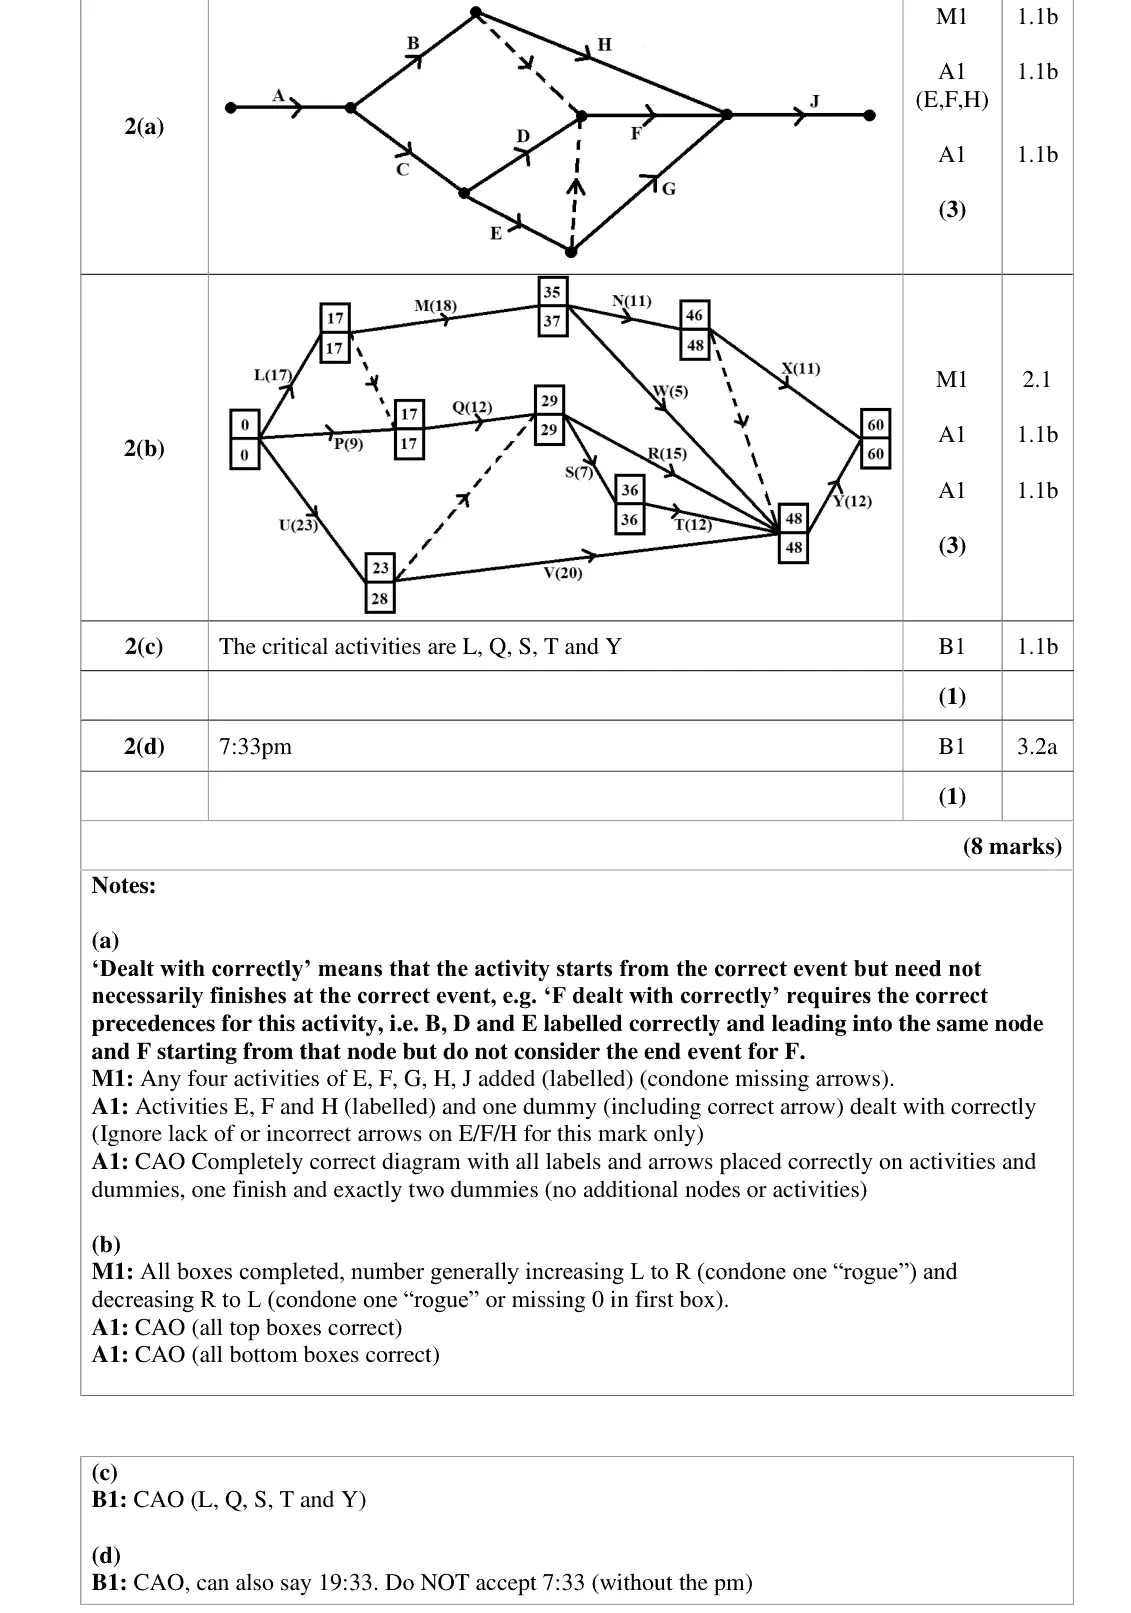
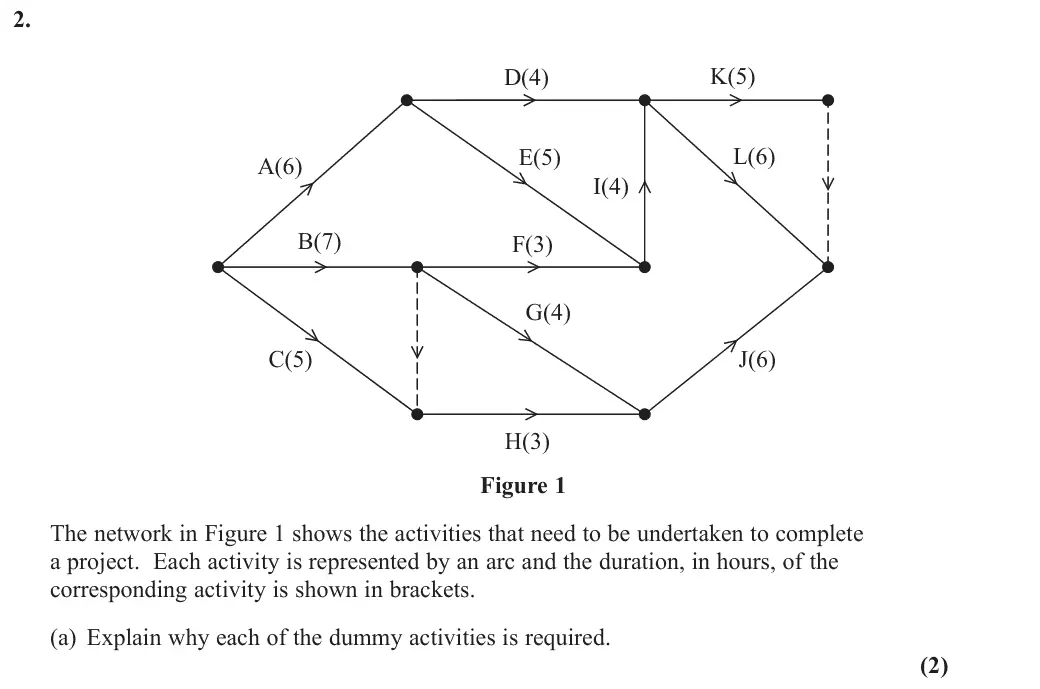
activity on arc with three dummies (end of B to end of A, end of E to end of F, and one to separate L and M)
L and M sharing both nodes lost two marks
activity on node or more than one start scores 0
J often missing
June 2025 · AS Paper 2 (Decision 1) · Q2(c)1 mark
Mark scheme (whole question; this part is marked with the orange bar)
Examiner's comment
The first two parts of this question were very standard definitions and procedures and therefore very accessible to all learners, however the advanced understanding required for the final two parts were able to clearly discriminate between learners who could follow procedure and those at the higher end of the scoring scale who really understood it. Part a) was generally well answered with a majority of learners scoring this mark for a correct explanation. The most common non-scoring response was to only consider the dependency of E on A and B, which was not acceptable in the context of the whole network. Those attempting to use the unique argument sometimes failed to mention both the start and end notes, and a loss of the B mark in this question was often due to lack of accuracy rather than a wrong idea. Part b) was generally very well drawn overall, with a large number of responses scoring full marks. The most common error was to share the same start and end node for L and M, thus losing the last two marks, otherwise learners handled the network well (though some of the responses were not user-friendly to navigate. A small number of activity-on-node responses were attempted; learners should be aware that this scores no marks. A few did not have a single start node, which also scored no marks. Lack of arrows on the dummies caused some to gain only the M mark. A more common error tended to be either the lack of Activity J, or additional activities when the candidate’s lines were not long enough or they used additional dummies. Part c) was answered correctly on approximately half of the scripts. It was still well attempted, however a full range of multiples of 3 seen from 9 to 39 which demonstrated a lack of understanding of this particular application. Part d) was only answered correctly by the most able learners. Those that did get 15 generally found at least some of the non-critical activities, often listing only a small number of the required list. Those that first identified the critical path generally found the full set.
Key points from the mark scheme and examiner's report
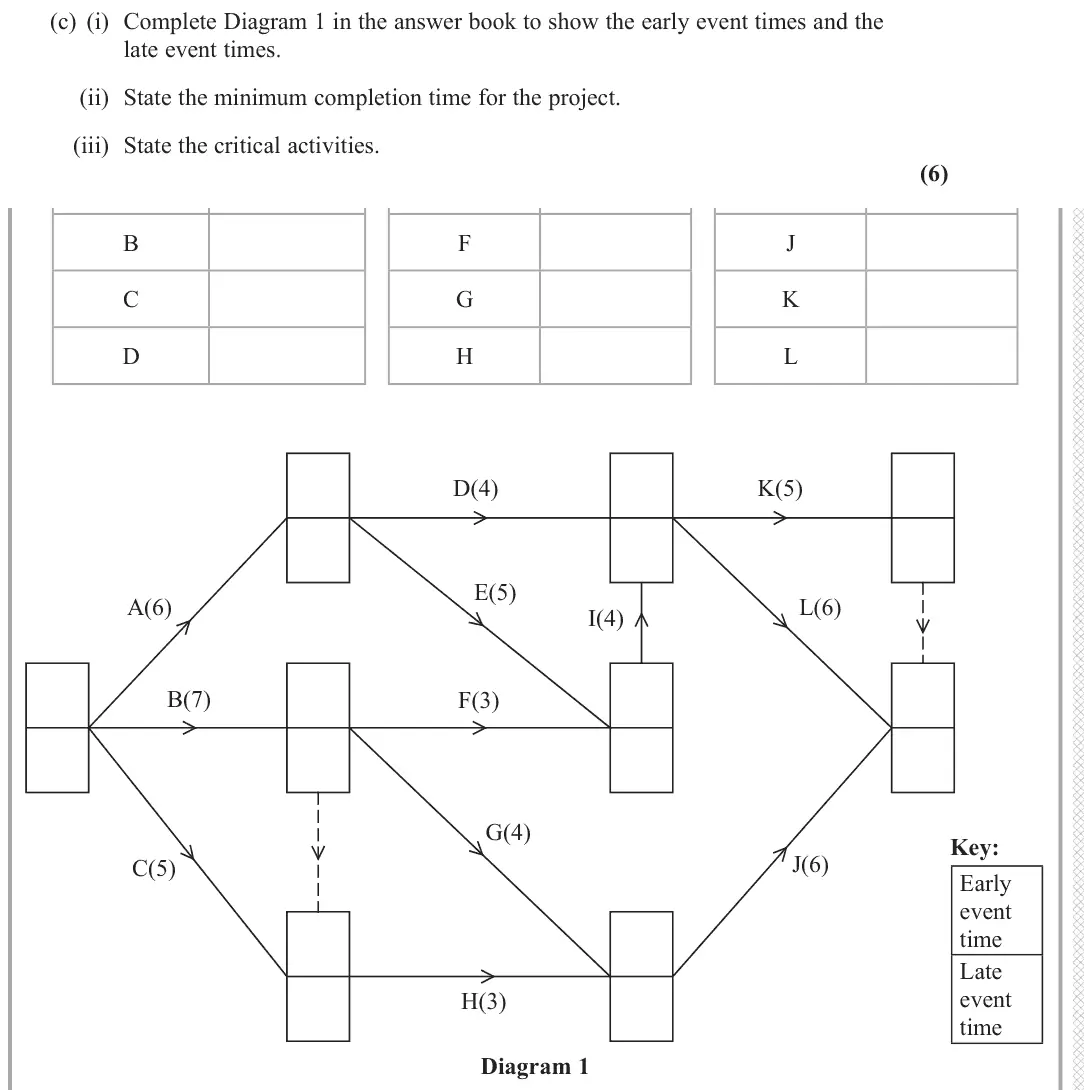
longest path has five activities (B, D, H, I, K): 5 × 3 = 15 hours
any multiple of 3 from 9 to 39 seen
June 2025 · AS Paper 2 (Decision 1) · Q2(d)1 mark
Mark scheme (whole question; this part is marked with the orange bar)
Examiner's comment
The first two parts of this question were very standard definitions and procedures and therefore very accessible to all learners, however the advanced understanding required for the final two parts were able to clearly discriminate between learners who could follow procedure and those at the higher end of the scoring scale who really understood it. Part a) was generally well answered with a majority of learners scoring this mark for a correct explanation. The most common non-scoring response was to only consider the dependency of E on A and B, which was not acceptable in the context of the whole network. Those attempting to use the unique argument sometimes failed to mention both the start and end notes, and a loss of the B mark in this question was often due to lack of accuracy rather than a wrong idea. Part b) was generally very well drawn overall, with a large number of responses scoring full marks. The most common error was to share the same start and end node for L and M, thus losing the last two marks, otherwise learners handled the network well (though some of the responses were not user-friendly to navigate. A small number of activity-on-node responses were attempted; learners should be aware that this scores no marks. A few did not have a single start node, which also scored no marks. Lack of arrows on the dummies caused some to gain only the M mark. A more common error tended to be either the lack of Activity J, or additional activities when the candidate’s lines were not long enough or they used additional dummies. Part c) was answered correctly on approximately half of the scripts. It was still well attempted, however a full range of multiples of 3 seen from 9 to 39 which demonstrated a lack of understanding of this particular application. Part d) was only answered correctly by the most able learners. Those that did get 15 generally found at least some of the non-critical activities, often listing only a small number of the required list. Those that first identified the critical path generally found the full set.
Key points from the mark scheme and examiner's report
activities with float of at least 1 hour, i.e. all non-critical: A, C, E, F, G, J, L, M
easiest after finding the critical path B, D, H, I, K
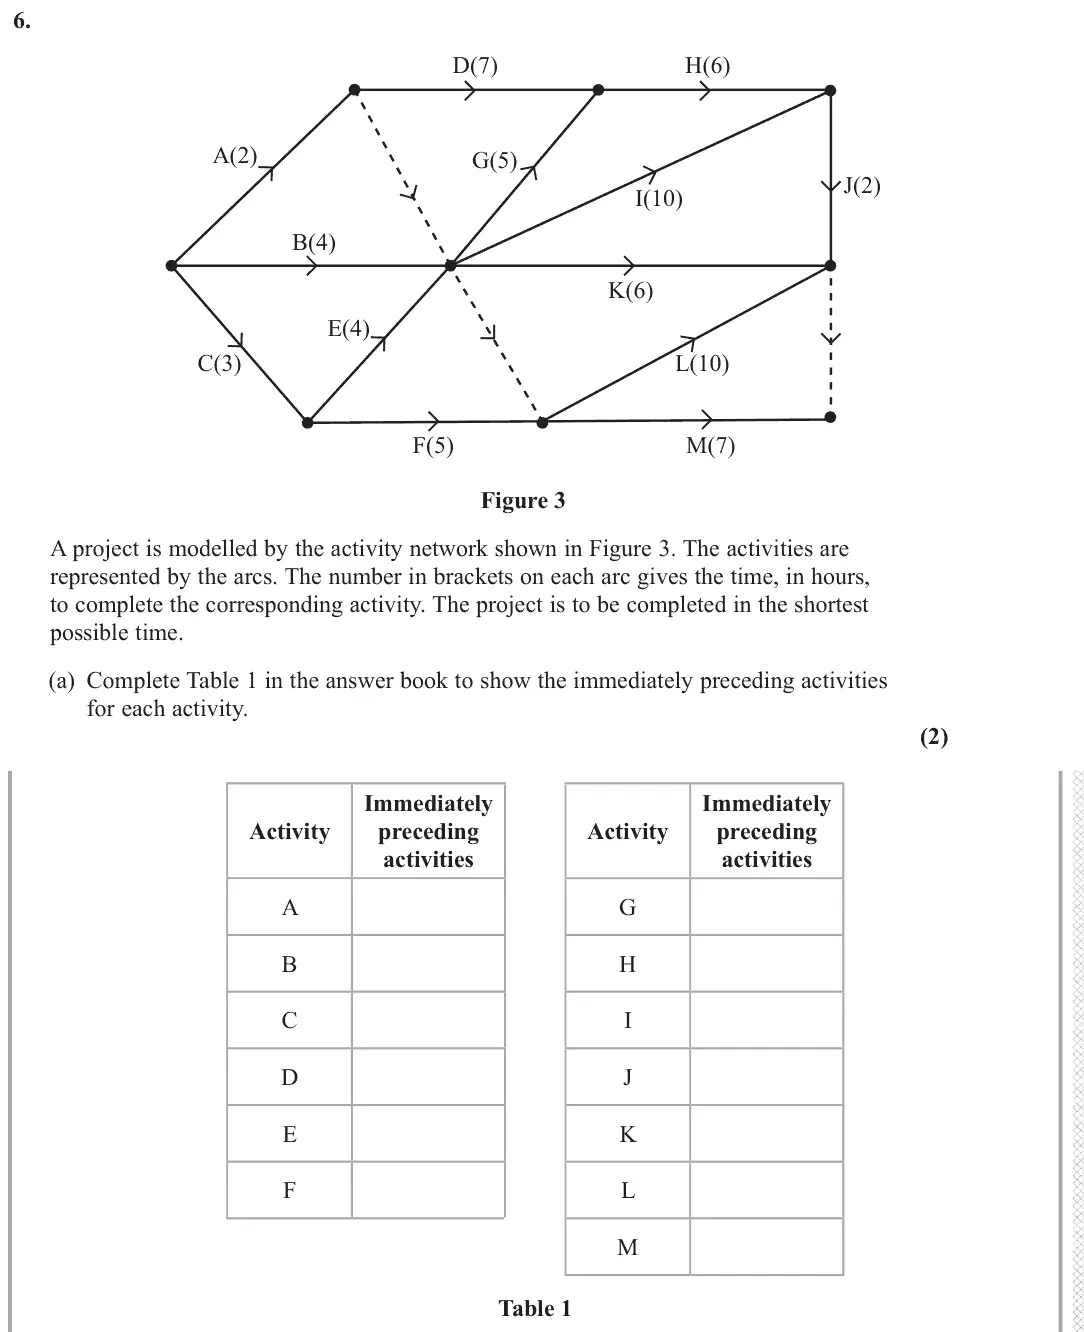
June 2025 · Paper 3D (Decision 1) · Q6(a)2 marks
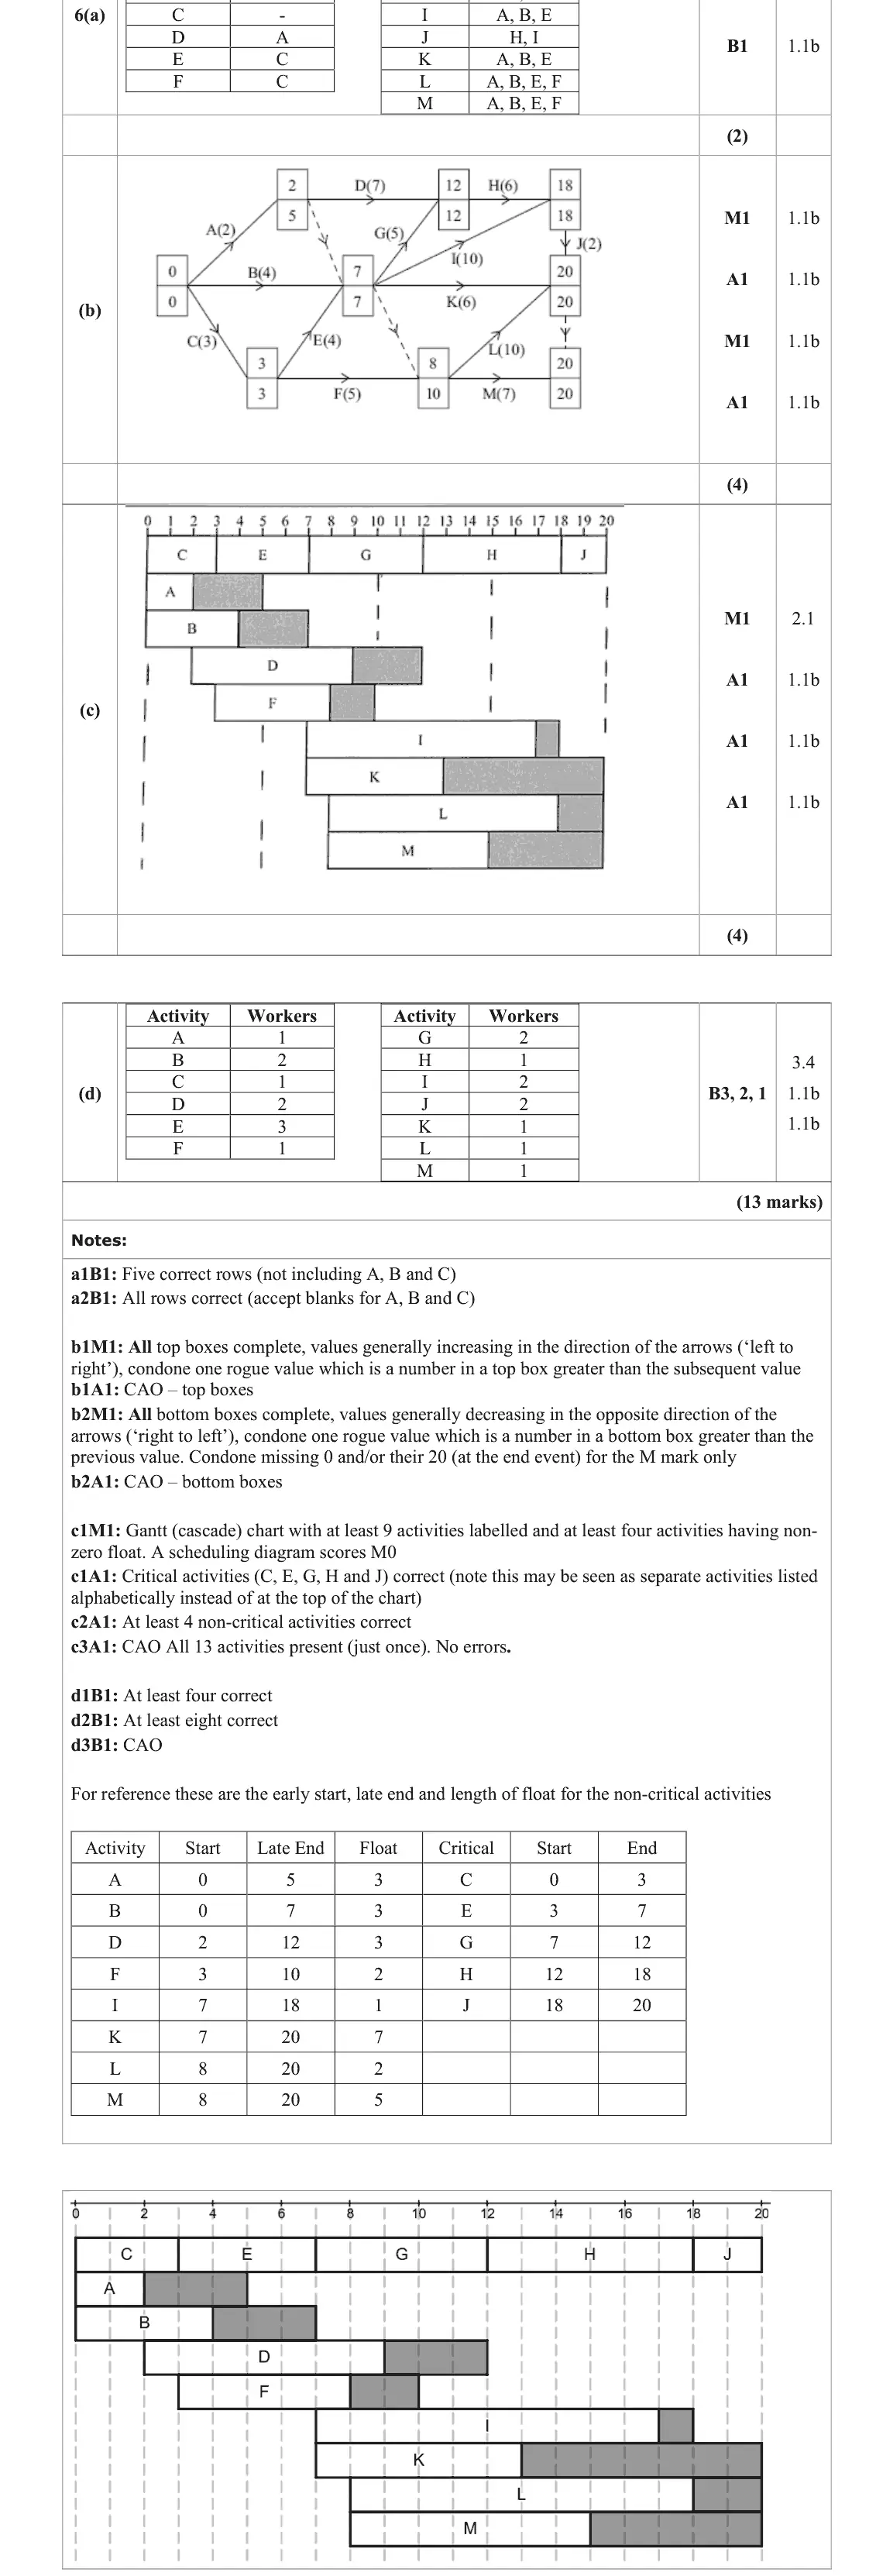
Mark scheme (whole question; this part is marked with the orange bar)
Examiner's comment
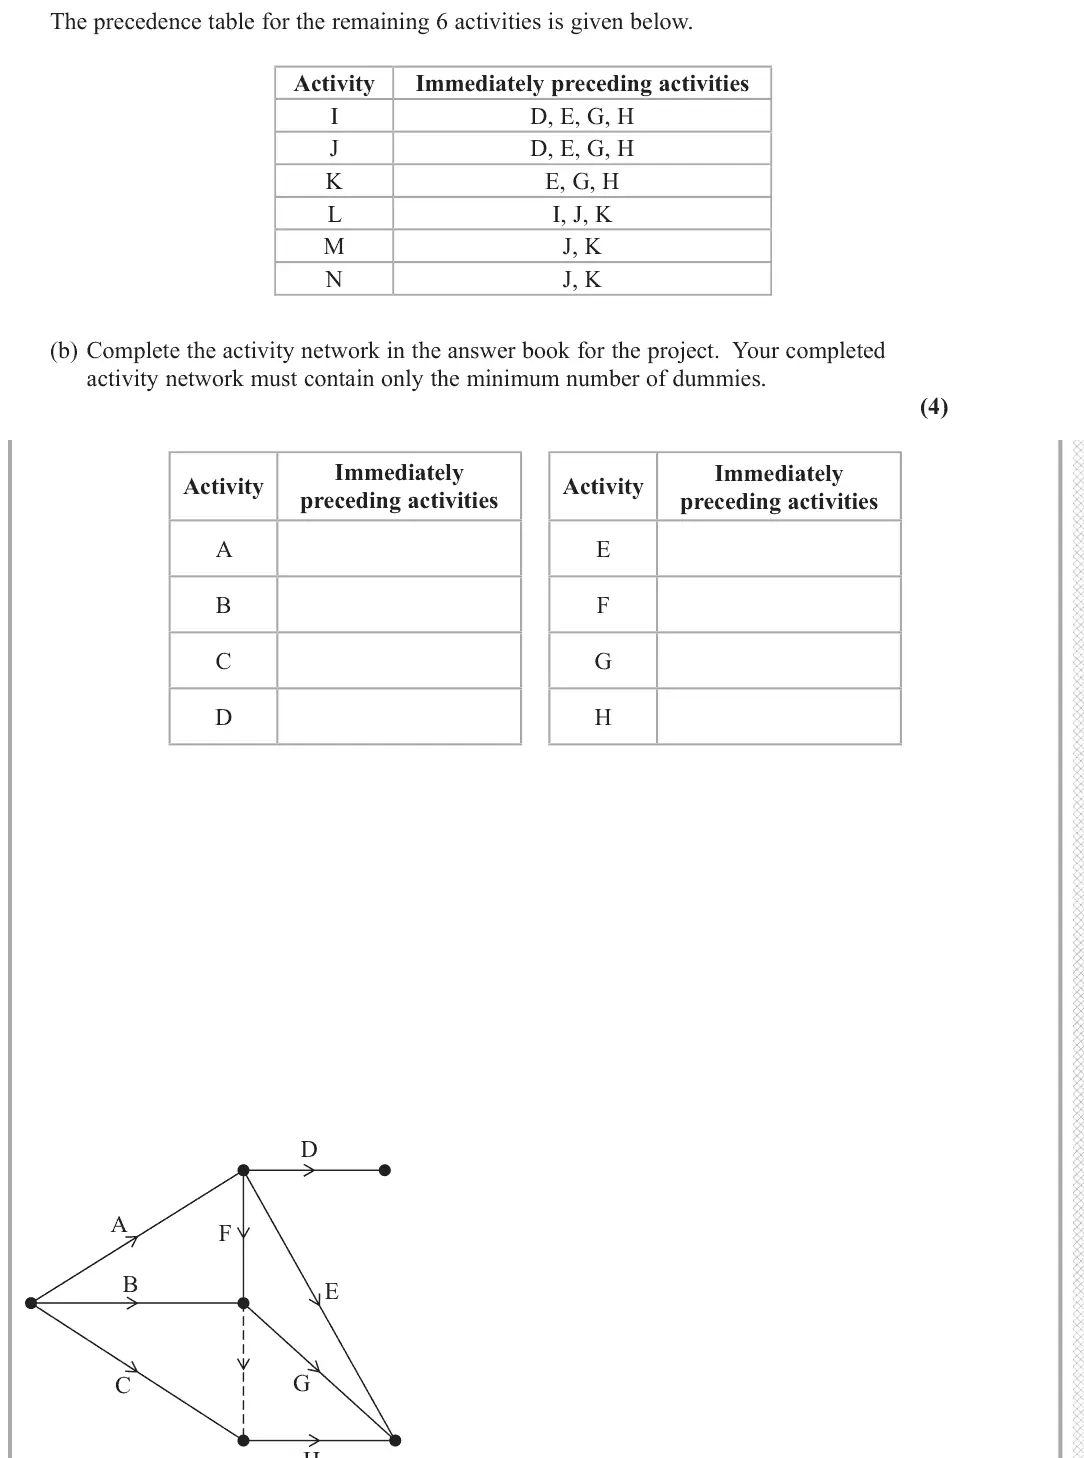
Part (a) was mostly well done. Most candidates showed an understanding of activity dependencies, although many missed out on including all necessary predecessors for activities L and M, specifically failing to include activity A in some cases.
Key points from the mark scheme and examiner's report
e.g. G and I, K: A, B, E
L and M: A, B, E, F
J: H, I
A often missed for L and M (dummy)
June 2025 · Paper 3D (Decision 1) · Q6(b)4 marks
Mark scheme (whole question; this part is marked with the orange bar)
Examiner's comment
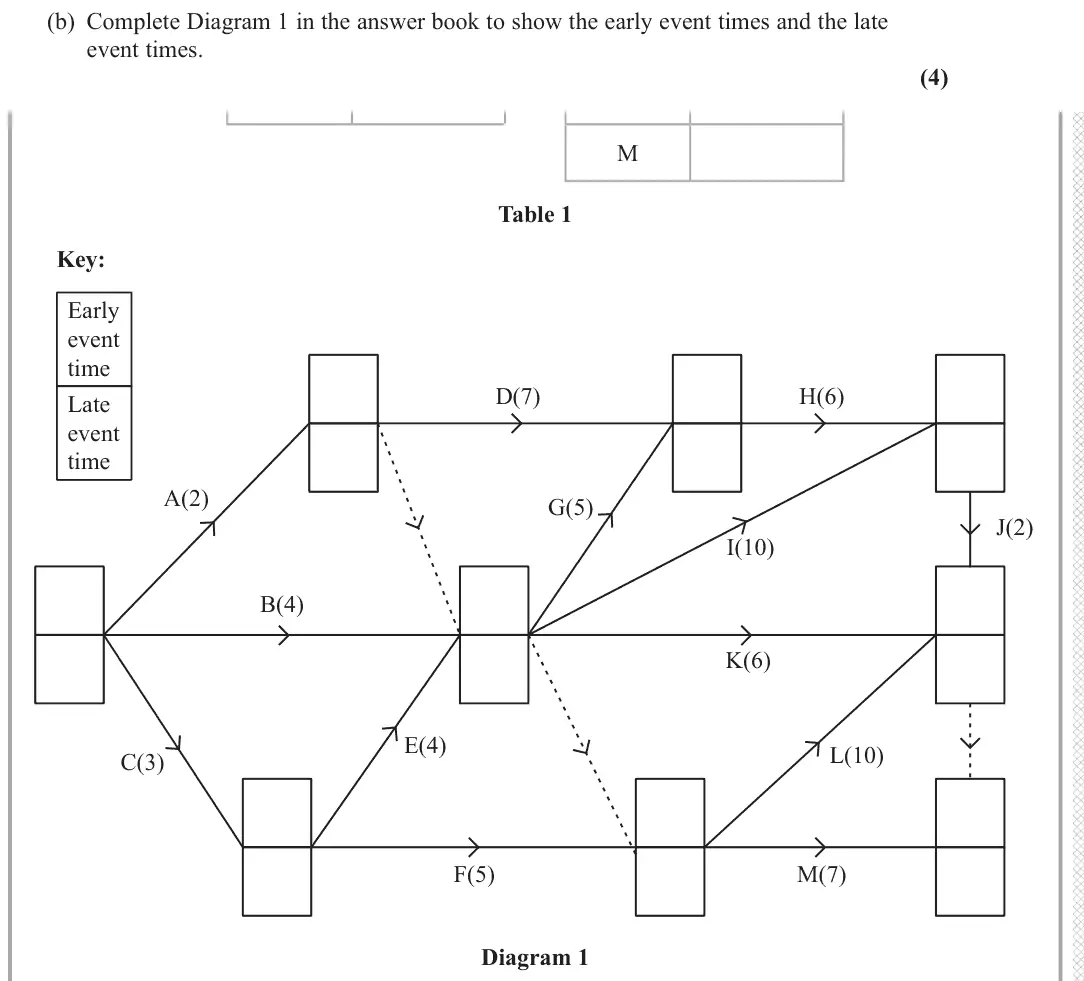
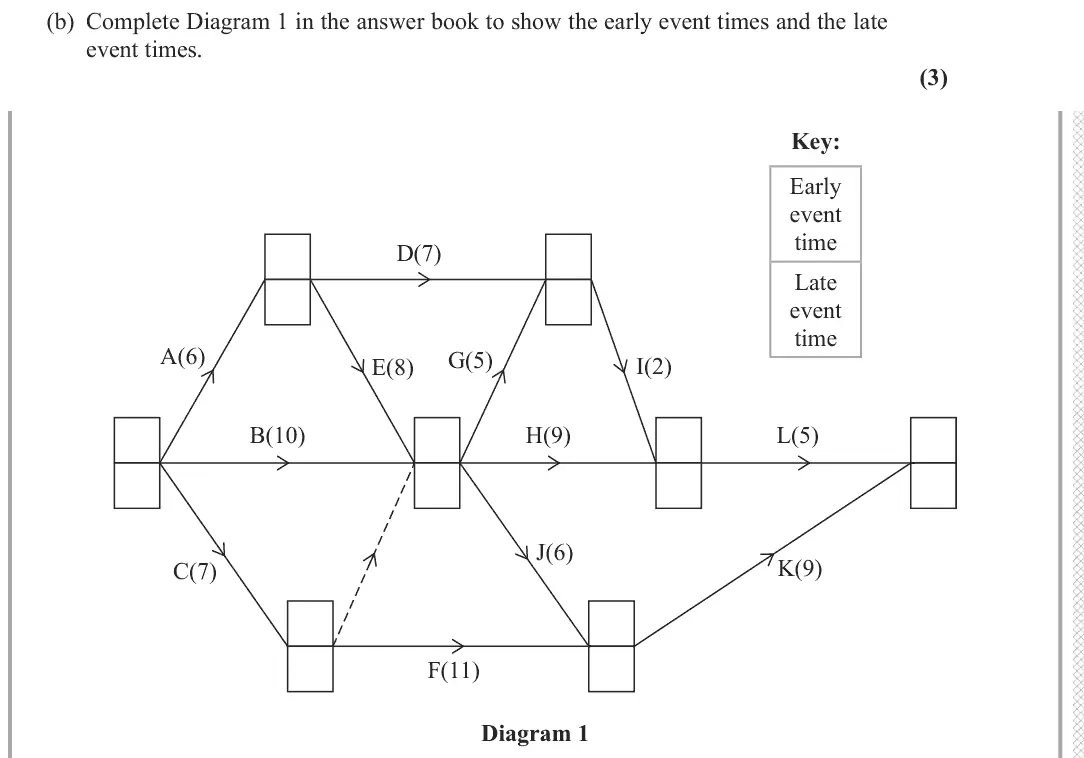
In part (b) the activity network diagram was generally completed well. Most candidates achieved full marks, and when errors did occur, they were often limited to a single miscalculated event time. A frequent mistake was recording 13 instead of 10 as the late event time for a activity F.
Key points from the mark scheme and examiner's report
forward and backward passes, project length 20
late event time at the end of F is 10 (13 was the common error)
June 2025 · Paper 3D (Decision 1) · Q6(c)4 marks
Mark scheme (whole question; this part is marked with the orange bar)
Examiner's comment
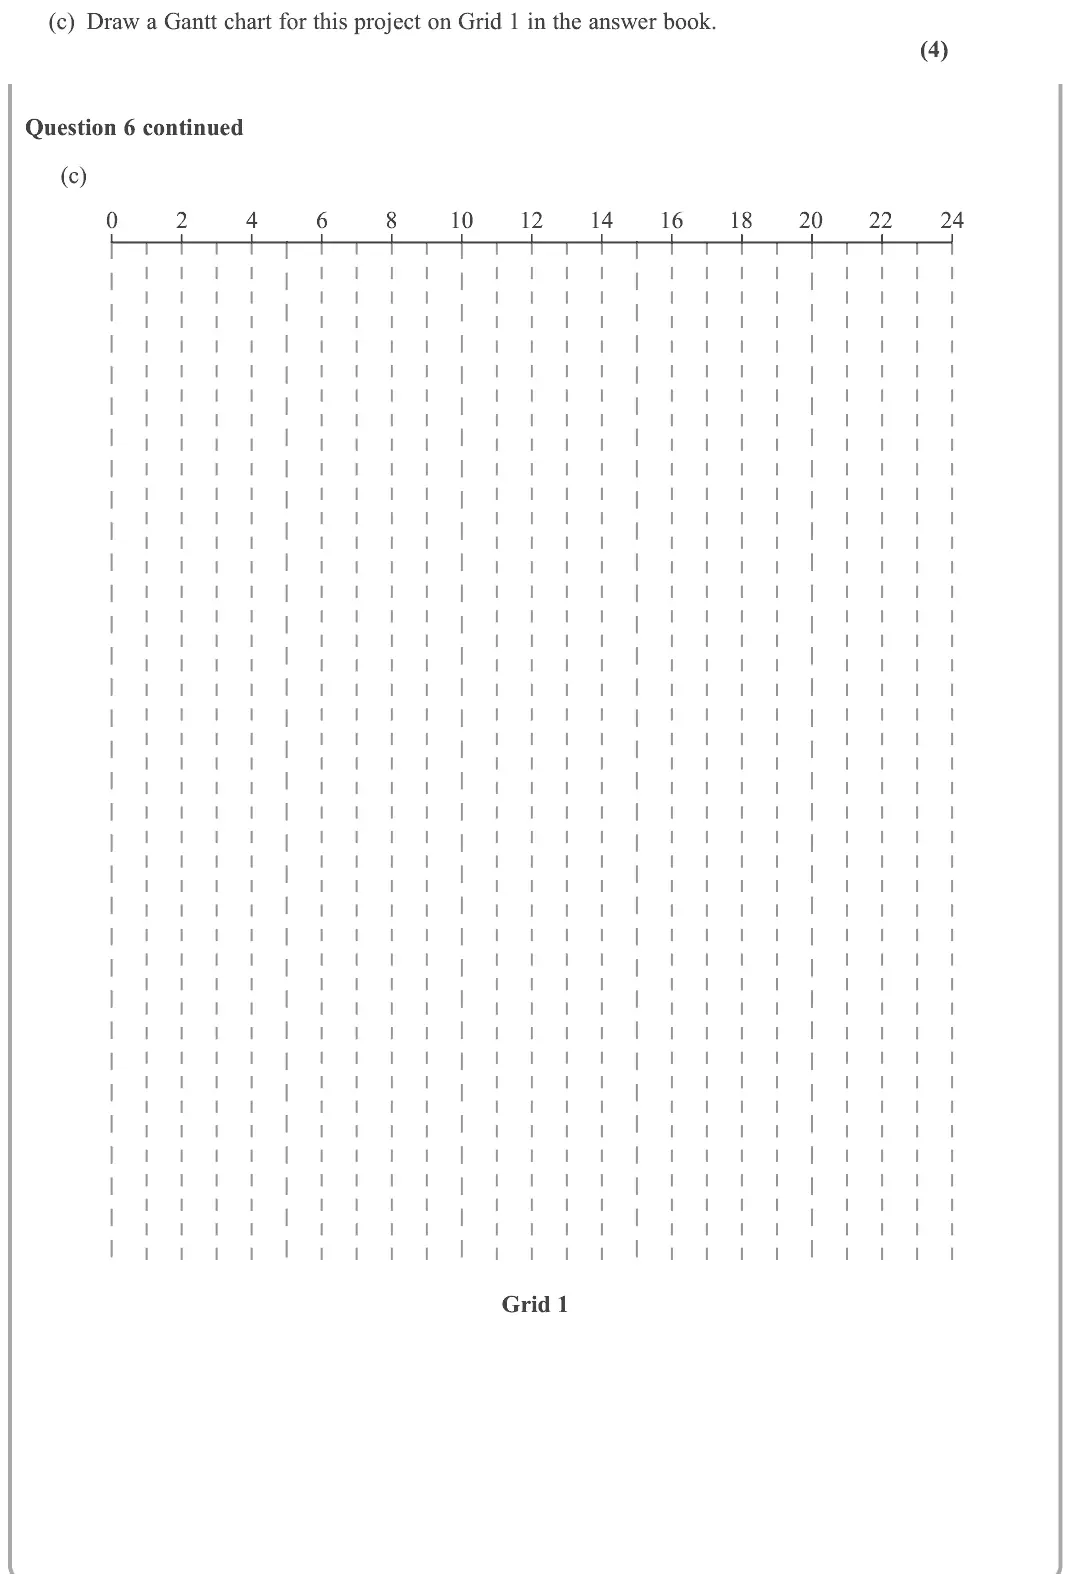
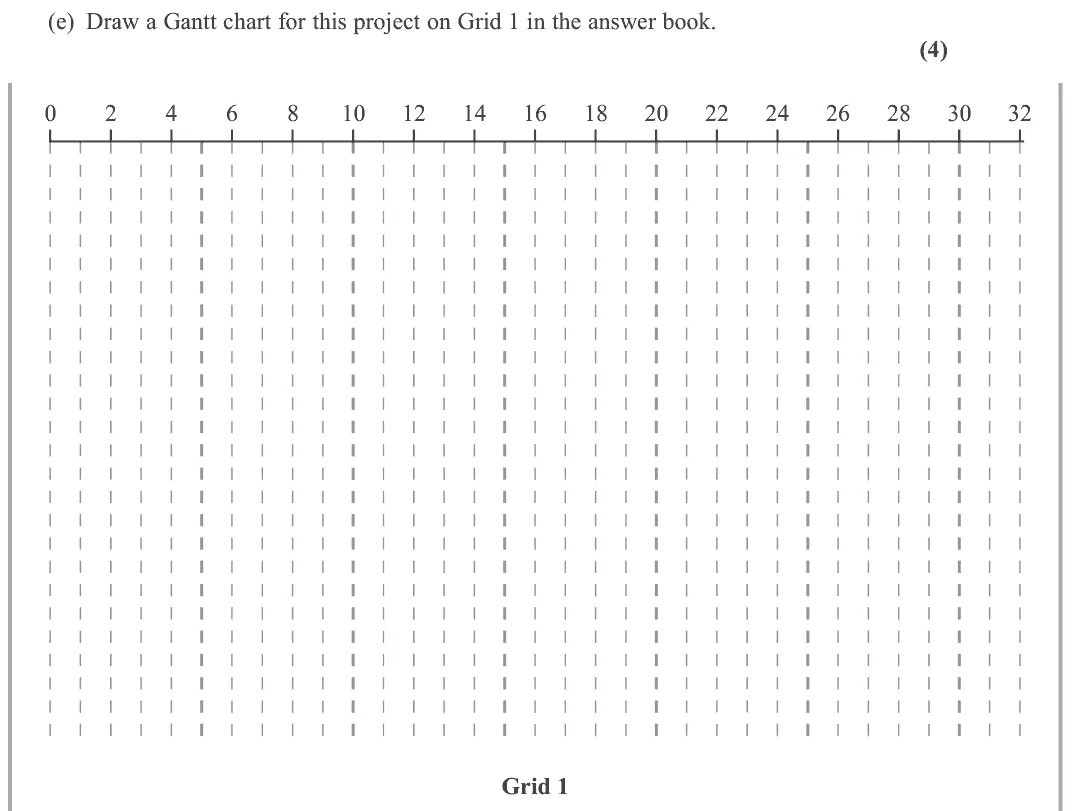
In part (c) the Gantt chart was also completed well and better than in previous series. Only a small number of candidates submitted no response, and most mistakes stemmed from errors in part (b) that carried forward. Very few attempted a scheduling diagram, and most followed the standard format. Overall, this was one of the strongest parts of the question.
Key points from the mark scheme and examiner's report
cascade chart: critical C, E, G, H, J on top row
non-critical activities at earliest start with floats shaded (e.g. K float 7, M float 5)
a scheduling diagram scores 0
June 2025 · Paper 3D (Decision 1) · Q6(d)3 marks
Mark scheme (whole question; this part is marked with the orange bar)
Examiner's comment
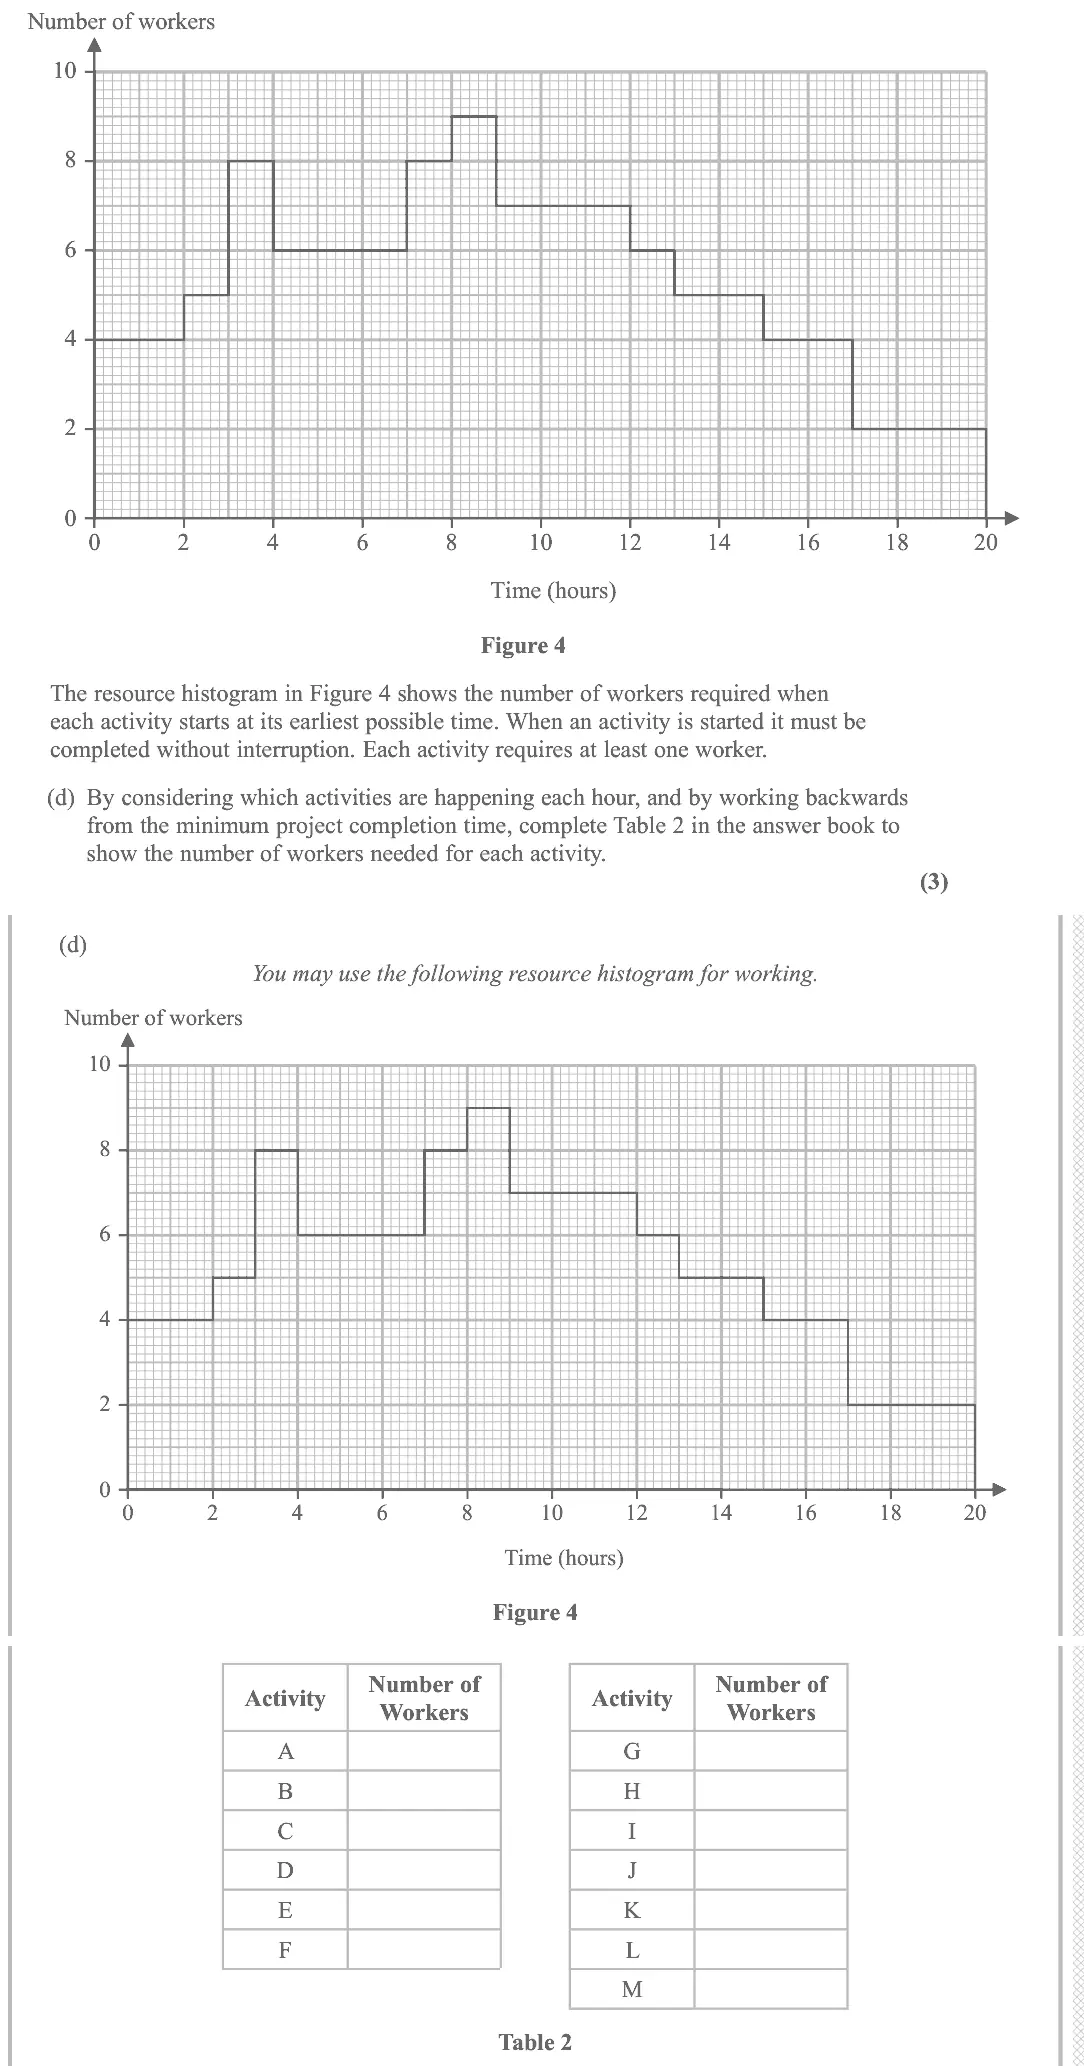
Part (d) was not well answered and was often left blank. When candidates did attempt it, many managed to gain at least one or two marks, but fully correct responses were rare. Some candidates attempted to fill in the activities on the resource histogram itself, which would have been time consuming and often still resulted in no marks.
Key points from the mark scheme and examiner's report
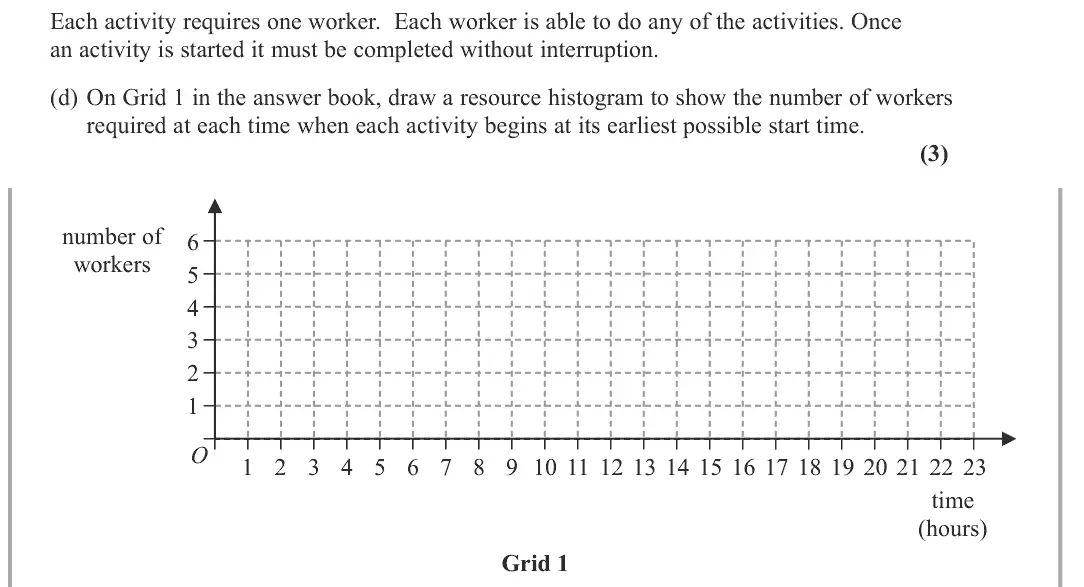
read the histogram backwards from time 20: A 1, B 2, C 1, D 2, E 3, F 1, G 2, H 1, I 2, J 2, K 1, L 1, M 1
often left blank
June 2024 · AS Paper 2 (Decision 1) · Q2(a)3 marks
Mark scheme (whole question; this part is marked with the orange bar)
Examiner's comment
This was generally a high-scoring question, with the vast majority of candidates scoring at least 6 out of a possible 8 marks. Part a) was a relatively straightforward network, with the additional scaffold of a partially drawn network. Whilst the significant majority of candidates scored full marks, a surprising number lost the last accuracy mark for omitting activity J. Despite the network being given, several candidates still attempted to put activities on nodes. However fewer candidates lost marks for missing arrows, or additional dummies. Part b) was again well-answered with the majority scoring 2 or 3 marks. The most frequent errors were in the late times for U (29), M (38) and N (49, leading to a rogue value here) but mistakes were exceptionally rare in the forward pass. In part c) the majority of candidates correctly identified the critical activities, although activity P was included by some. Part d) caused issues for less secure candidates; some obtained 7:27pm (subtracting 33 minutes from 8pm), many achieved 7:29pm and 7:31pm or 7:34pm following numerical errors or misusing the 4 minutes of float. A surprising number seemed to misinterpret the question and gave answers beyond 8pm. Others correctly identified 33 minutes but then failed to add the pm for the correct time or gave a time of 8.33pm. This served as a reasonable discriminator mark for stronger candidates.
Key points from the mark scheme and examiner's report
add E, F, G, H, J with exactly two dummies (B to the start of F, and E to the start of F)
J was often omitted
activity on node despite the given network
June 2024 · AS Paper 2 (Decision 1) · Q2(b)3 marks
Mark scheme (whole question; this part is marked with the orange bar)
Examiner's comment
This was generally a high-scoring question, with the vast majority of candidates scoring at least 6 out of a possible 8 marks. Part a) was a relatively straightforward network, with the additional scaffold of a partially drawn network. Whilst the significant majority of candidates scored full marks, a surprising number lost the last accuracy mark for omitting activity J. Despite the network being given, several candidates still attempted to put activities on nodes. However fewer candidates lost marks for missing arrows, or additional dummies. Part b) was again well-answered with the majority scoring 2 or 3 marks. The most frequent errors were in the late times for U (29), M (38) and N (49, leading to a rogue value here) but mistakes were exceptionally rare in the forward pass. In part c) the majority of candidates correctly identified the critical activities, although activity P was included by some. Part d) caused issues for less secure candidates; some obtained 7:27pm (subtracting 33 minutes from 8pm), many achieved 7:29pm and 7:31pm or 7:34pm following numerical errors or misusing the 4 minutes of float. A surprising number seemed to misinterpret the question and gave answers beyond 8pm. Others correctly identified 33 minutes but then failed to add the pm for the correct time or gave a time of 8.33pm. This served as a reasonable discriminator mark for stronger candidates.
Key points from the mark scheme and examiner's report
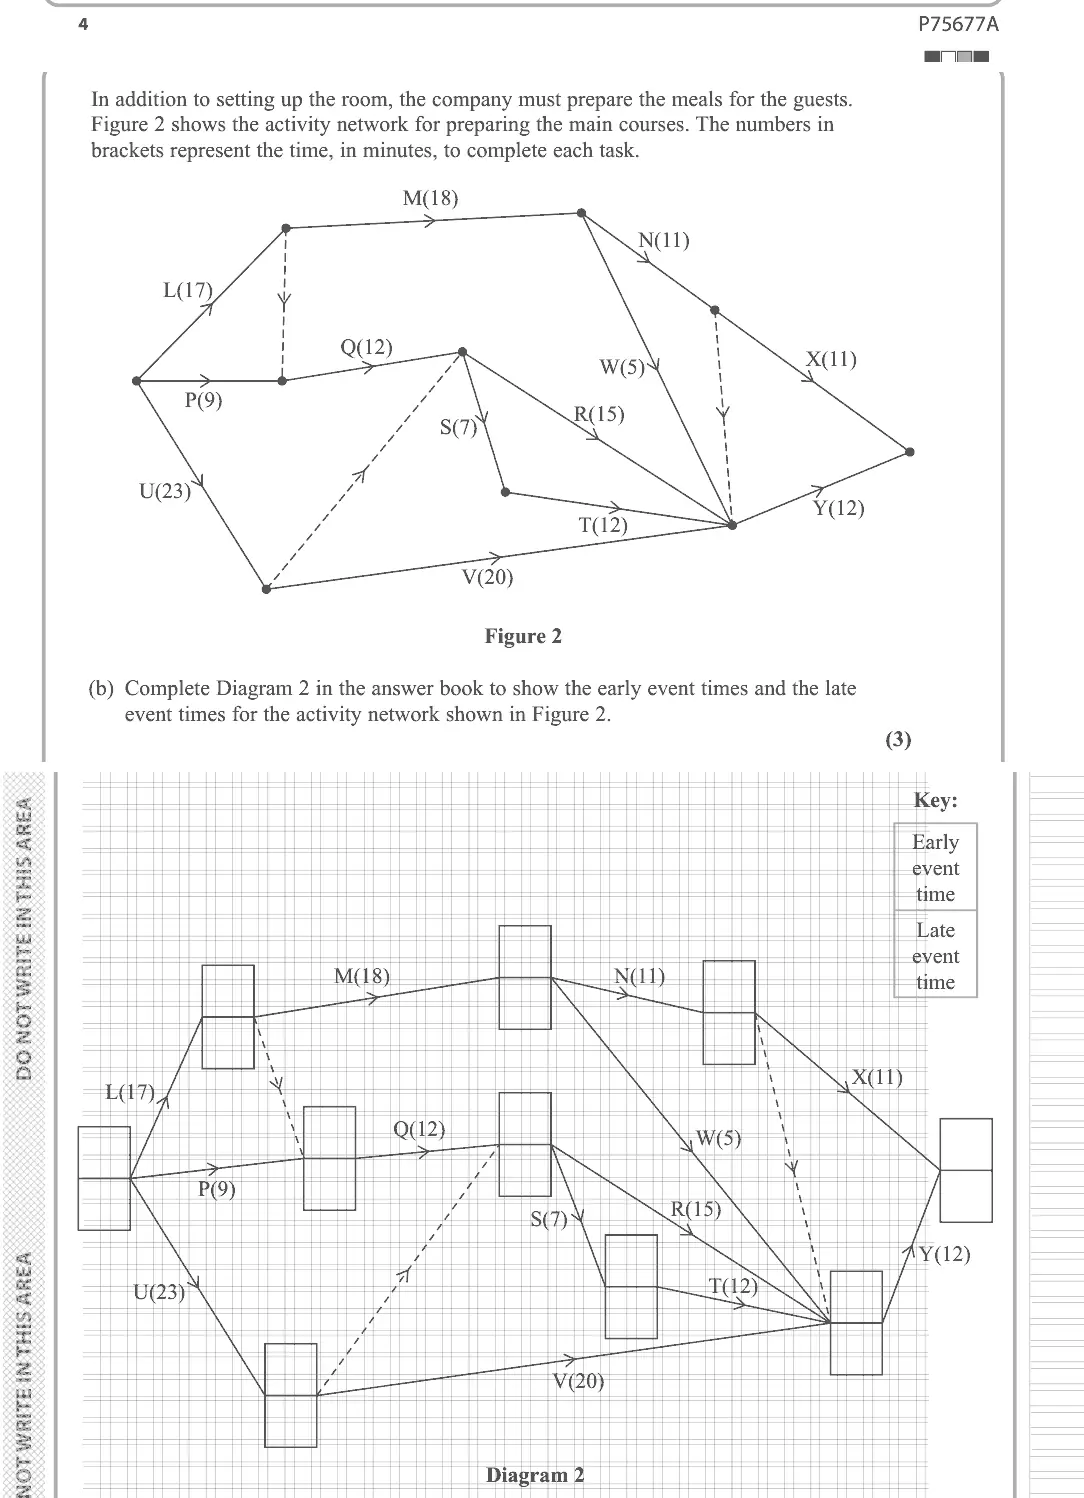
completion 60 minutes
forward pass rarely wrong
late-time errors at U (29), M (38) and N (49)
June 2024 · AS Paper 2 (Decision 1) · Q2(c)1 mark
Mark scheme (whole question; this part is marked with the orange bar)
Examiner's comment
This was generally a high-scoring question, with the vast majority of candidates scoring at least 6 out of a possible 8 marks. Part a) was a relatively straightforward network, with the additional scaffold of a partially drawn network. Whilst the significant majority of candidates scored full marks, a surprising number lost the last accuracy mark for omitting activity J. Despite the network being given, several candidates still attempted to put activities on nodes. However fewer candidates lost marks for missing arrows, or additional dummies. Part b) was again well-answered with the majority scoring 2 or 3 marks. The most frequent errors were in the late times for U (29), M (38) and N (49, leading to a rogue value here) but mistakes were exceptionally rare in the forward pass. In part c) the majority of candidates correctly identified the critical activities, although activity P was included by some. Part d) caused issues for less secure candidates; some obtained 7:27pm (subtracting 33 minutes from 8pm), many achieved 7:29pm and 7:31pm or 7:34pm following numerical errors or misusing the 4 minutes of float. A surprising number seemed to misinterpret the question and gave answers beyond 8pm. Others correctly identified 33 minutes but then failed to add the pm for the correct time or gave a time of 8.33pm. This served as a reasonable discriminator mark for stronger candidates.
Key points from the mark scheme and examiner's report
L, Q, S, T and Y
P sometimes included
June 2024 · AS Paper 2 (Decision 1) · Q2(d)1 mark
Mark scheme (whole question; this part is marked with the orange bar)
Examiner's comment
This was generally a high-scoring question, with the vast majority of candidates scoring at least 6 out of a possible 8 marks. Part a) was a relatively straightforward network, with the additional scaffold of a partially drawn network. Whilst the significant majority of candidates scored full marks, a surprising number lost the last accuracy mark for omitting activity J. Despite the network being given, several candidates still attempted to put activities on nodes. However fewer candidates lost marks for missing arrows, or additional dummies. Part b) was again well-answered with the majority scoring 2 or 3 marks. The most frequent errors were in the late times for U (29), M (38) and N (49, leading to a rogue value here) but mistakes were exceptionally rare in the forward pass. In part c) the majority of candidates correctly identified the critical activities, although activity P was included by some. Part d) caused issues for less secure candidates; some obtained 7:27pm (subtracting 33 minutes from 8pm), many achieved 7:29pm and 7:31pm or 7:34pm following numerical errors or misusing the 4 minutes of float. A surprising number seemed to misinterpret the question and gave answers beyond 8pm. Others correctly identified 33 minutes but then failed to add the pm for the correct time or gave a time of 8.33pm. This served as a reasonable discriminator mark for stronger candidates.
Key points from the mark scheme and examiner's report
project starts at 7 pm (60 minutes before 8 pm)
R must start by 48 − 15 = 33 minutes, so 7:33 pm (pm needed)
7:27 pm, 7:29 pm and 8:33 pm were common errors
June 2024 · Paper 3D (Decision 1) · Q6(a)5 marks
Mark scheme (whole question; this part is marked with the orange bar)
Examiner's comment
Overall, this question was very accessible with at least the first three marks in part (a) and the first mark in part (b) gained by most candidates. In part (a) nearly all candidates that completed a network did put arrows on with only a minority losing the A1 CSO mark for this reason. A few candidates only gained 1 mark as they did not put arrows on any of their dummies. Extra dummies were more likely to be seen than missing dummies. A good proportion of candidates were able to start the network and correctly deal with up to J, and the first two dummies. There was then sometimes some confusion with how to deal with H, I, K and L. The most common error was to omit the dummy after F and G which resulted in L being shown as dependent on J in error. This cost these candidates the final two marks.
Key points from the mark scheme and examiner's report
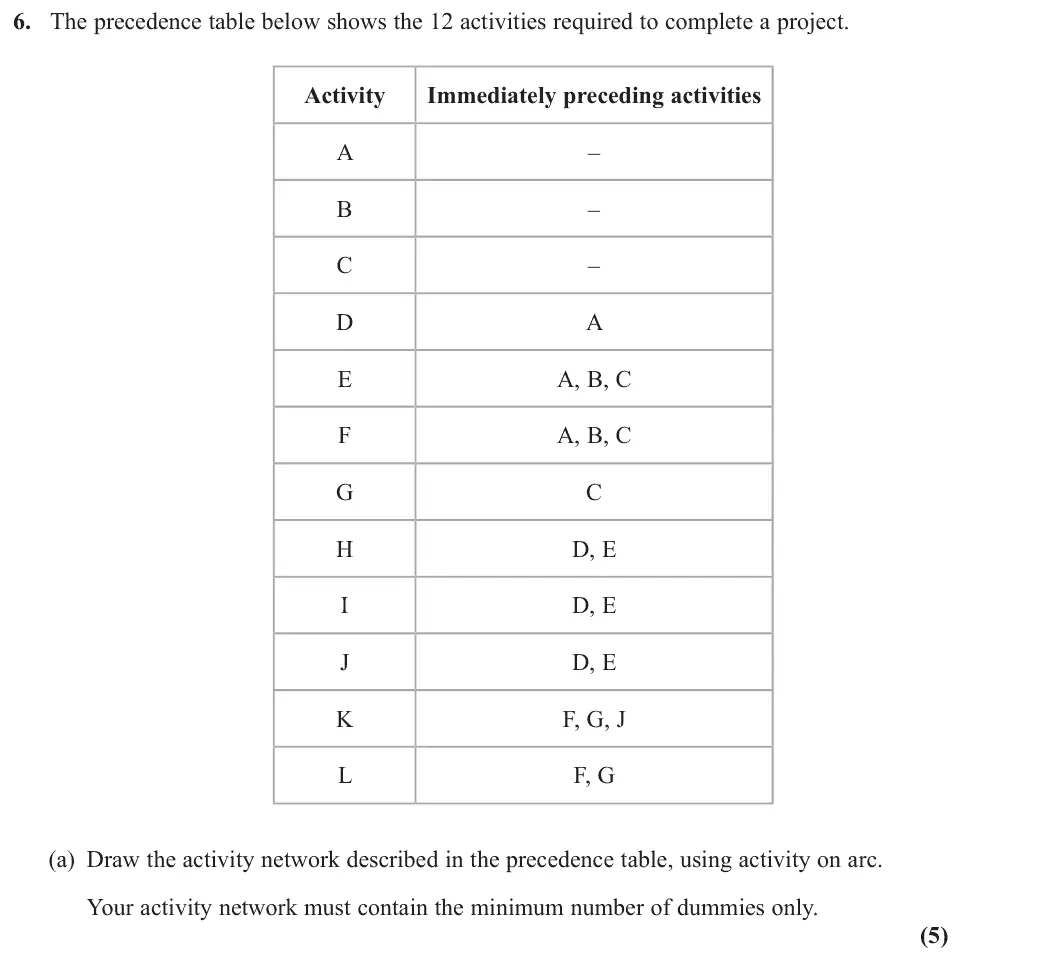
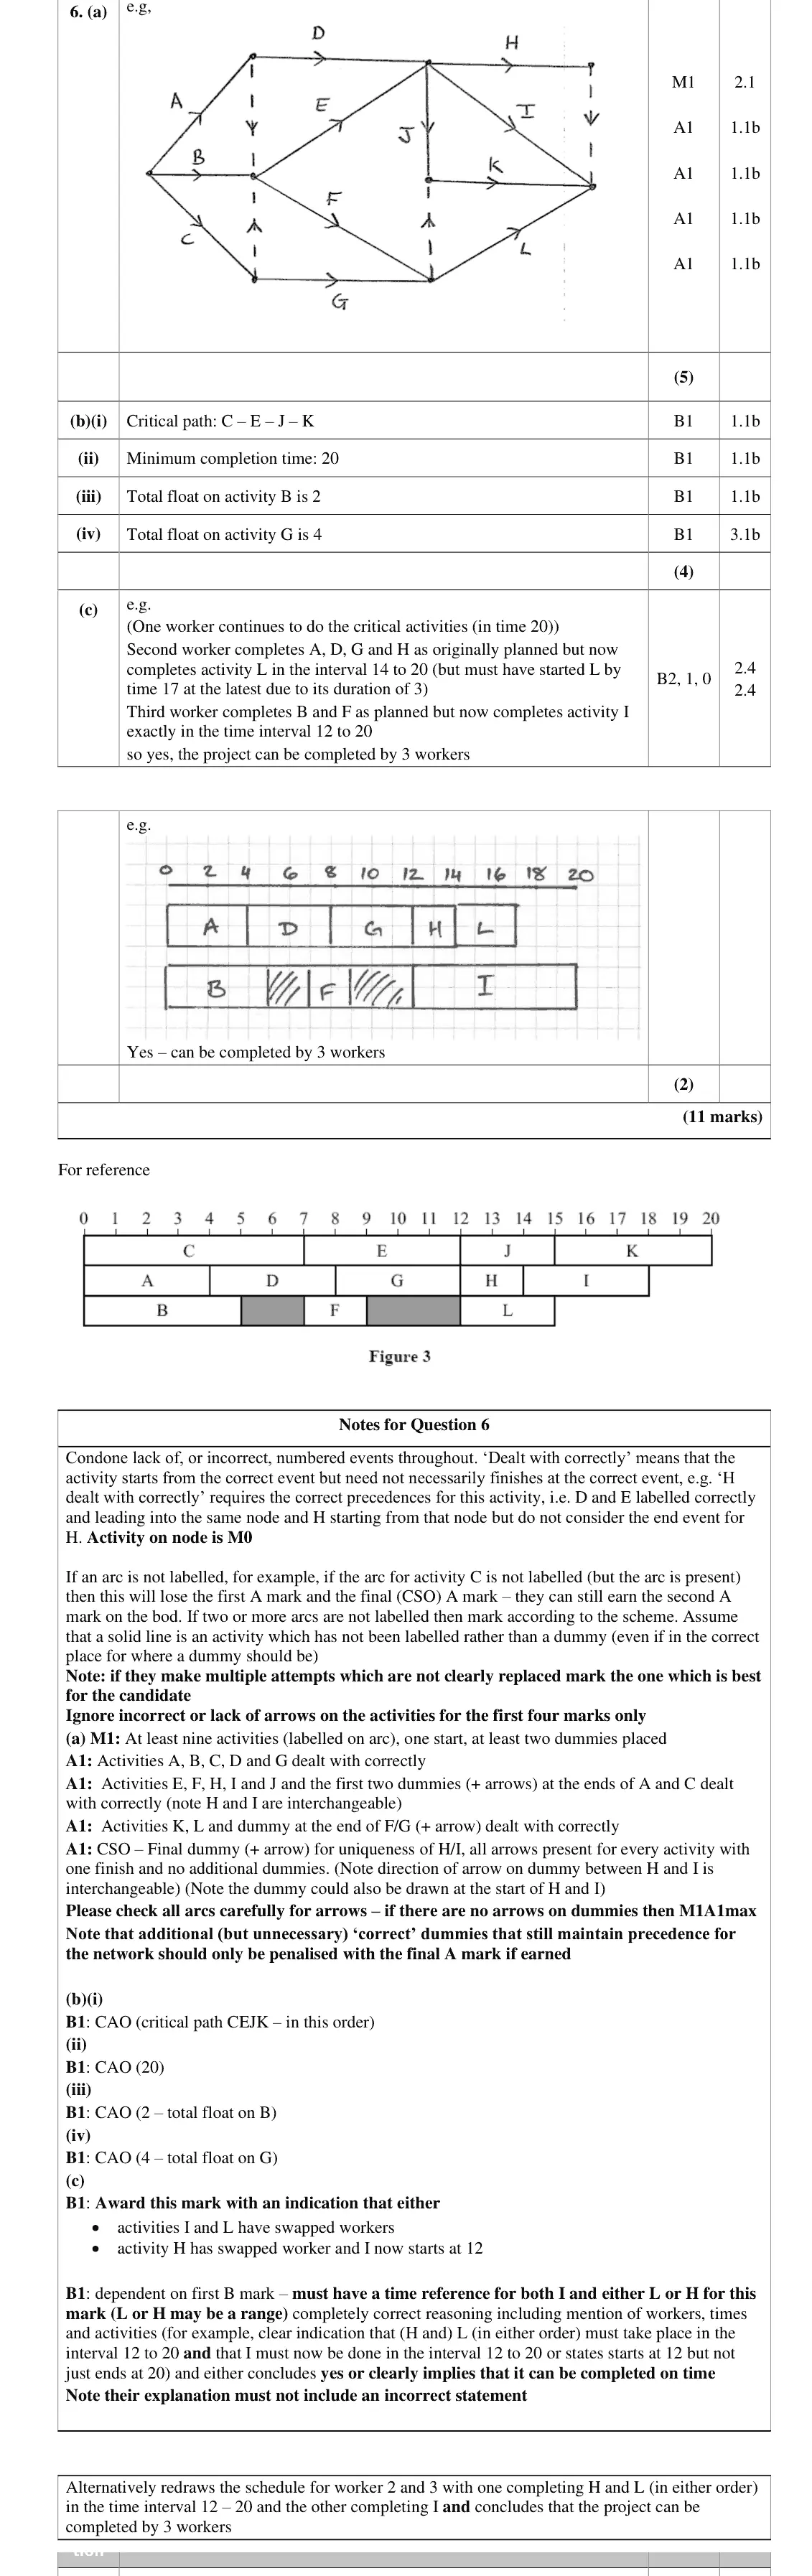
dummies at the ends of A and C, one after F/G for L, and one for the uniqueness of H and I
omitting the dummy after F and G (making L depend on J) was the commonest error
June 2024 · Paper 3D (Decision 1) · Q6(b)4 marks
Mark scheme (whole question; this part is marked with the orange bar)
Examiner's comment
Overall, this question was very accessible with at least the first three marks in part (a) and the first mark in part (b) gained by most candidates. In part (b) nearly all candidates gained the first mark for the correct critical path, CEJK, with many also gaining the mark for the correct minimum completion time of 20 hours. A significant number of candidates calculated the correct float on Activity B of 2 hours, but It was rare to see a correct calculation for the total float on Activity G. Many candidates gave the float incorrectly as 0 (zero stated or 12 – 8 – 4 due to H starting immediately after G on the given scheduling diagram) or as 1 (as G depends on C which finishes at 7 but G starts at 8 on scheduling diagram).
Key points from the mark scheme and examiner's report
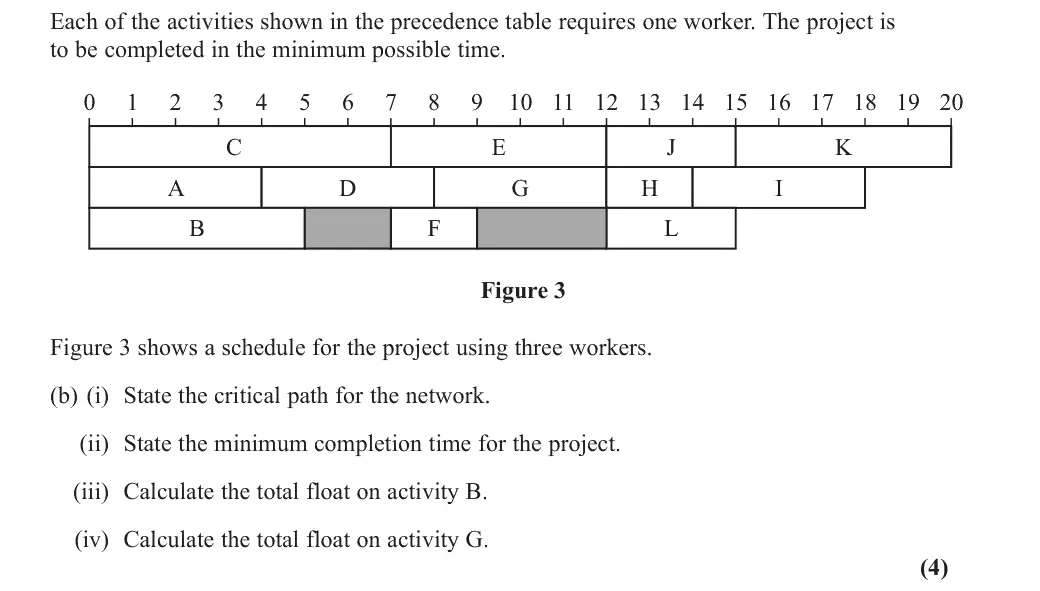
critical path C–E–J–K, 20 hours
float on B = 2
float on G = 15 − 7 − 4 = 4 (K must start by 15
use the network, not the schedule)
many gave 0 or 1 for G from the schedule
June 2024 · Paper 3D (Decision 1) · Q6(c)2 marks
Mark scheme (whole question; this part is marked with the orange bar)
Examiner's comment
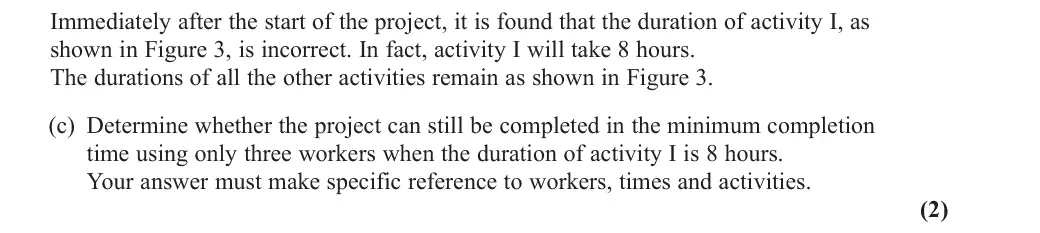
Overall, this question was very accessible with at least the first three marks in part (a) and the first mark in part (b) gained by most candidates. In part (c) few candidates earned both marks by giving the complete detail required, expressing for example that: Activity I could be done by Worker 2, starting at 12 hours (and finishing at 20) and Activity H could then be done by Worker 3 from 15 hours (to 17) hours. Many candidates had the right idea but did not actually write enough detail, for example by not mentioning specific timings. Several candidates thought that it was not possible to complete without a further worker or completing after 22 hours or splitting the activity between two workers.
Key points from the mark scheme and examiner's report
yes: worker 3 does I from 12 to 20 and worker 2 does H then L between 12 and 20 (L starting by 17)
must give workers, times and activities
June 2023 · AS Paper 2 (Decision 1) · Q2(a)1 mark
Mark scheme (whole question; this part is marked with the orange bar)
Examiner's comment
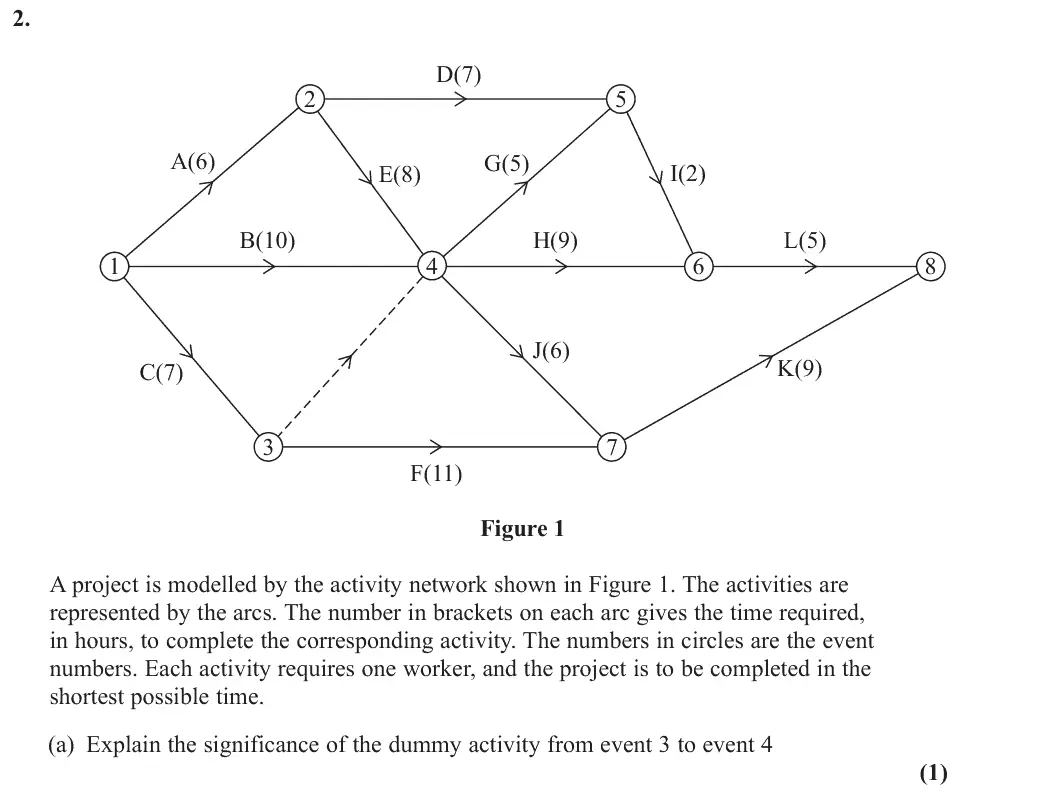
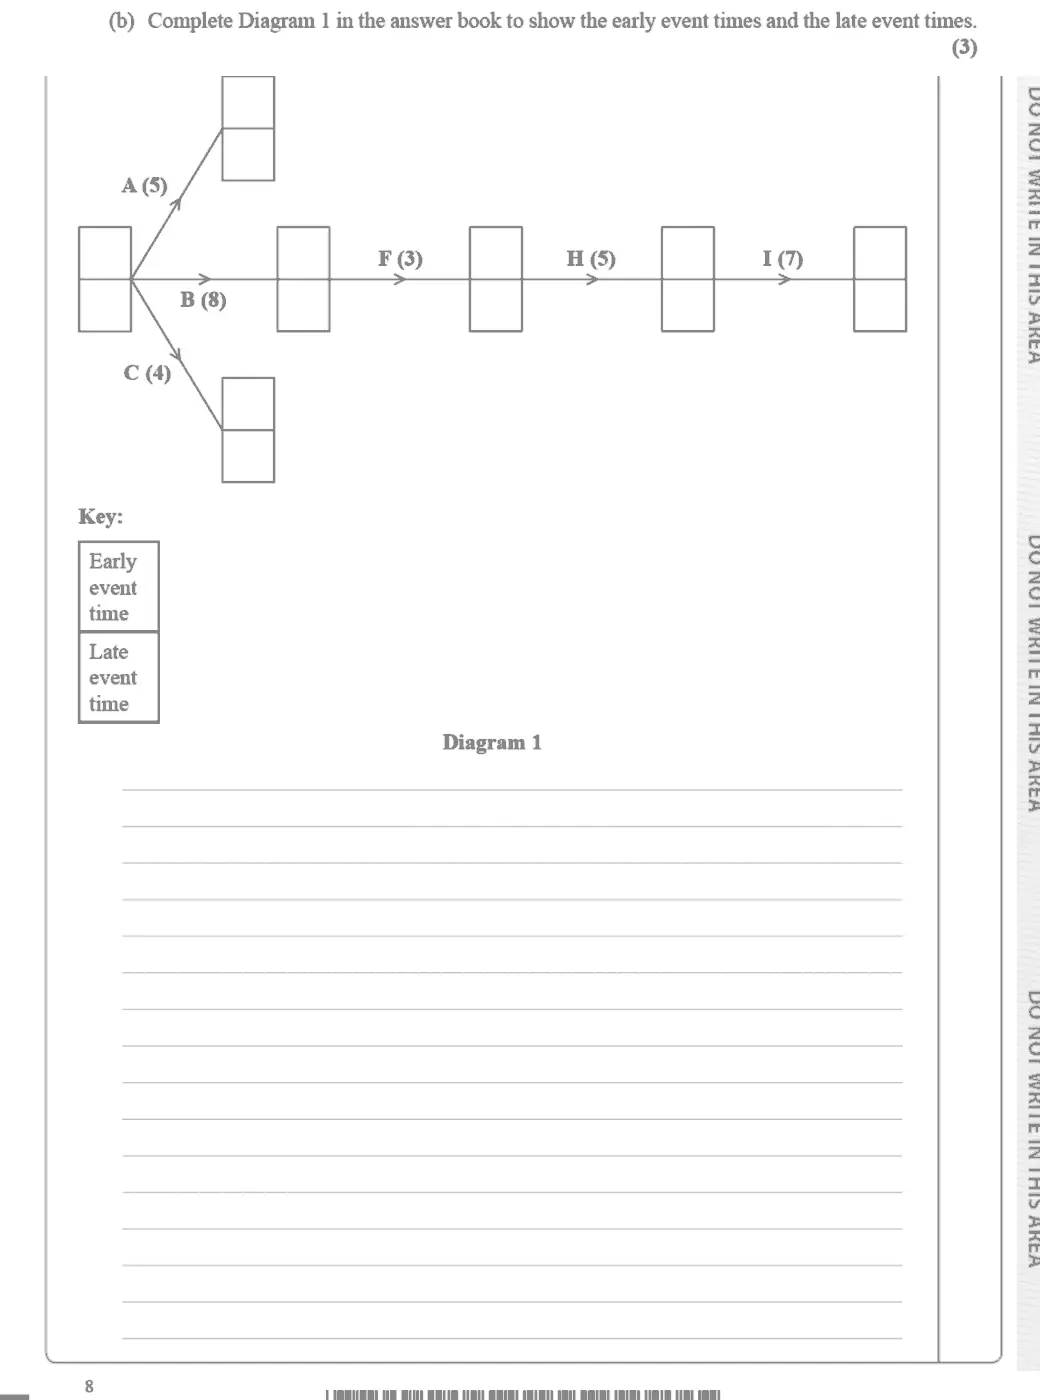
Part (a), in which candidates were required to give a reason for the dummy from event 3 to event 4, were mixed, with many candidates either giving a general precedence argument (so failing to reference specific activities) or failing to mention all required activities. Although not penalised if omitted, the use of the word ‘only’ usually makes the candidate’s argument easier to understand (e.g. in this case the dummy is required because activity F depends only on activity C, but activities G, H and J depend on activities B, C and E). The completing of the early and late event times in part (b) was done well with almost all
Key points from the mark scheme and examiner's report
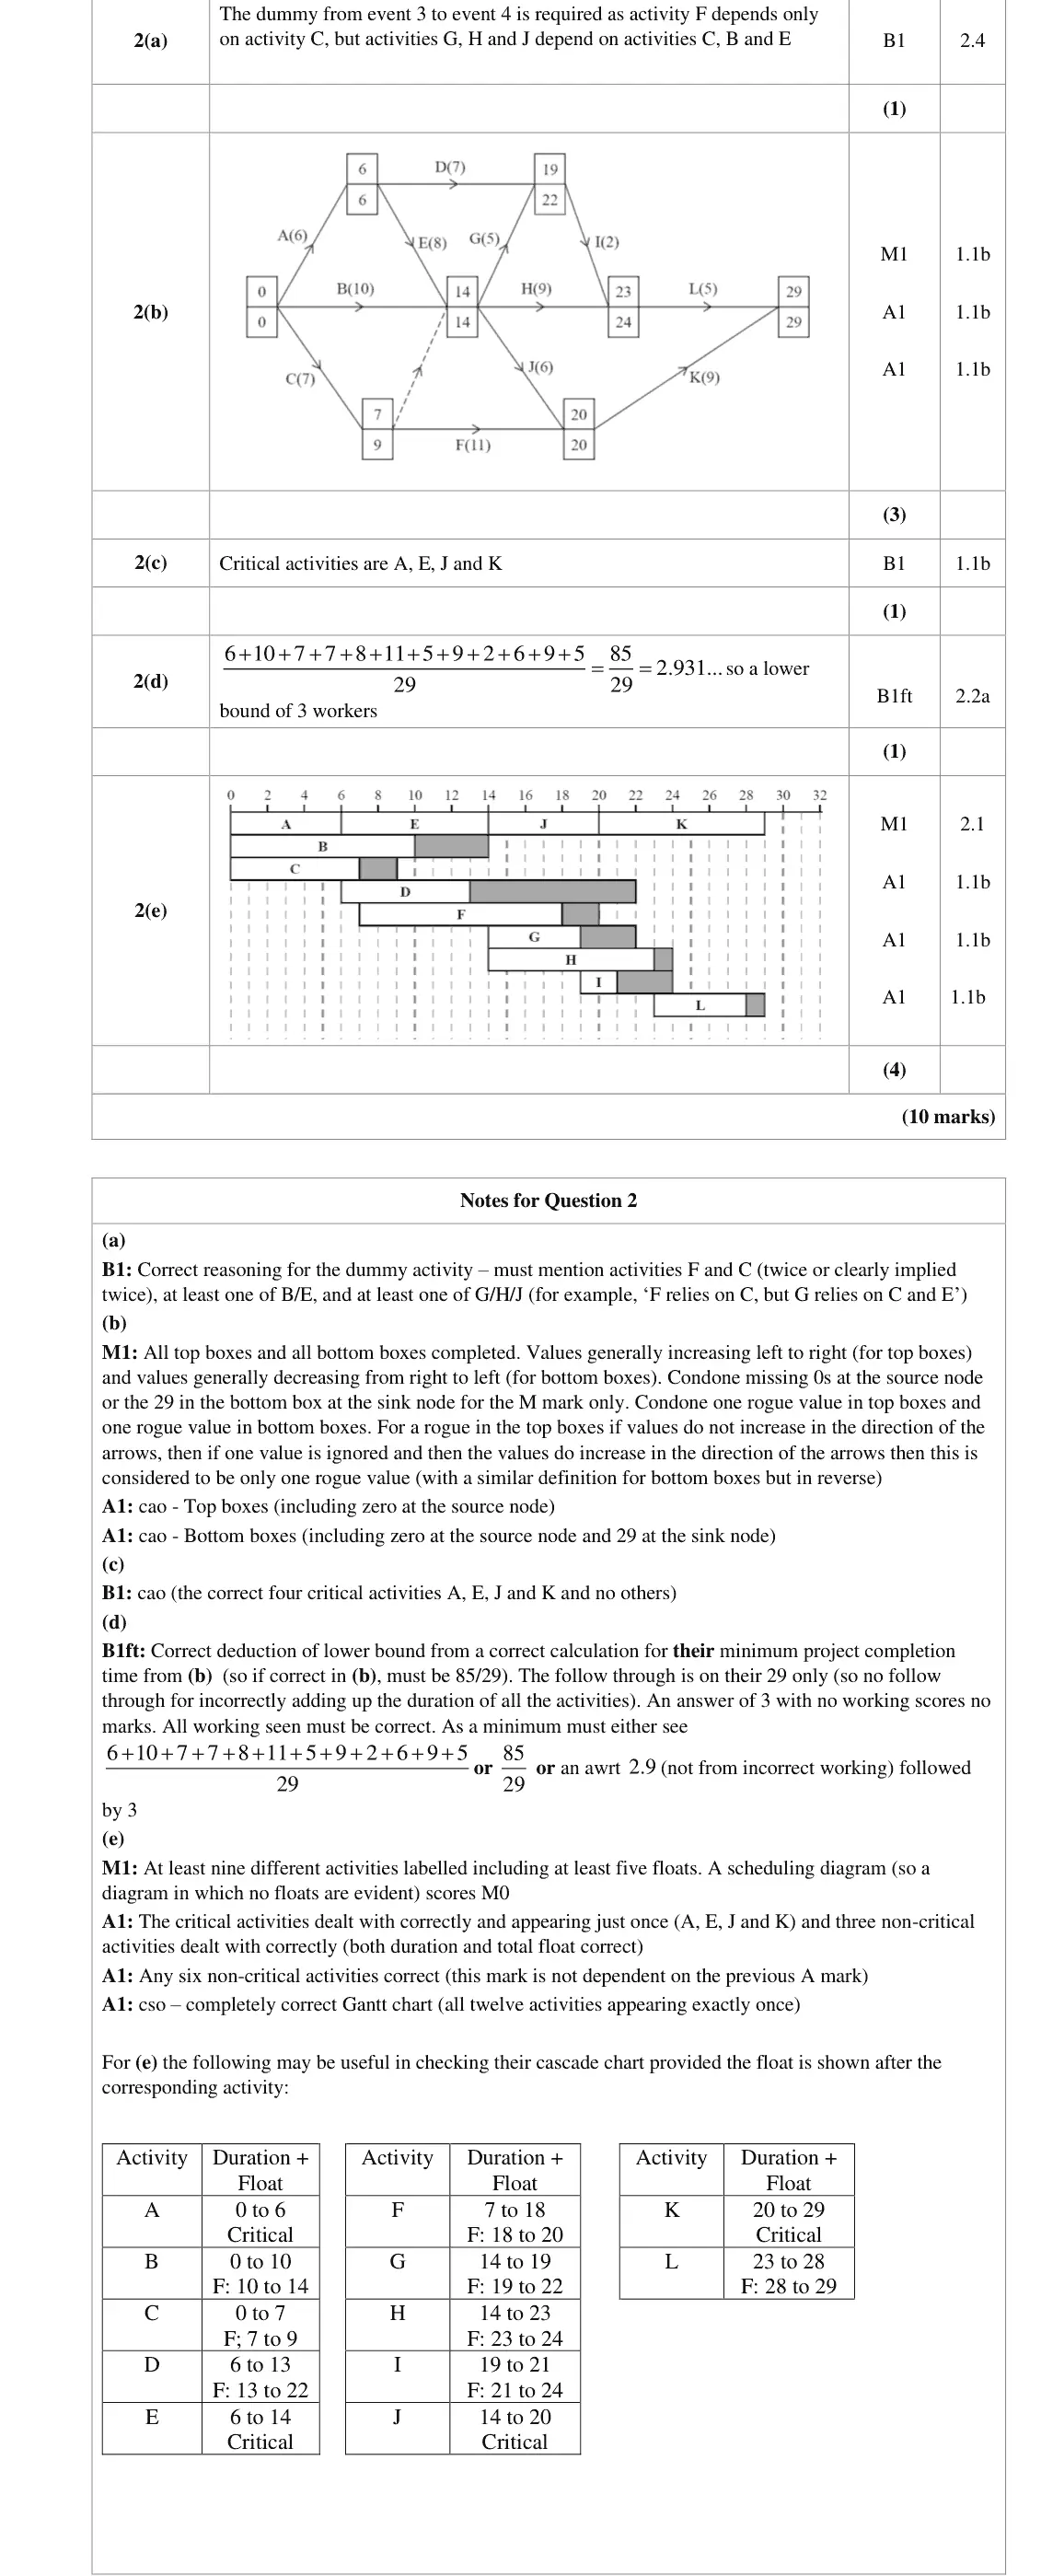
F depends only on C, but G, H and J depend on B, C and E
general precedence arguments without naming the activities score 0
June 2023 · AS Paper 2 (Decision 1) · Q2(b)3 marks
Mark scheme (whole question; this part is marked with the orange bar)
Examiner's comment
The completing of the early and late event times in part (b) was done well with almost all candidates scoring the first method mark (and most picking up one of the two accuracy marks too) – if errors occurred it was usually on the backward pass (either at the beginning of either activity F or H). Most candidates went on to correctly state the critical activities in part (c) and
Key points from the mark scheme and examiner's report
forward and backward passes
finish 29 hours
errors usually on the backward pass at the start of F or H
June 2023 · AS Paper 2 (Decision 1) · Q2(c)1 mark
Mark scheme (whole question; this part is marked with the orange bar)
Examiner's comment
activity F or H). Most candidates went on to correctly state the critical activities in part (c) and to use the correct method to calculate the lower bound in (d) (although some candidates are still
Key points from the mark scheme and examiner's report
A, E, J and K
June 2023 · AS Paper 2 (Decision 1) · Q2(d)1 mark
Mark scheme (whole question; this part is marked with the orange bar)
Examiner's comment
to use the correct method to calculate the lower bound in (d) (although some candidates are still doing the incorrect calculations of: project completion time / total number of activities). The drawing of the cascade chart in part (e) was done well by most candidates with the majority
Key points from the mark scheme and examiner's report
85 ÷ 29 = 2.93…, so at least 3 workers
completion time ÷ number of activities is a recurring wrong method
June 2023 · AS Paper 2 (Decision 1) · Q2(e)4 marks
Mark scheme (whole question; this part is marked with the orange bar)
Examiner's comment
drawing of the cascade chart in part (e) was done well by most candidates with the majority using the standard approach of placing the critical activities on a single line at the top of the chart and then placing each non-critical activity on a separate line with their corresponding float, usually shaded or shown in a way to differentiate from the duration, appearing after. Very few scheduling diagrams were seen (which are not on spec. anyway) and the most common error was to either forgot one (or more) activities or have an incorrect duration/float on one or more activities.
Key points from the mark scheme and examiner's report
critical activities A, E, J, K on one line
each non-critical activity on its own line followed by its total float
scheduling diagrams with no floats score M0
omitted activities and wrong floats were the usual errors
June 2023 · Paper 3D (Decision 1) · Q2(a)3 marks
Mark scheme (whole question; this part is marked with the orange bar)
Examiner's comment
This question proved accessible to most candidates. The most common error was a 3 as the
Key points from the mark scheme and examiner's report
forward and backward passes including the dummy
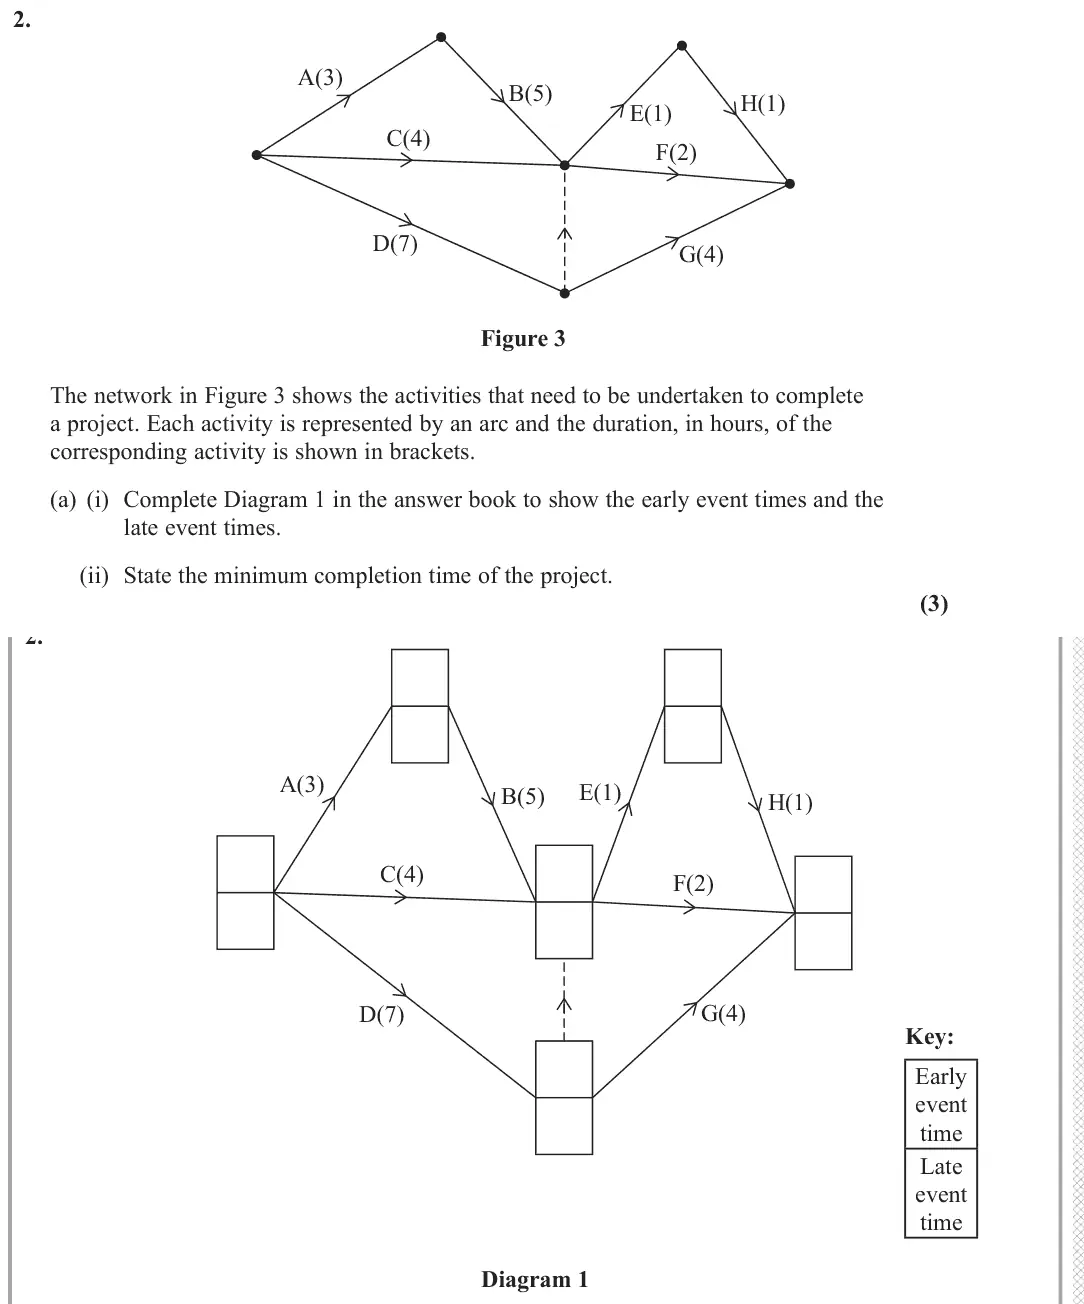
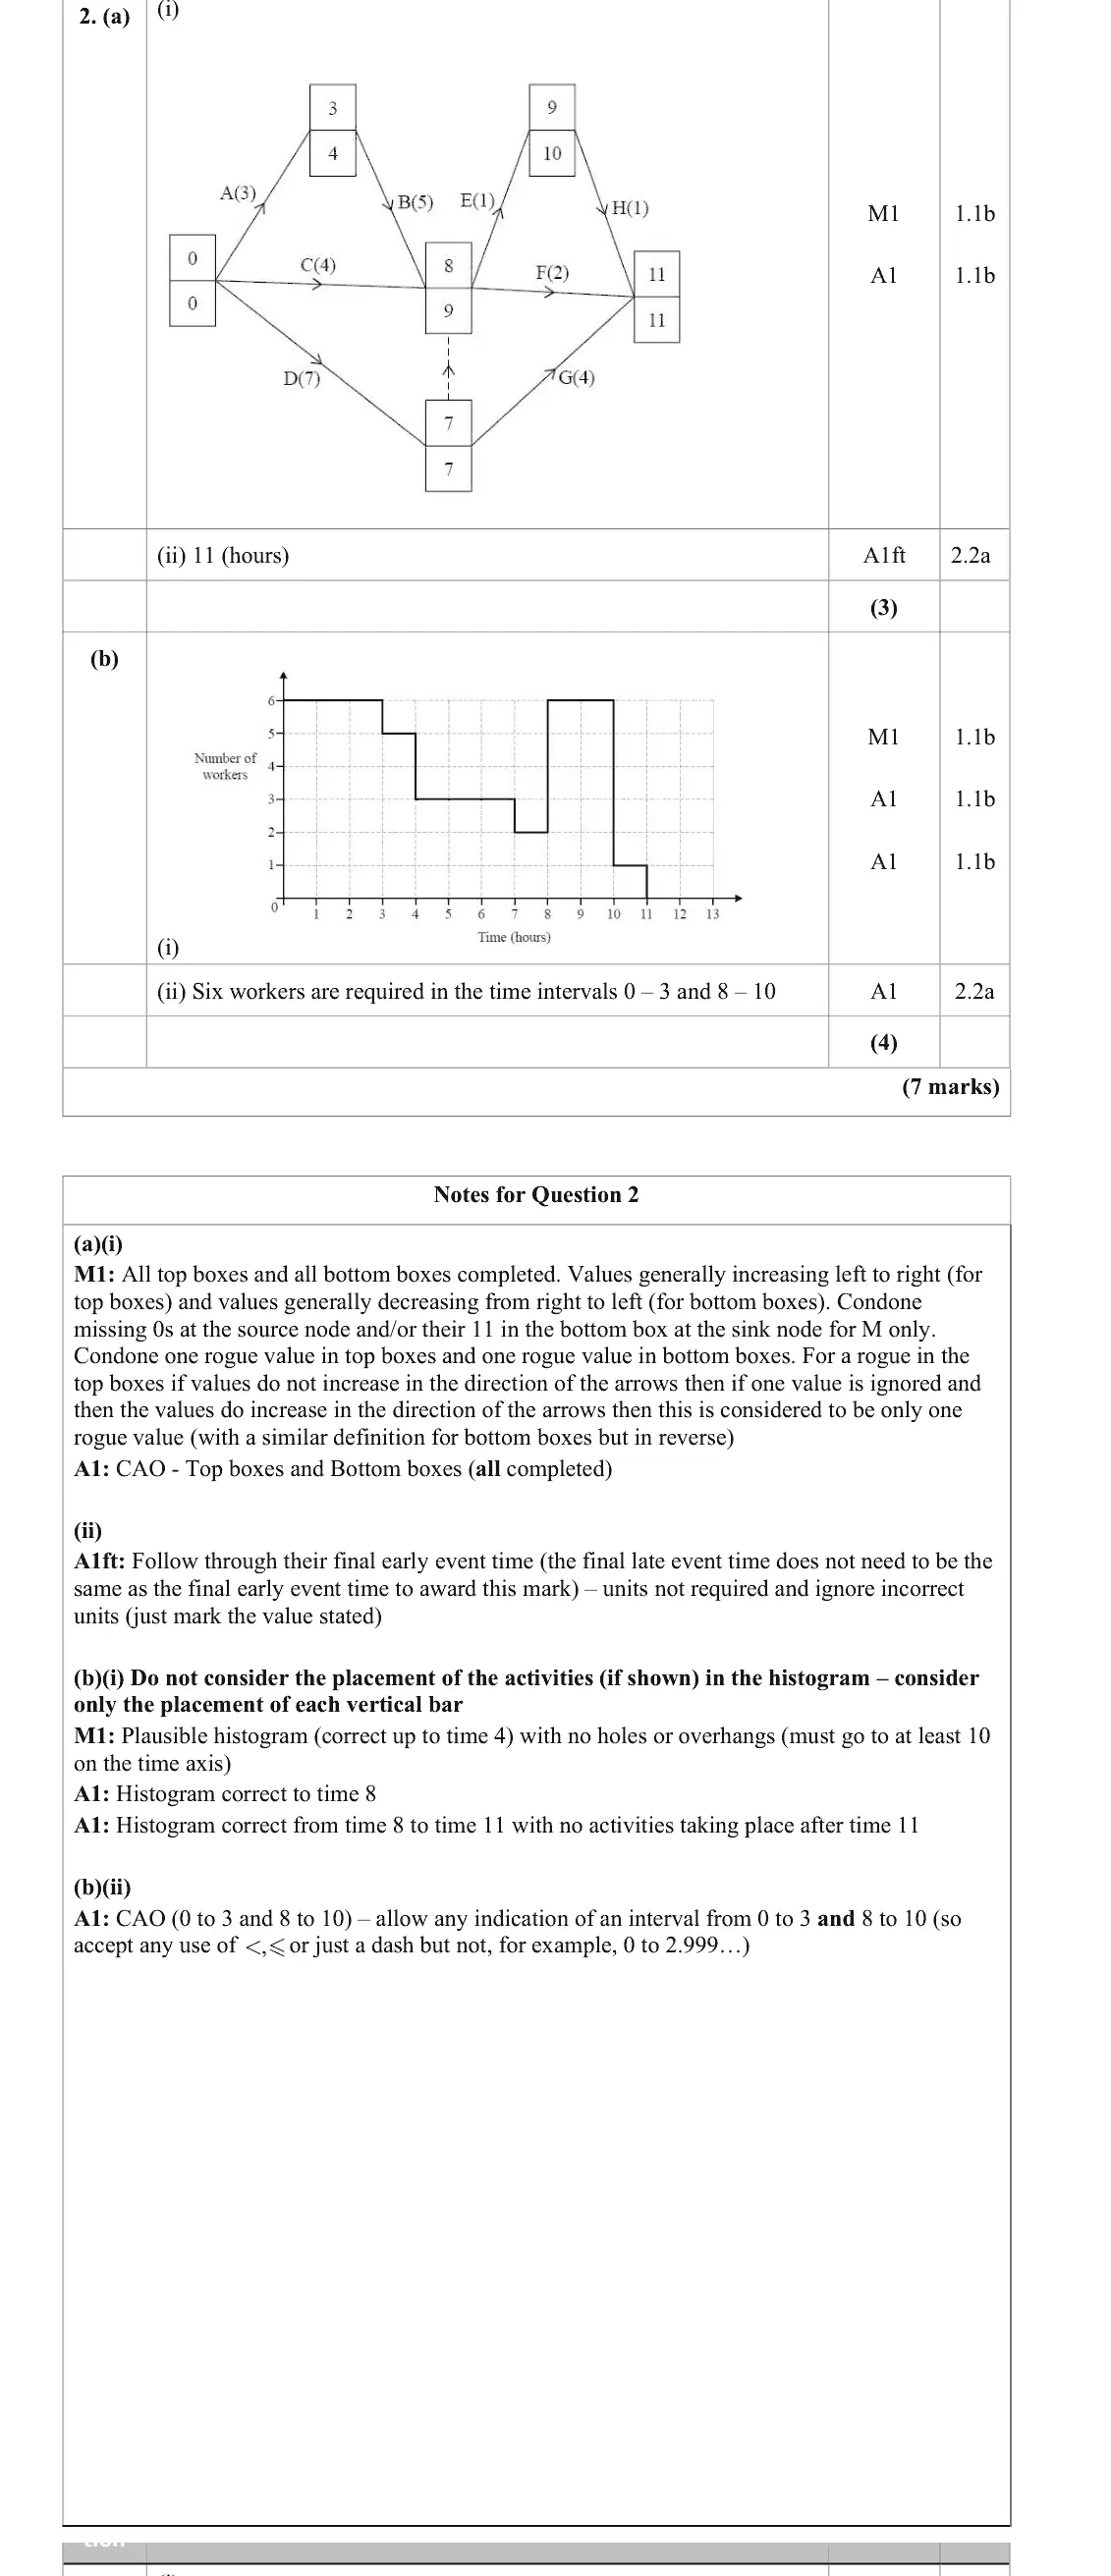
late time at the end of A is 4 (3 was the common error)
minimum completion time 11 hours
June 2023 · Paper 3D (Decision 1) · Q2(b)4 marks
Mark scheme (whole question; this part is marked with the orange bar)
Examiner's comment
This question proved accessible to most candidates. The most common error was a 3 as the late time at the end of activity A. As the resource histogram, in part (b), is an addition to the new linear specification, it was pleasing to see that most candidates were able to make a reasonable attempt at this part, at least gaining the initial method mark, for a plausible answer correct up to time 4. Many responses were then also correct up to time 8, gaining the second mark. Some candidates did struggle to complete the histogram correctly, with various errors seen between times 8 and 11. As a result, they had an incorrect time interval for the final mark.
Key points from the mark scheme and examiner's report
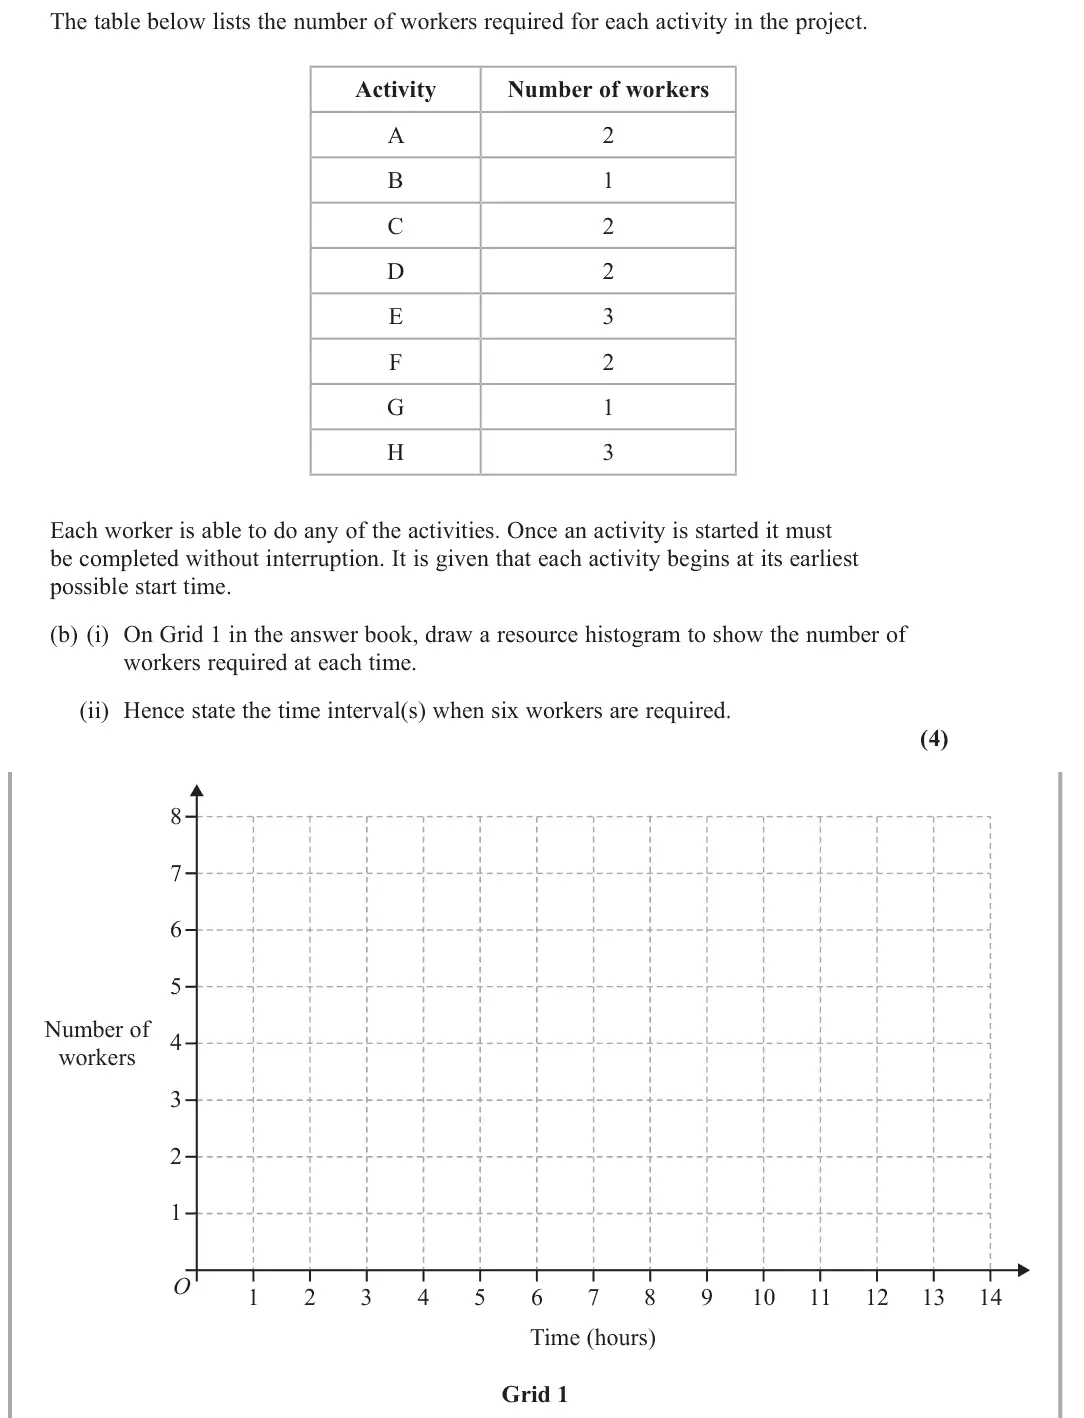
each activity at its earliest start, workers from the table
no holes or overhangs, nothing after time 11
six workers needed 0–3 and 8–10
errors mostly between 8 and 11
June 2023 · Paper 3D (Decision 1) · Q6(a)5 marks
Mark scheme (whole question; this part is marked with the orange bar)
Examiner's comment
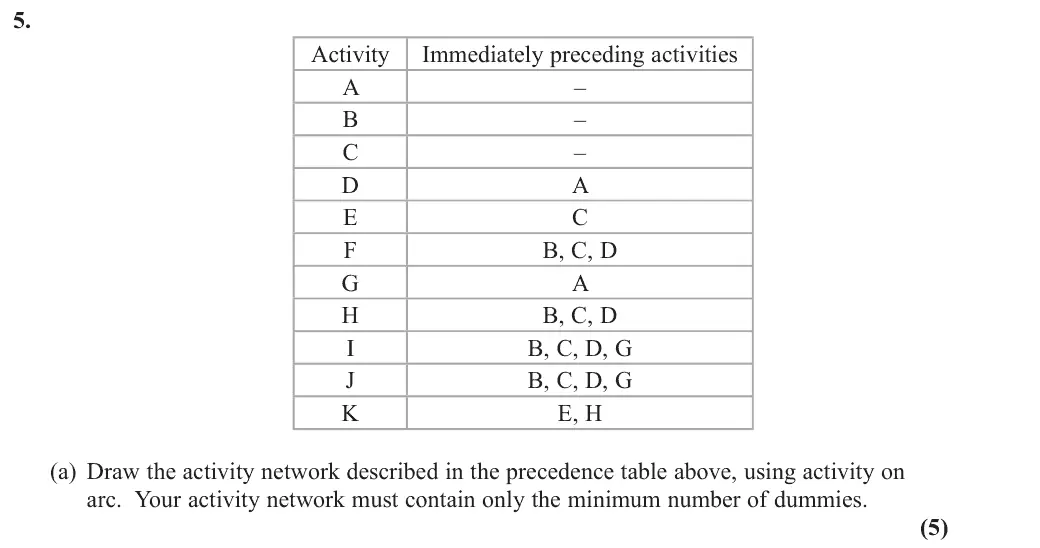
In almost all cases, candidates understood that activities should be on arcs rather than nodes and that the network should have a single source node. As a result, almost all responses scored some, if not all, of the available marks. The general structure of the graph was usually correct but errors in the use of dummies were often the cause for a loss of marks. The inclusion of surplus dummies was not uncommon (usually at the end of activity A or D or E). Some candidates seemed reluctant for arcs representing activities to either bend or intersect other arcs which therefore seems to explain the inclusion of extra, unnecessary dummies. From time to time, candidates missed the uniqueness dummy at the end of activity I (or J). A minority of candidates omitted a single activity, usually H, or failed to show arrows on all activities. A more costly error was to omit arrows on dummies. Occasionally, networks did not have a single sink node where candidates failed to bring the ends of activities H, K and L together. A minority of candidates drew multiple copies of almost identical graphs, usually not making much if any improvement from one to the next and in some cases producing less accurate networks due to miscopying. It seems to be very costly in term of time to be producing multiple networks and candidates should be advised to focus on a single accurate network.
Key points from the mark scheme and examiner's report
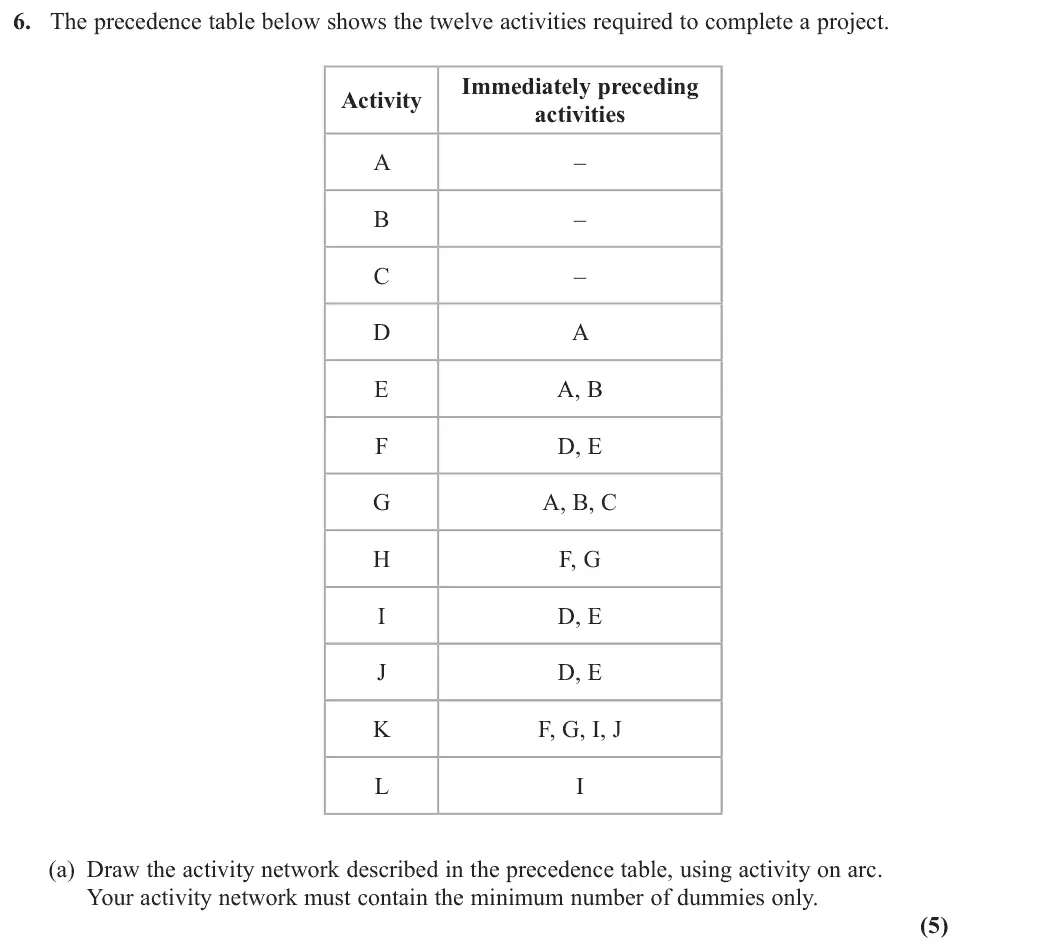
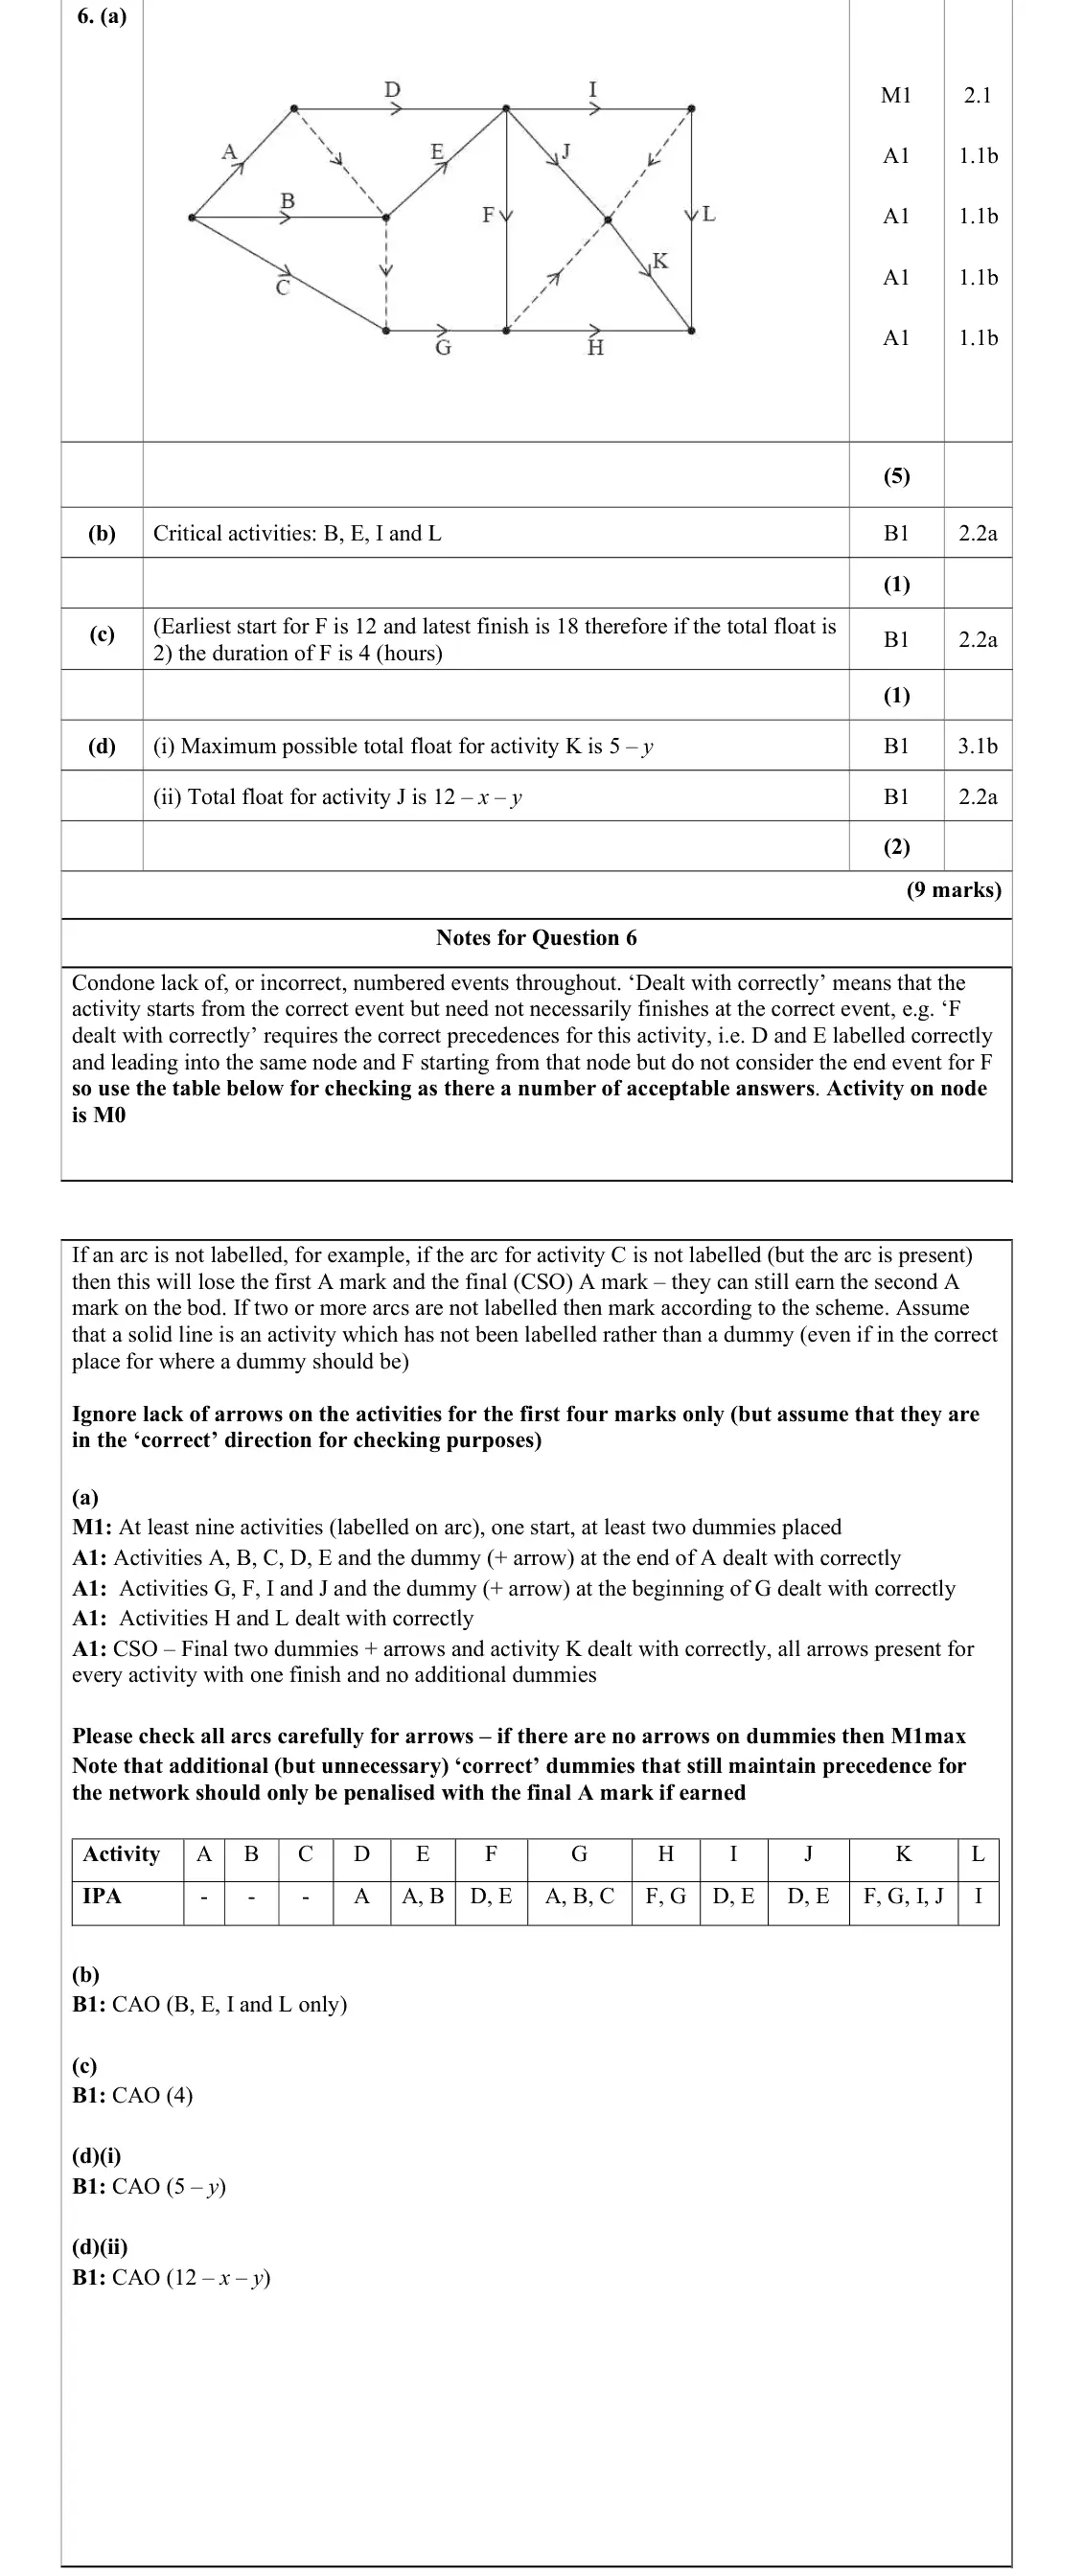
activity on arc with minimum dummies
surplus dummies after A, D or E and missing the uniqueness dummy for I/J were common
arrows on dummies
June 2023 · Paper 3D (Decision 1) · Q6(b)1 mark
Mark scheme (whole question; this part is marked with the orange bar)
Examiner's comment
Part (b) was answered correctly in all but a small handful of responses. Part (c) by contrast was far more of a challenge and was frequently left blank. Many candidates were unsuccessful in identifying the relevant values for the window in which activity F could occur, with many incorrectly assuming the latest F could finish was at time 16. The most common incorrect duration stated was ‘2’ which was probably more common than the correct value of ‘4’.
Key points from the mark scheme and examiner's report
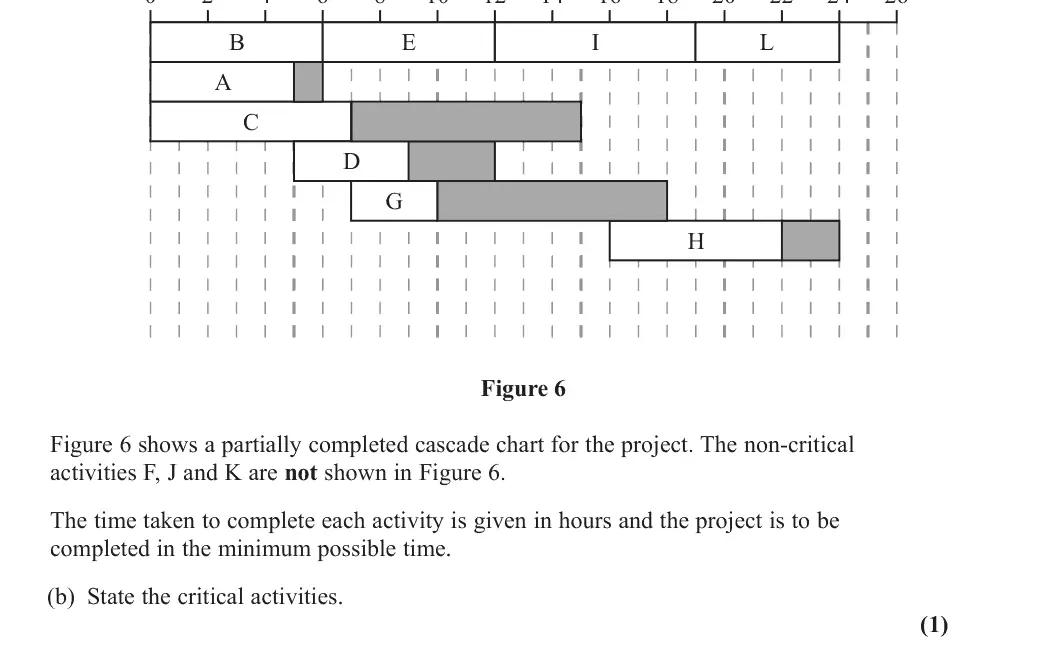
critical activities B, E, I, L (the bars with no float in the cascade chart)
June 2023 · Paper 3D (Decision 1) · Q6(c)1 mark
Mark scheme (whole question; this part is marked with the orange bar)
Examiner's comment
Part (b) was answered correctly in all but a small handful of responses. Part (c) by contrast was far more of a challenge and was frequently left blank. Many candidates were unsuccessful in identifying the relevant values for the window in which activity F could occur, with many incorrectly assuming the latest F could finish was at time 16. The most common incorrect duration stated was ‘2’ which was probably more common than the correct value of ‘4’.
Key points from the mark scheme and examiner's report
F can start at 12 and must finish by 18 (start of H), so 18 − 12 − 2 = 4 hours
2 was a common wrong answer
June 2023 · Paper 3D (Decision 1) · Q6(d)2 marks
Mark scheme (whole question; this part is marked with the orange bar)
Examiner's comment
Part (d) was not answered well by many candidates and proved to be a good discriminator. There was confusion evident in both parts with incorrect values being used in many cases. For the float of activity K, a reasonable number of candidates correctly identified the interval 19 – 24 and knew that this interval was shared between the float and activity length. A common error was assuming that the length of activity J influenced this in the stated maximum case, despite the question stating that it should be in terms of 𝑦. For the float of J, few candidates identified the correct interval from 12 – 24, with a common error using the earliest finish time of activity D or the end of activity I. Other incorrect answers involved incorrectly using the float of activity K rather than the duration of K e.g. 24 -12 -𝑥-(5 -𝑦).
Key points from the mark scheme and examiner's report
K sits in the window 19–24: maximum float 5 − y
J from 12 to the start of K at 24 − y: float 12 − x − y
good discriminator
June 2022 · AS Paper 2 (Decision 1) · Q2(a)5 marks
Mark scheme (whole question; this part is marked with the orange bar)
Examiner's comment
Most candidates were able to make a good attempt, using activity on arc, gaining at least three of the five marks available in (a). One mark was commonly lost for arrows omitted from one or more activity arcs, or for including superfluous dummy activities. Candidates should be reminded that an arrow is an essential part of each arc. A good proportion of candidates scored the mark in (b). However, some lost the mark in this part for failing to mention sufficient
Key points from the mark scheme and examiner's report
activity on arc with the minimum number of dummies
arrows needed on every arc and dummy
superfluous dummies lose the final mark
activity on node scores M0
June 2022 · AS Paper 2 (Decision 1) · Q2(b)1 mark
Mark scheme (whole question; this part is marked with the orange bar)
Examiner's comment
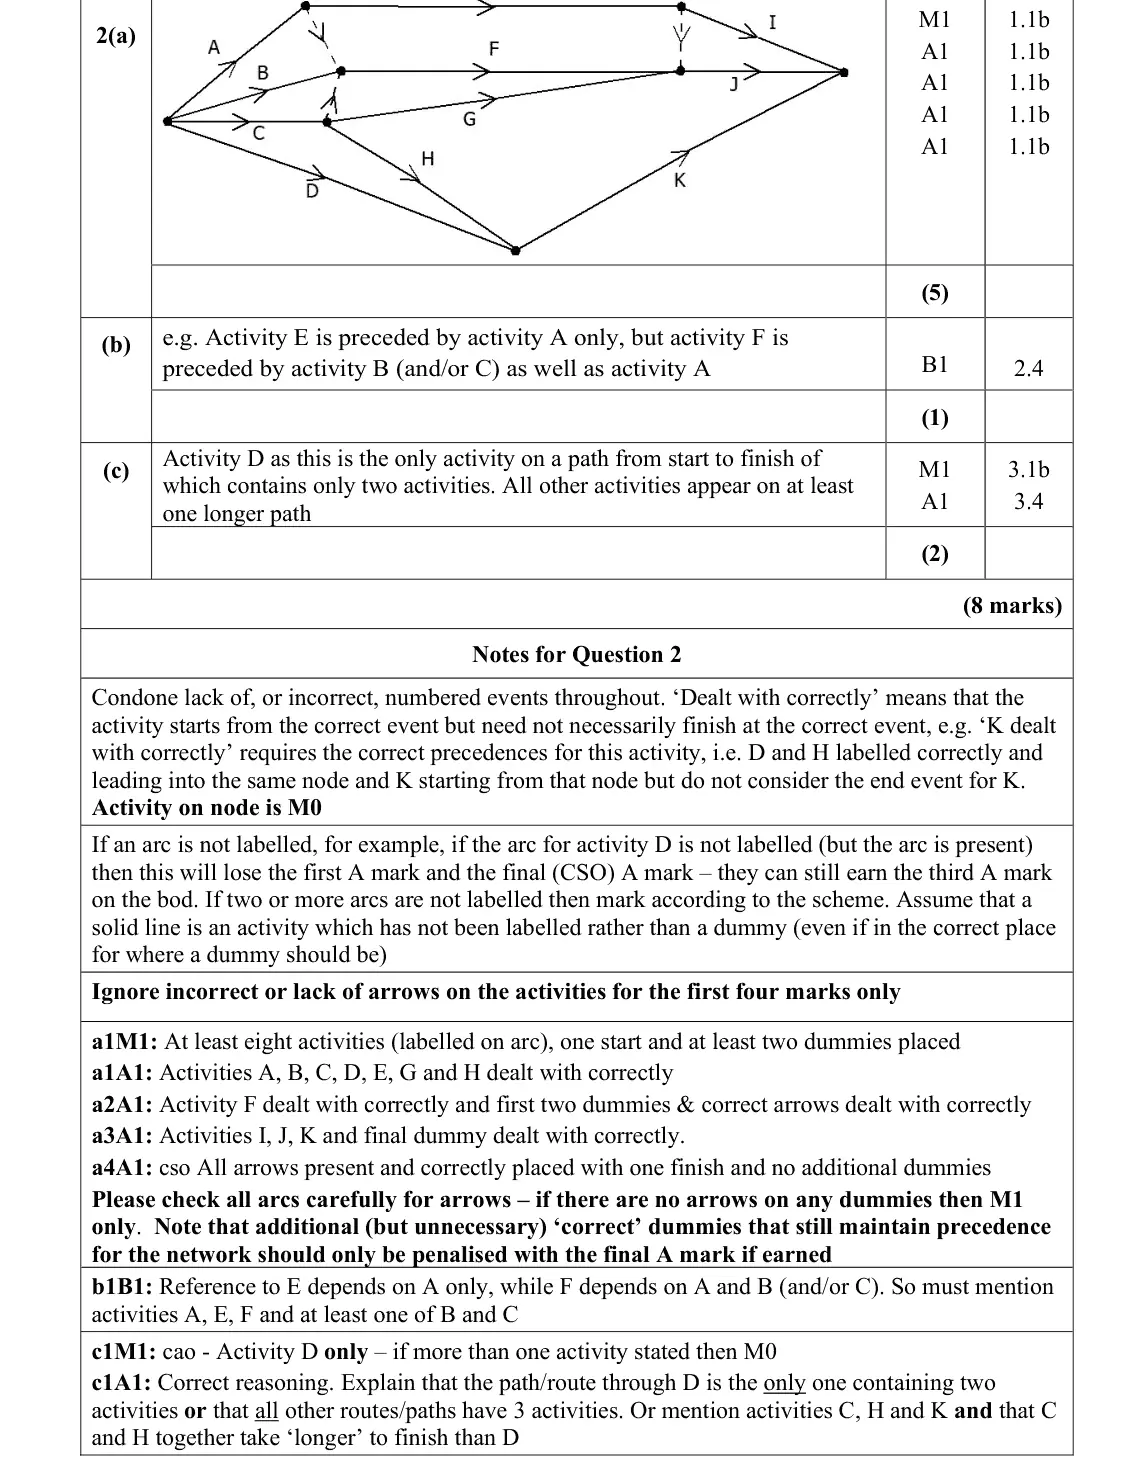
Most candidates were able to make a good attempt, using activity on arc, gaining at least three the mark in (b). However, some lost the mark in this part for failing to mention sufficient relevant activities, which were E, F, A, plus B and/or C. As expected, (c) differentiated well
Key points from the mark scheme and examiner's report
E depends on A only but F depends on A and B and/or C
must mention A, E, F and B or C
June 2022 · AS Paper 2 (Decision 1) · Q2(c)2 marks
Mark scheme (whole question; this part is marked with the orange bar)
Examiner's comment
Most candidates were able to make a good attempt, using activity on arc, gaining at least three relevant activities, which were E, F, A, plus B and/or C. As expected, (c) differentiated well with very few candidates scoring both marks. Of those who realised that activity D could not be critical only a few were able to explain why.
Key points from the mark scheme and examiner's report
D only: the path through D has only two activities while every other activity lies on a path of three
few could justify
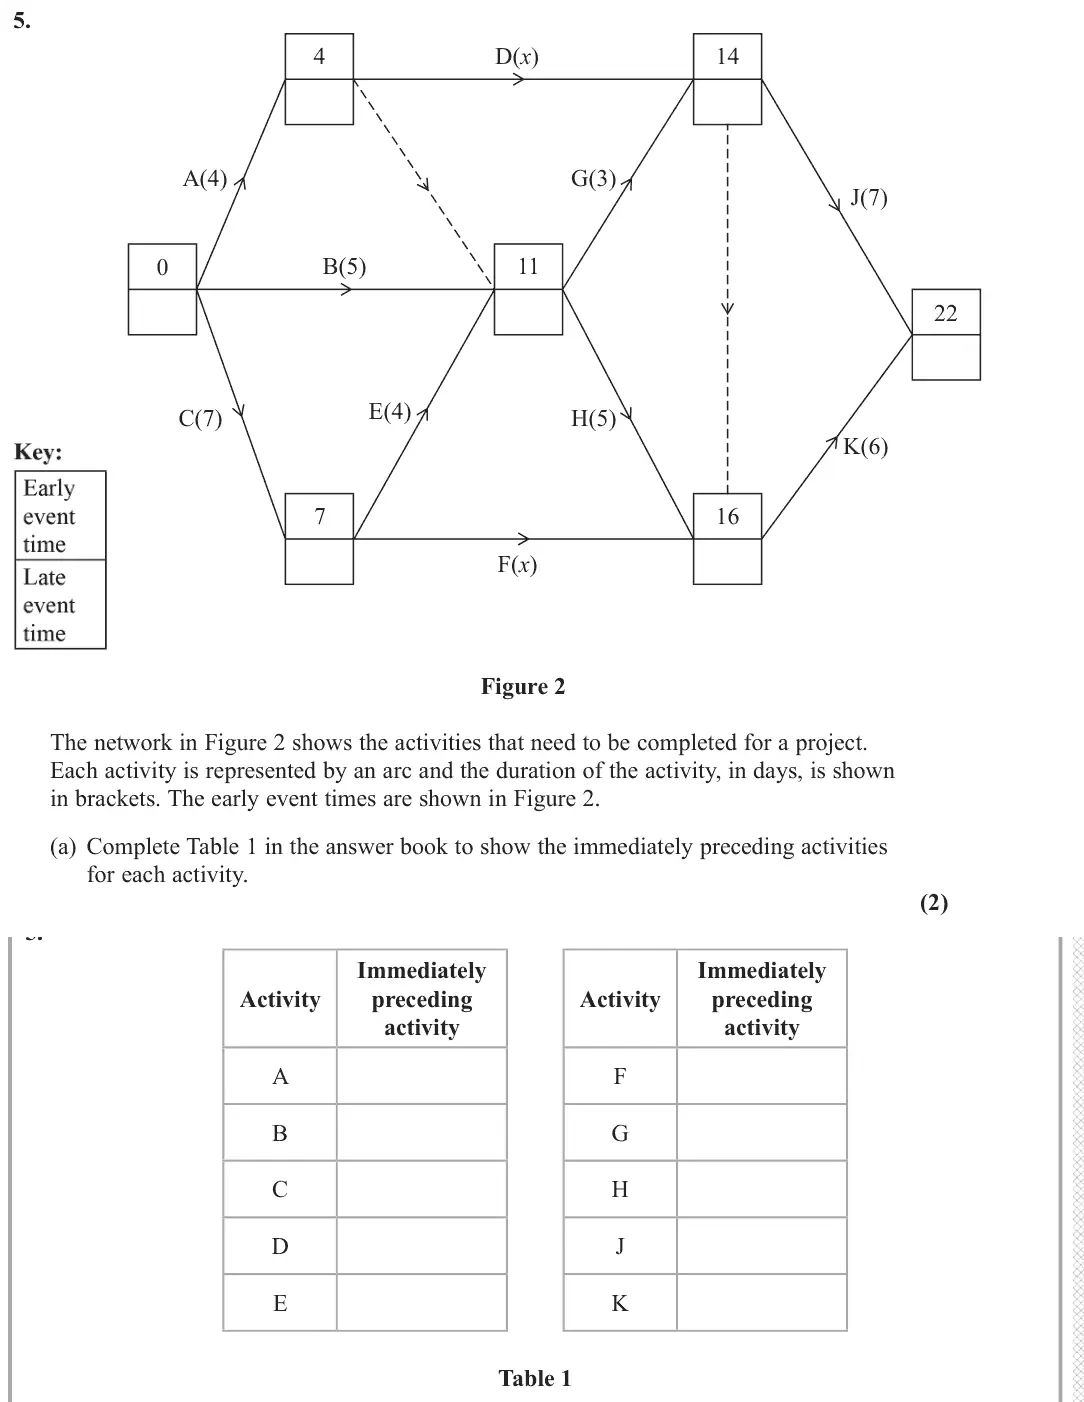
June 2022 · Paper 3D (Decision 1) · Q5(a)2 marks
Mark scheme (whole question; this part is marked with the orange bar)
Examiner's comment
This question was accessible to most candidates. In (a) most candidates were able to list the immediately preceding activities, although a small number made errors e.g., omitting one of the activities from K or listing A, B, C instead of A, B, E for G and H. Most candidates recognized that the value of m depended on the late event times of D and F and the majority gave the correct value of 9. However, some gave an incorrect value of 8 or 10 and others incorrectly stated that x = 9. Answers giving the correct value of m as an inequality for x were accepted.
Key points from the mark scheme and examiner's report
e.g. D: A
E: C
F: C
G, H: A, B, E
J: D, G
K: D, F, G, H
G and H listed as A, B, C was a common error
Table 1 is in the answer book
June 2022 · Paper 3D (Decision 1) · Q5(b)1 mark
Mark scheme (whole question; this part is marked with the orange bar)
Examiner's comment
This question was accessible to most candidates. In (a) most candidates were able to list the immediately preceding activities, although a small number made errors e.g., omitting one of the activities from K or listing A, B, C instead of A, B, E for G and H. Most candidates recognized that the value of m depended on the late event times of D and F and the majority gave the correct value of 9. However, some gave an incorrect value of 8 or 10 and others incorrectly stated that x = 9. Answers giving the correct value of m as an inequality for x were accepted. In (c) most candidates made a good attempt at completing the late event times although many failed to give the correct expression of (15 – x) for the late event time at the end of activity A. Most candidates stated the correct critical activities and the value of the float for G in (d). Virtually all candidates extracted the required number of workers from the resource histogram and completed the table correctly in (e). In (f) most candidates attempted to draw a Gantt Chart, although some did not attempt this, and a small number drew a scheduling diagram instead. Those candidates who attempted the Gantt Chart drew the critical activities correctly and most also drew activities B, G and J correctly. Some candidates explicitly stated the value of x and then went on to draw D and F correctly and others implied the correct value of x from D and F shown on their Gantt Chart. A significant number of candidates made errors with the float for activity A.
Key points from the mark scheme and examiner's report
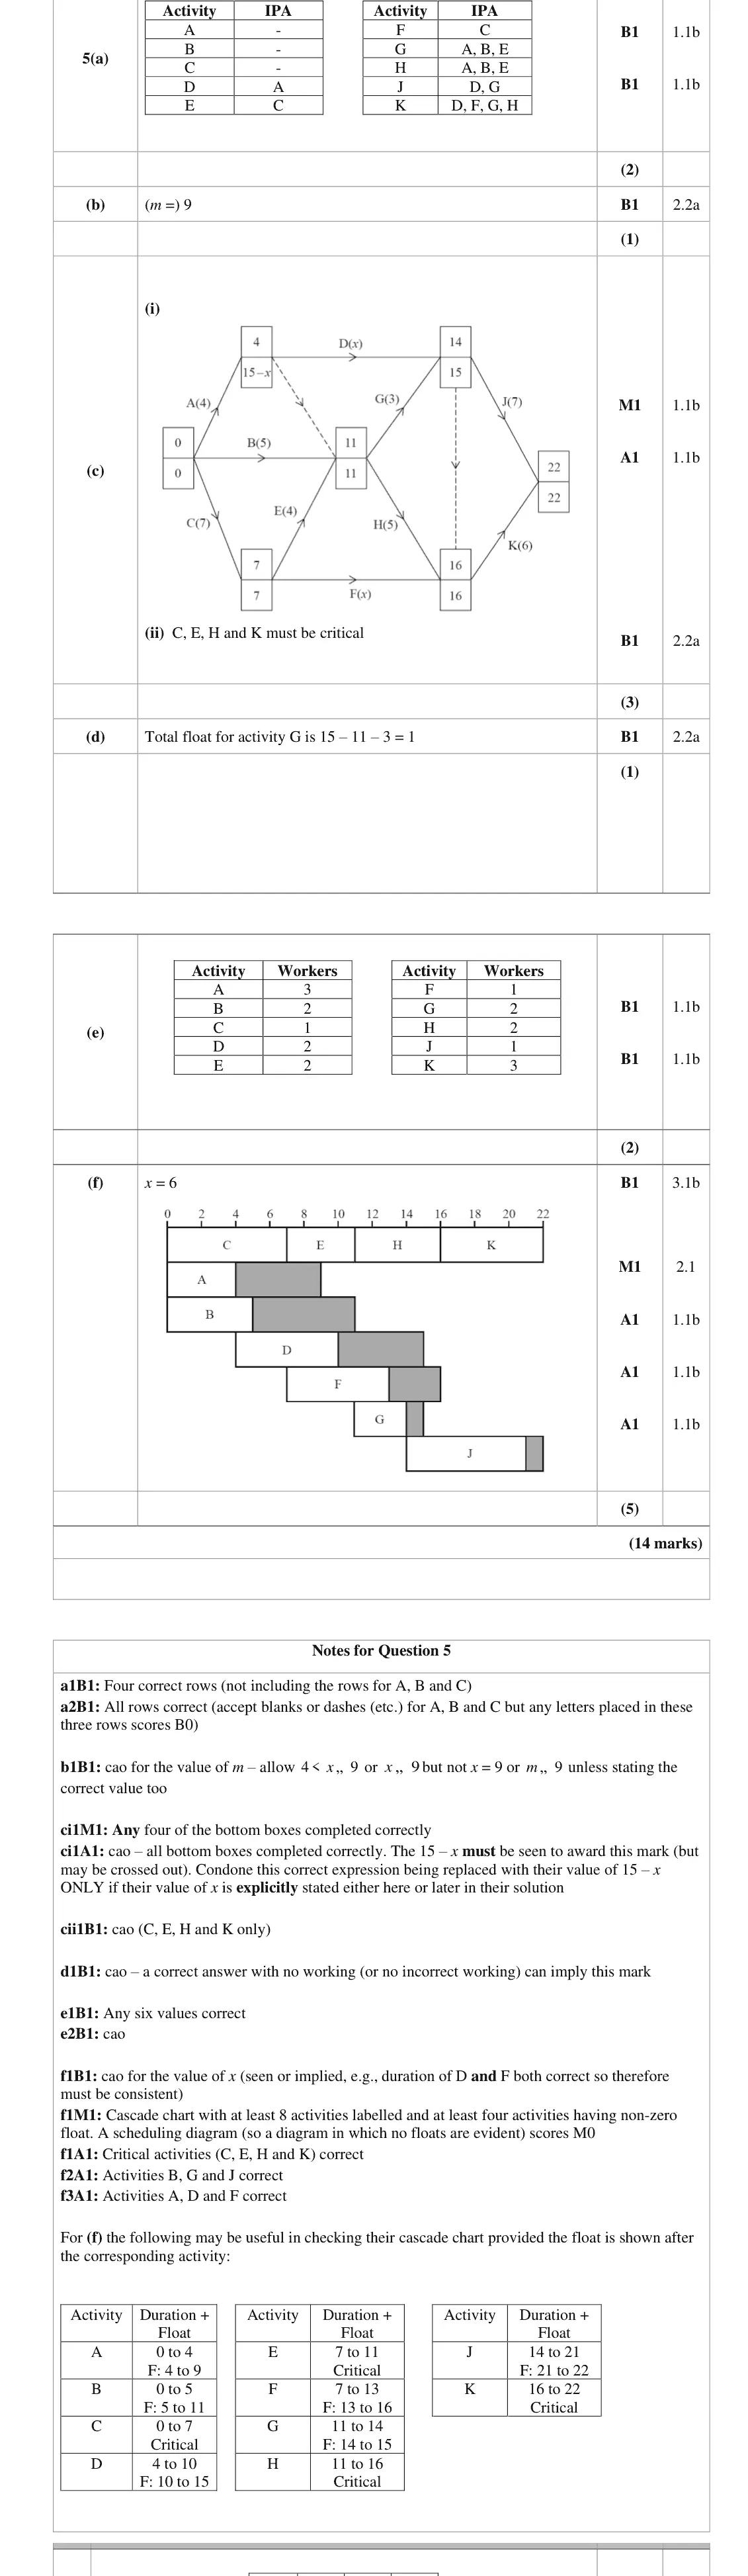
early event times 14 and 16 fix the durations of D and F: 4 + x ≤ 14 and 7 + x ≤ 16 give m = 9
8, 10 or "x = 9" seen
June 2022 · Paper 3D (Decision 1) · Q5(c)3 marks
Mark scheme (whole question; this part is marked with the orange bar)
Examiner's comment
In (c) most candidates made a good attempt at completing the late event times although many failed to give the correct expression of (15 – x) for the late event time at the end of activity A. Most candidates stated the correct critical activities and the value of the float for G in (d).
Key points from the mark scheme and examiner's report
backward pass: late time at the end of A is 15 − x
C, E, H and K must be critical
June 2022 · Paper 3D (Decision 1) · Q5(d)1 mark
Mark scheme (whole question; this part is marked with the orange bar)
Examiner's comment
Most candidates stated the correct critical activities and the value of the float for G in (d). Virtually all candidates extracted the required number of workers from the resource histogram and completed the table correctly in (e).
Key points from the mark scheme and examiner's report
total float of G = 15 − 11 − 3 = 1
June 2022 · Paper 3D (Decision 1) · Q5(e)2 marks
Mark scheme (whole question; this part is marked with the orange bar)
Examiner's comment
and completed the table correctly in (e).
Key points from the mark scheme and examiner's report
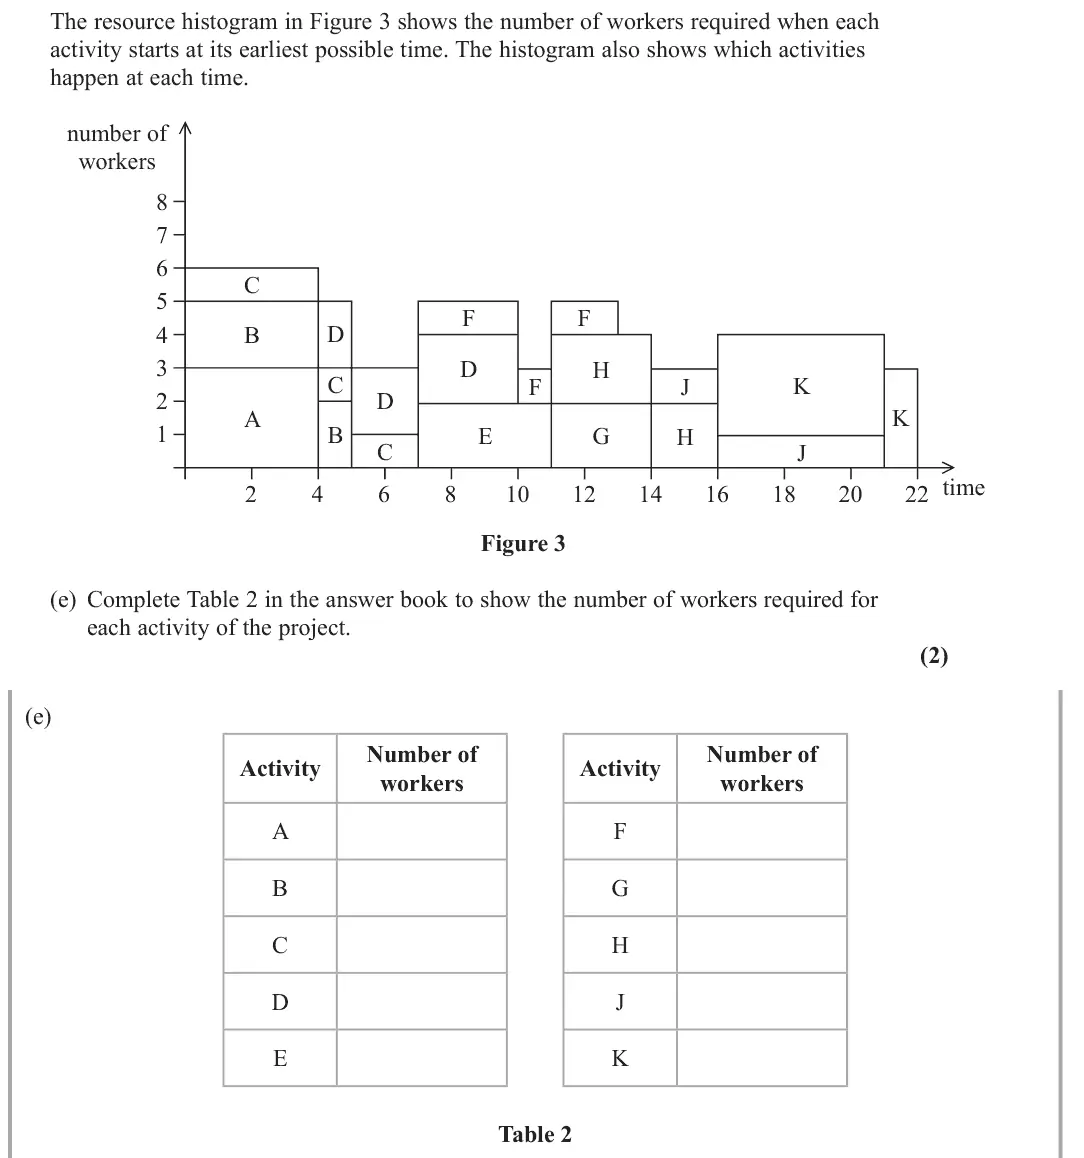
read the workers per activity from the histogram: A 3, B 2, C 1, D 2, E 2, F 1, G 2, H 2, J 1, K 3
Table 2 is in the answer book
June 2022 · Paper 3D (Decision 1) · Q5(f)5 marks
Mark scheme (whole question; this part is marked with the orange bar)
Examiner's comment
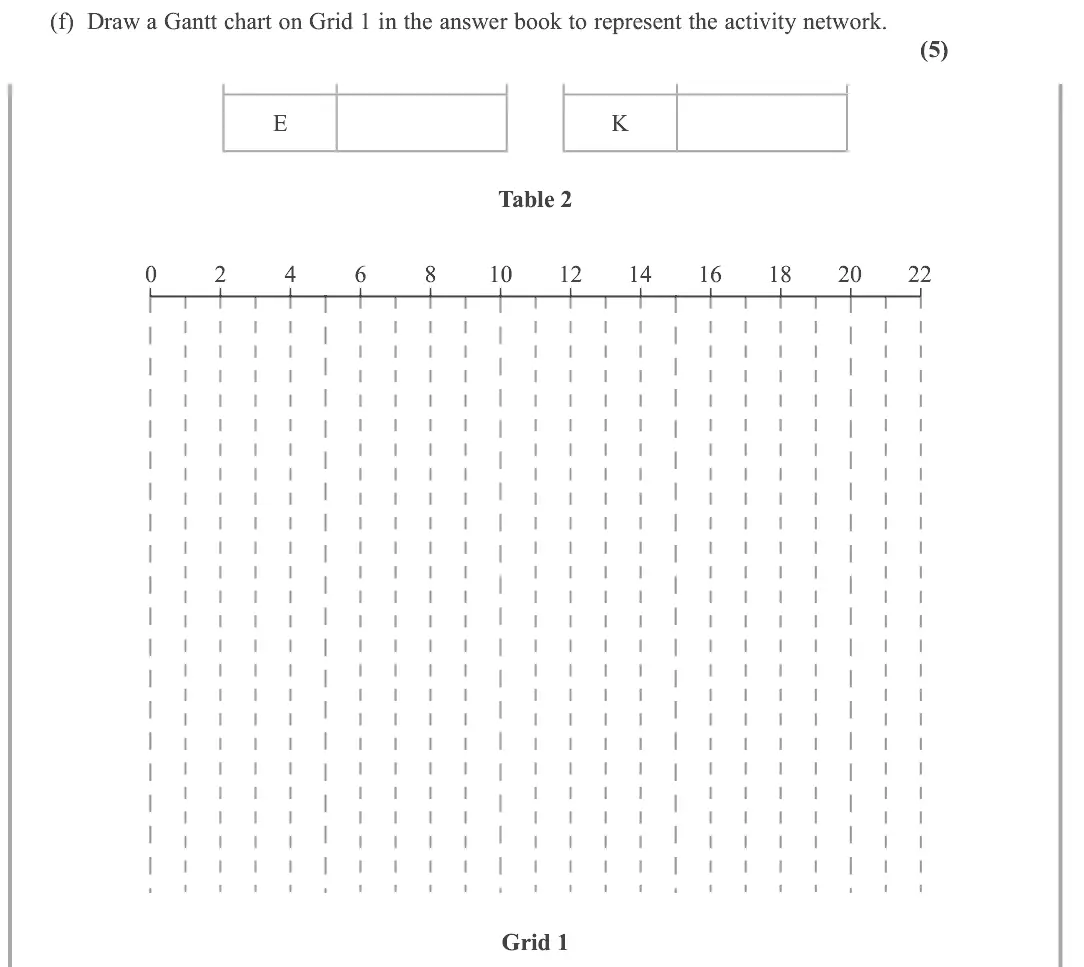
In (f) most candidates attempted to draw a Gantt Chart, although some did not attempt this, and a small number drew a scheduling diagram instead. Those candidates who attempted the Gantt Chart drew the critical activities correctly and most also drew activities B, G and J correctly. Some candidates explicitly stated the value of x and then went on to draw D and F correctly and others implied the correct value of x from D and F shown on their Gantt Chart. A significant number of candidates made errors with the float for activity A.
Key points from the mark scheme and examiner's report
deduce x = 6 from the histogram (D and F end by time 10 and 13)
cascade chart with floats shown
critical C, E, H, K
errors mostly on A's float
a scheduling diagram scores 0
Nov 2021 · Paper 3D (Decision 1) · Q2(a)4 marks
Mark scheme (whole question; this part is marked with the orange bar)
Examiner's comment
This was a standard question on critical path analysis and was a good source of marks for most
Key points from the mark scheme and examiner's report
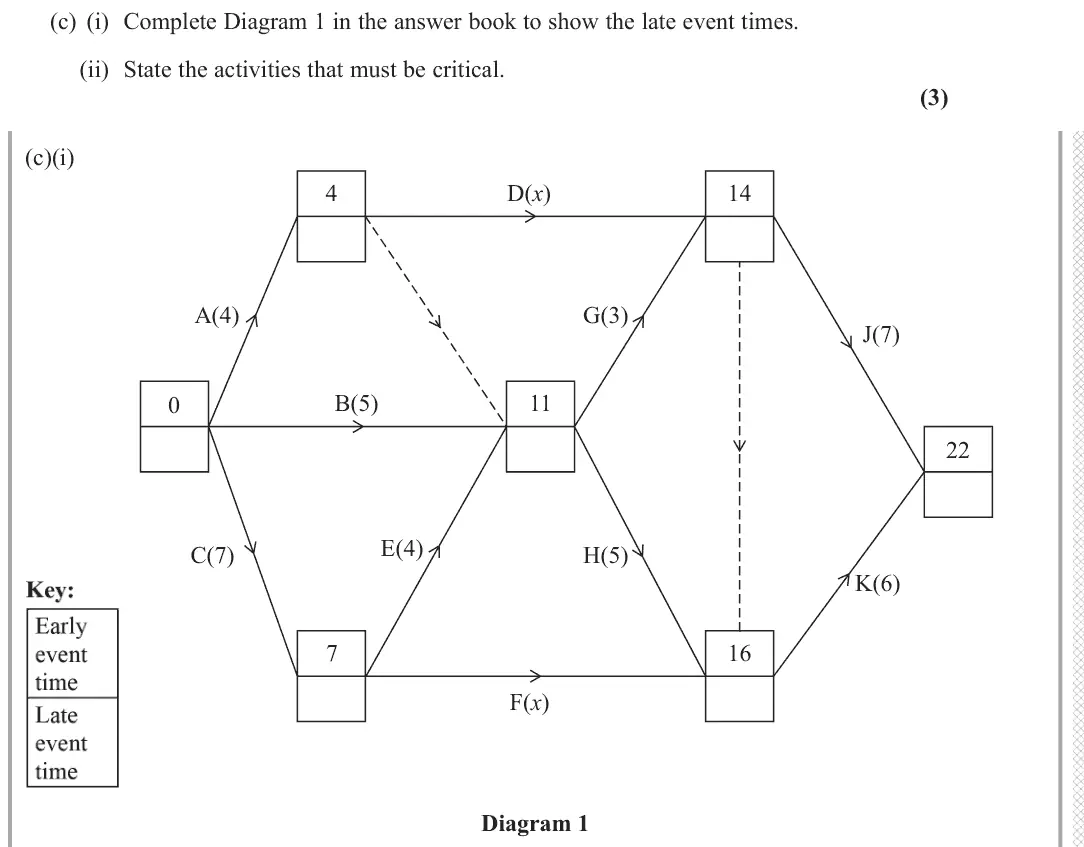
forward pass for early, backward pass for late event times including dummies
project length 22 hours
Nov 2021 · Paper 3D (Decision 1) · Q2(b)2 marks
Mark scheme (whole question; this part is marked with the orange bar)
Examiner's comment
This was a standard question on critical path analysis and was a good source of marks for most
Key points from the mark scheme and examiner's report
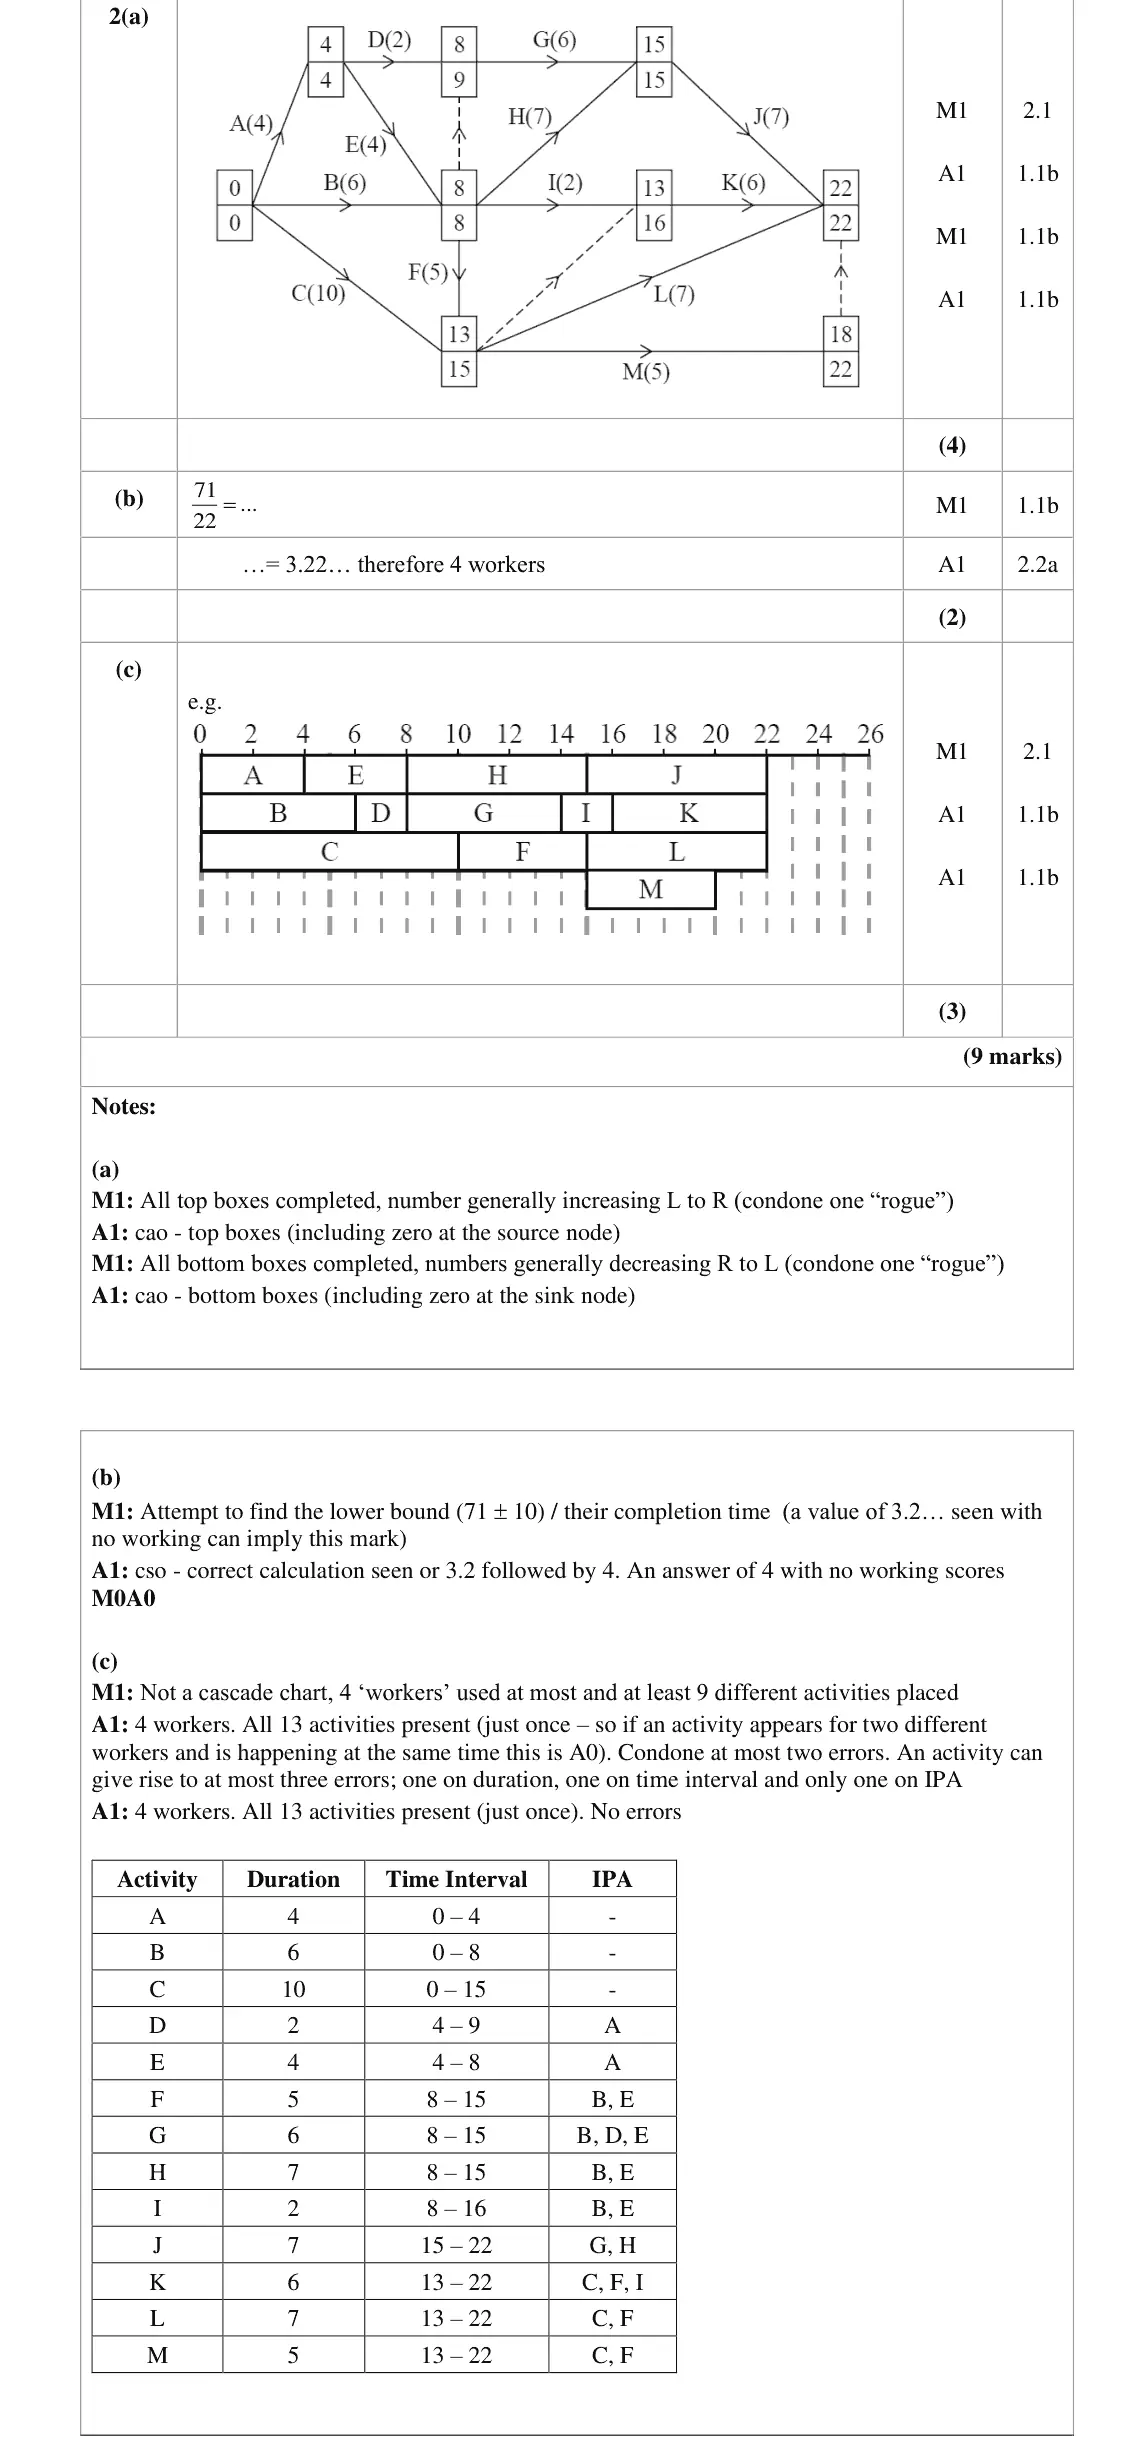
71/22 = 3.2… so at least 4 workers
4 with no working scores 0
Nov 2021 · Paper 3D (Decision 1) · Q2(c)3 marks
Mark scheme (whole question; this part is marked with the orange bar)
Examiner's comment
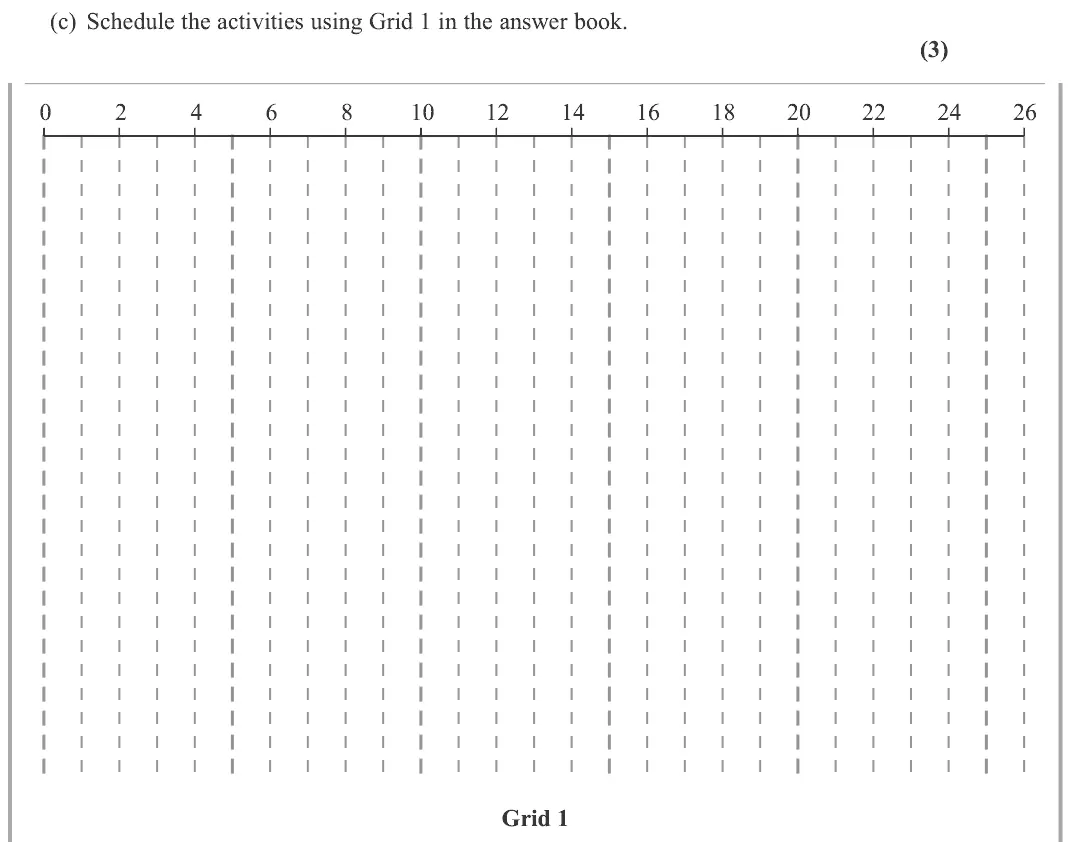
This was a standard question on critical path analysis and was a good source of marks for most of the candidates. The main issues seen were in part (c) in which some candidates’ schedules contained either 3 or 5 workers (rather than the correct number of 4). Candidates are reminded to check the duration, time-interval, and immediately preceding activities for each activity very carefully when constructing a schedule of the workers to activities.
Key points from the mark scheme and examiner's report
4 workers, not 3 or 5
check every activity's duration, time interval and immediate predecessors
not a cascade chart
Nov 2021 · Paper 3D (Decision 1) · Q7(a)2 marks
Mark scheme (whole question; this part is marked with the orange bar)
Examiner's comment
This second question on critical path analysis was answered extremely well with most scoring
Key points from the mark scheme and examiner's report
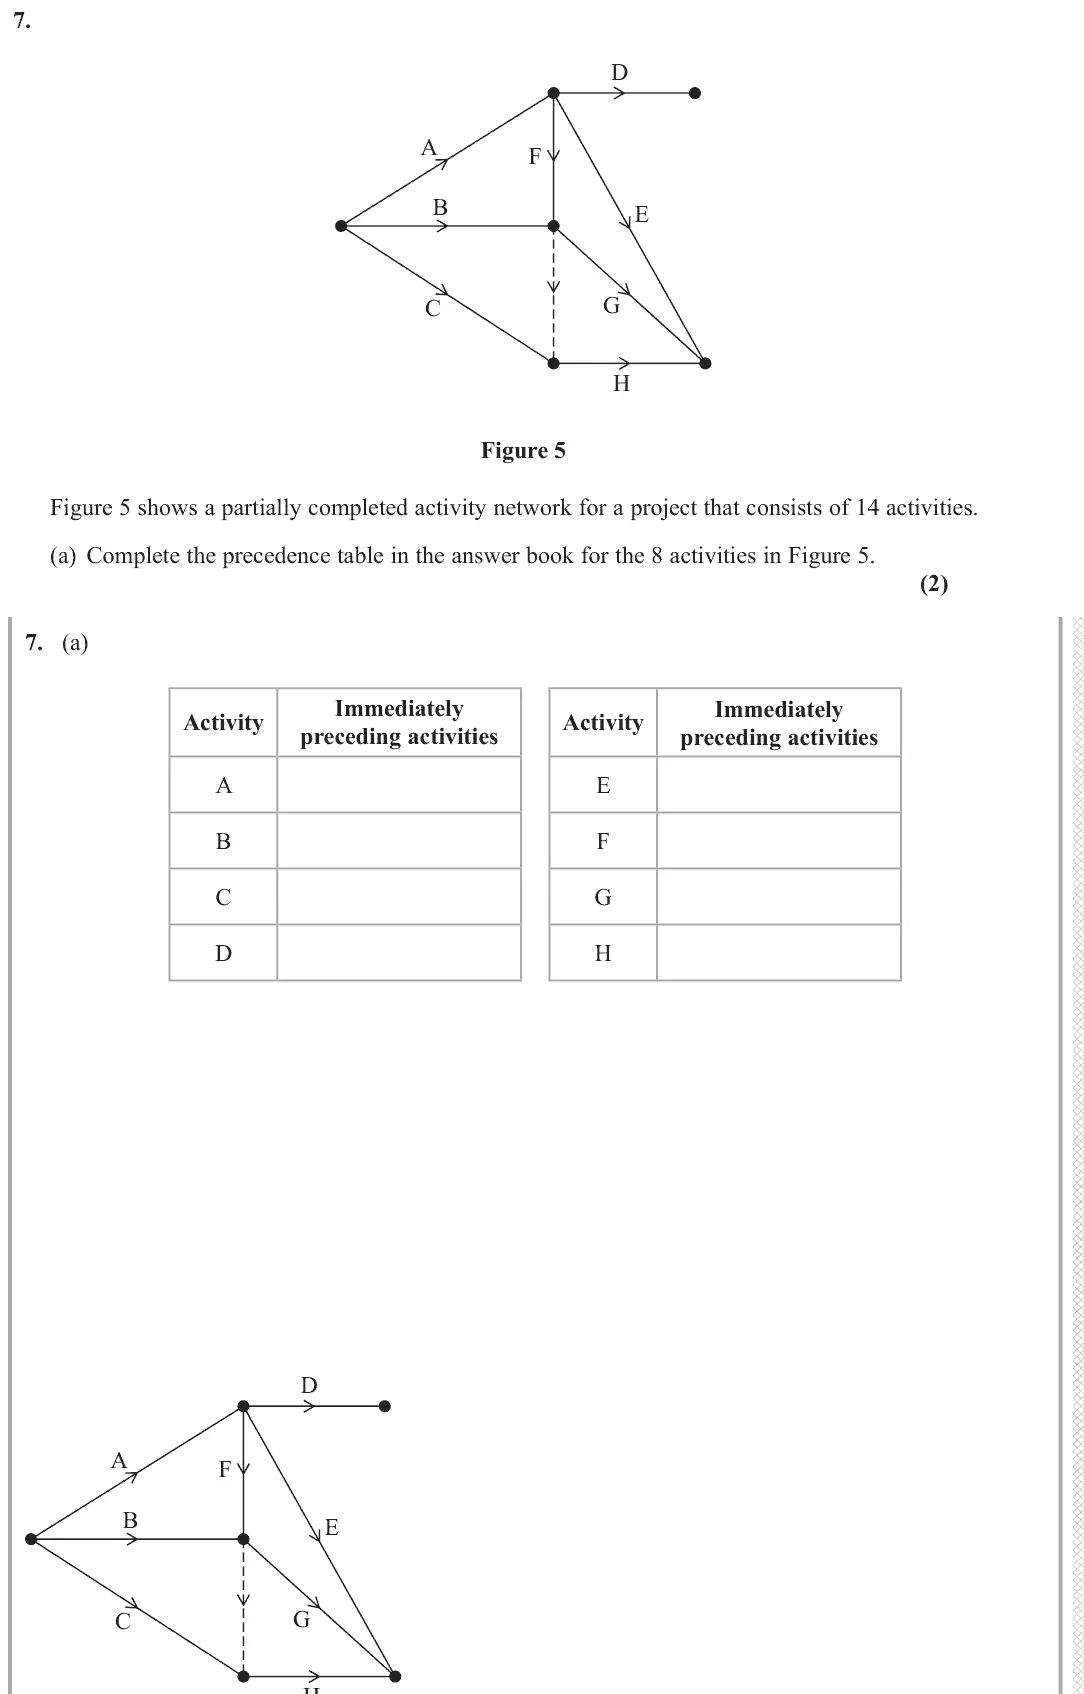
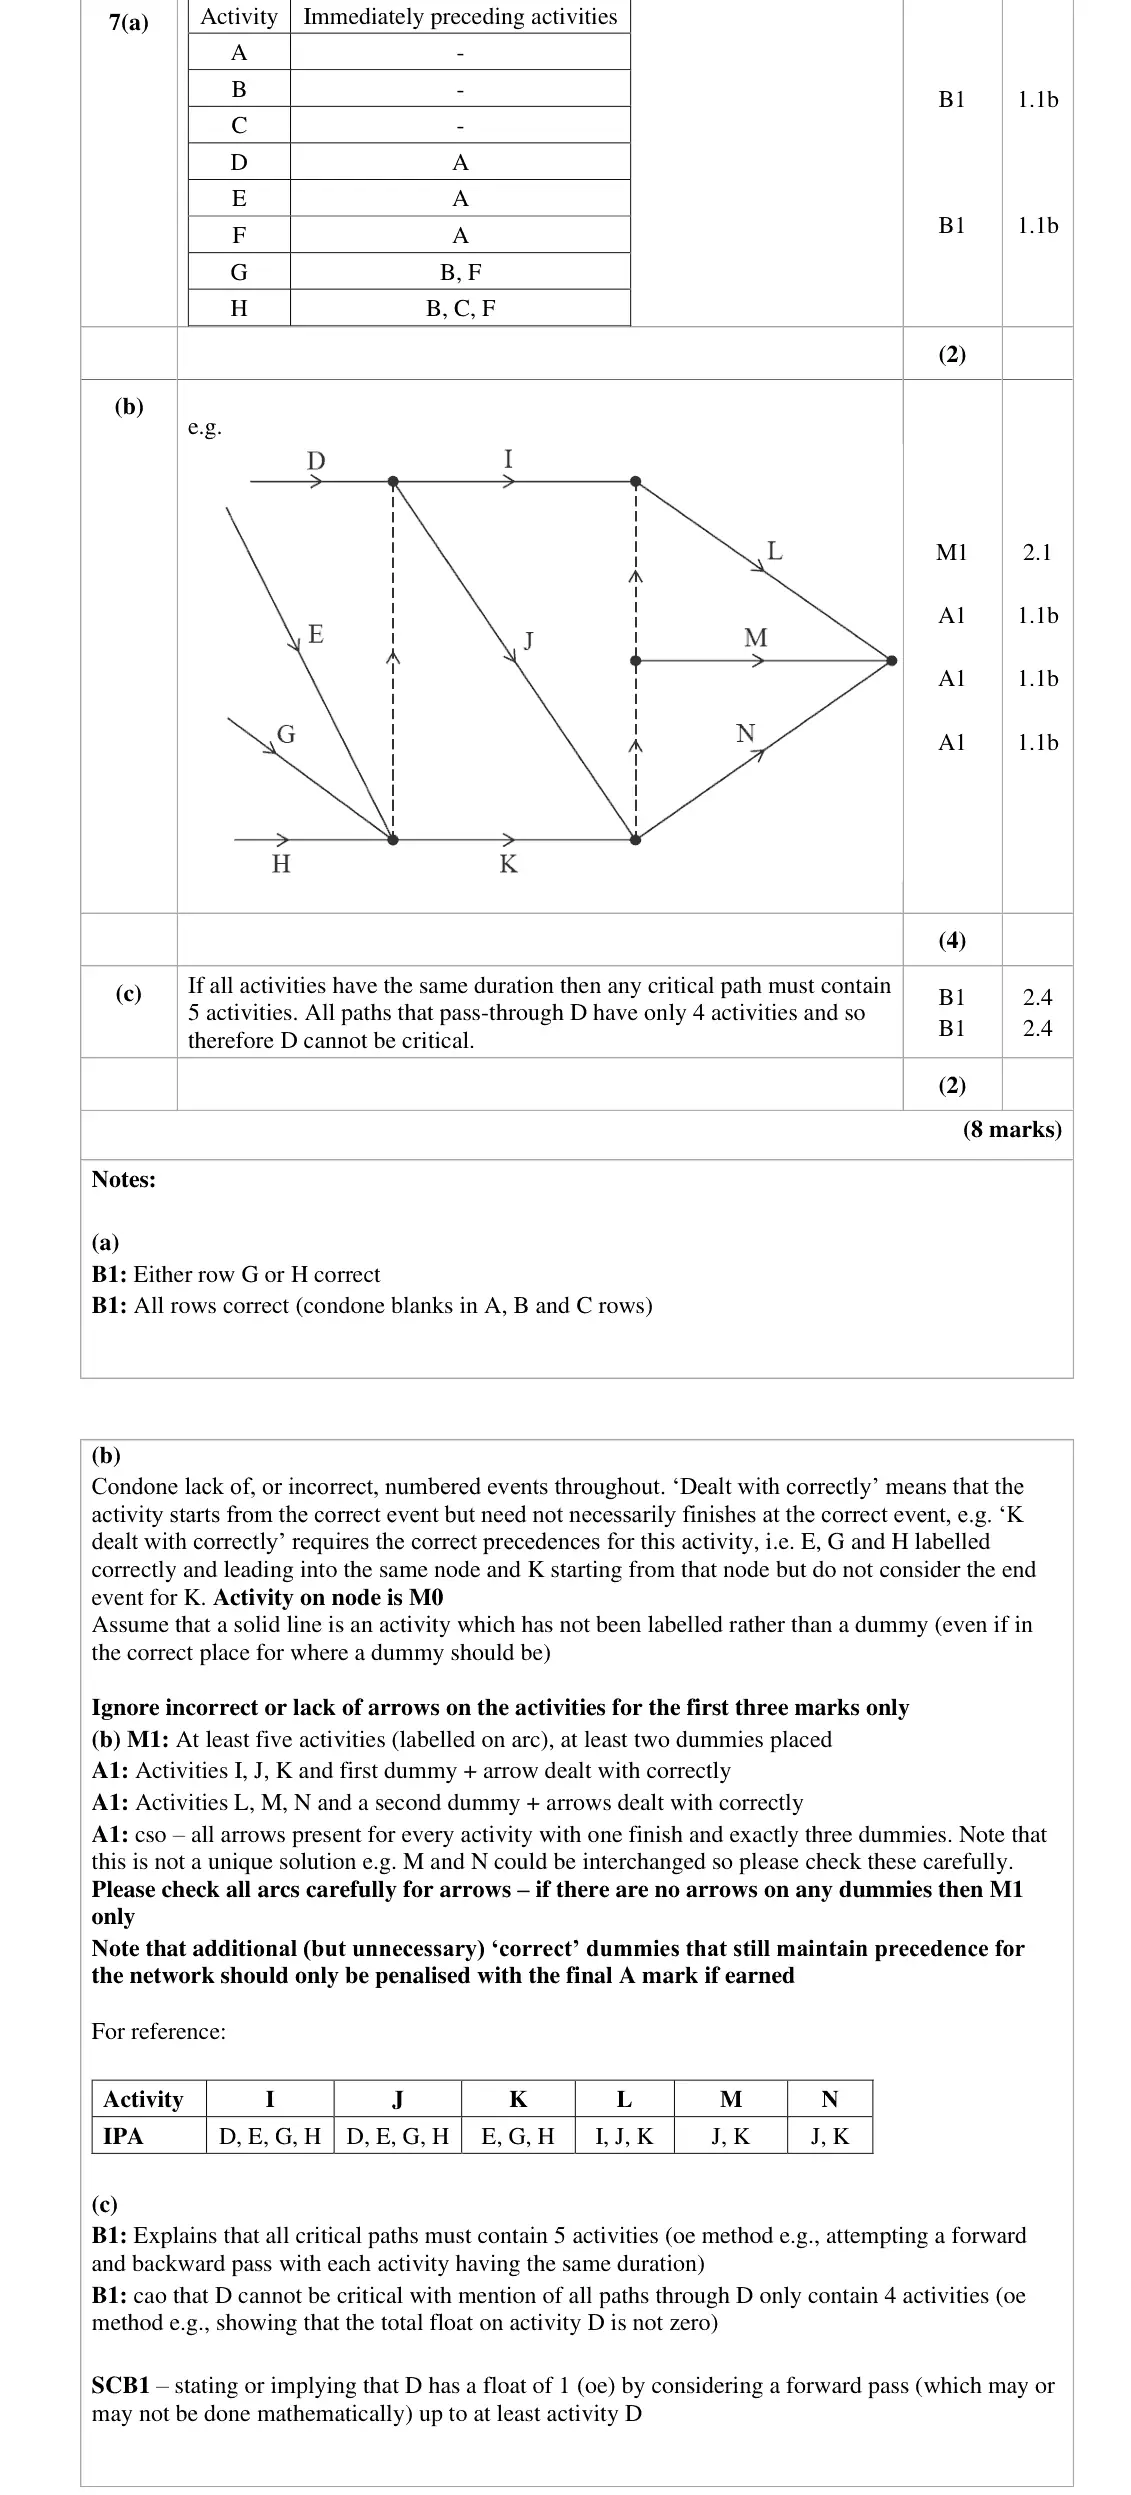
D, E, F: A
G: B, F
H: B, C, F (dummy carries F to H)
Nov 2021 · Paper 3D (Decision 1) · Q7(b)4 marks
Mark scheme (whole question; this part is marked with the orange bar)
Examiner's comment
This second question on critical path analysis was answered extremely well with most scoring
Key points from the mark scheme and examiner's report
minimum dummies (three in total)
I, J from one event after D, E, G, H
K after E, G, H
M, N after J, K
arrows on all dummies
Nov 2021 · Paper 3D (Decision 1) · Q7(c)2 marks
Mark scheme (whole question; this part is marked with the orange bar)
Examiner's comment
This second question on critical path analysis was answered extremely well with most scoring marks in the first two parts. Part (c), in which candidates had to explain why activity D could not be critical, was quite demanding with very few realising that if all activities have the same duration, then any critical path must contain 5 activities, and as all paths that pass-through D have only 4 activities D cannot be critical.
Key points from the mark scheme and examiner's report
equal durations so a critical path has the most activities (5)
every path through D has only 4, so D has float and cannot be critical
very few saw this
Oct 2020 · AS Paper 2 (Decision 1) · Q2(a)2 marks
Mark scheme (whole question; this part is marked with the orange bar)
Examiner's comment
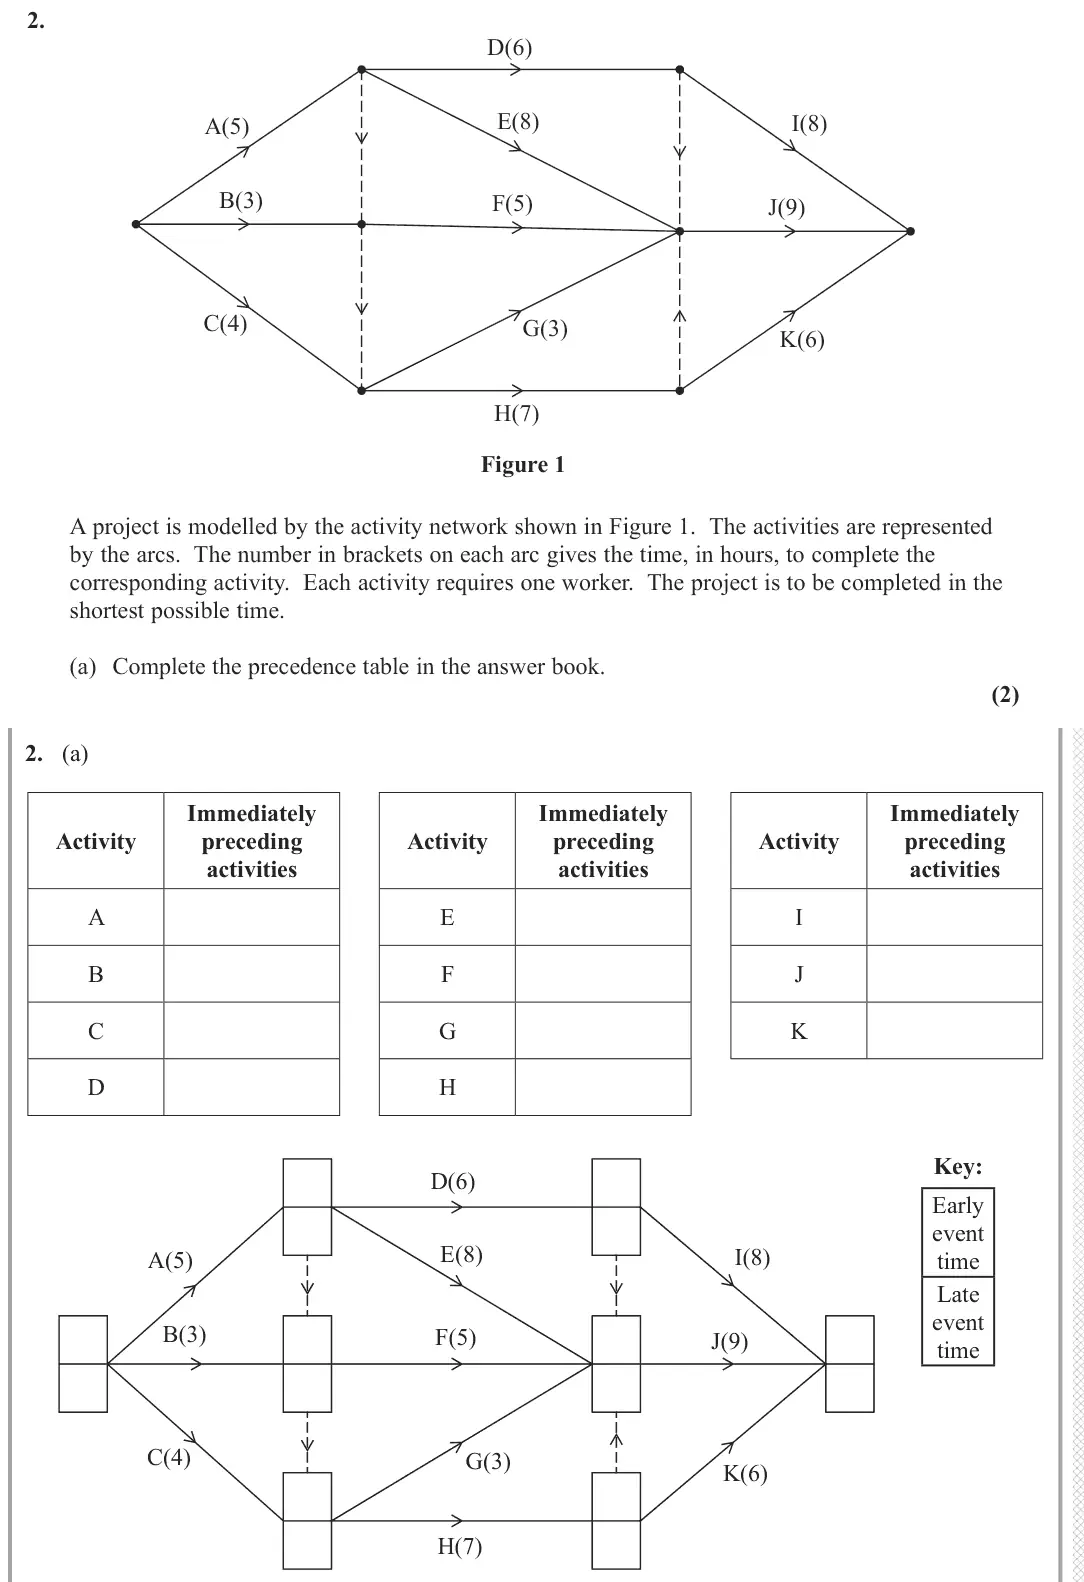
This question on critical path analysis was answered extremely well by many candidates. Part (a) required candidates to complete the precedence table for the given network and while the vast majority scored at least one mark for correctly completing five rows of the given table errors were sometimes seen on the immediately preceding activities for activities G, H and/or J.
Key points from the mark scheme and examiner's report
read dummies carefully: F needs A, B
G and H need A, B, C
J needs D, E, F, G, H
K needs H
errors usually on G, H and J
Oct 2020 · AS Paper 2 (Decision 1) · Q2(b)3 marks
Mark scheme (whole question; this part is marked with the orange bar)
Examiner's comment
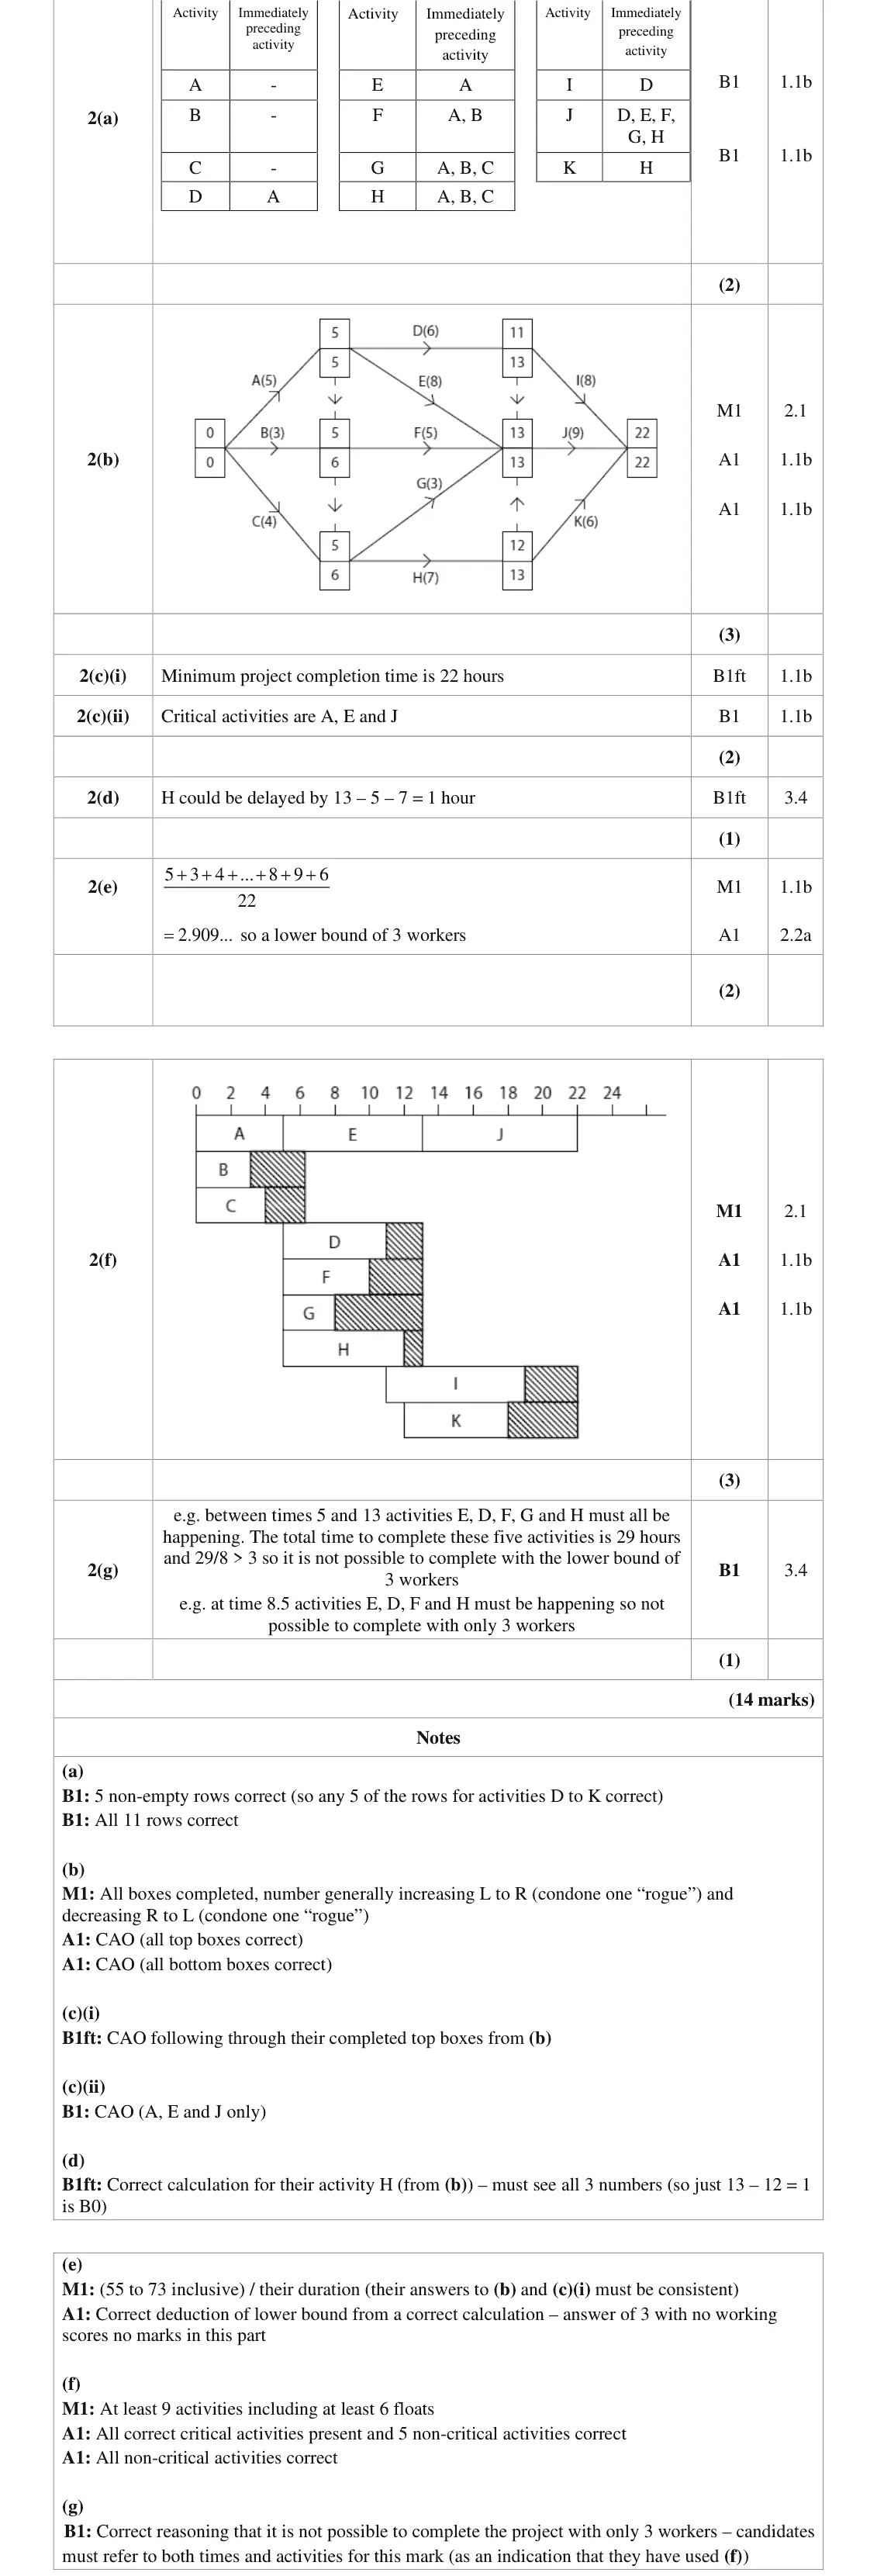
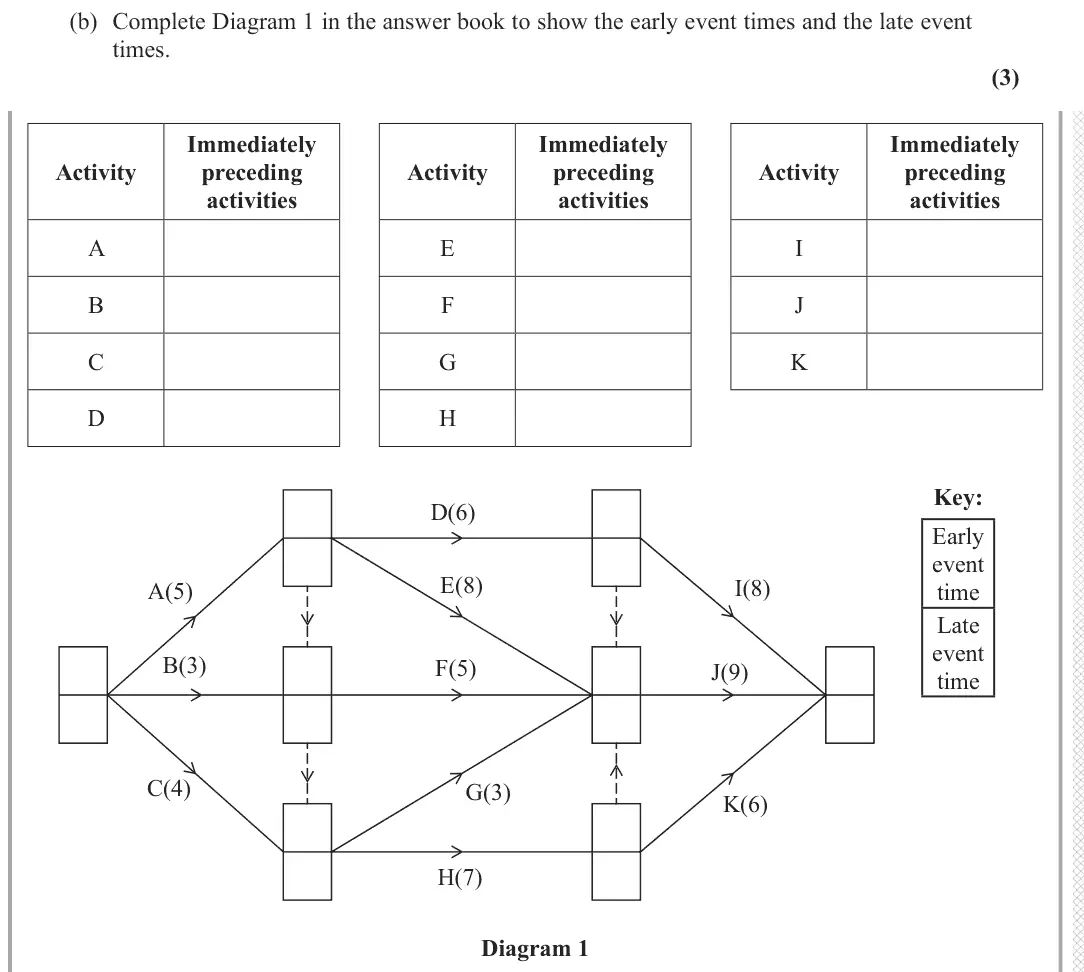
This question on critical path analysis was answered extremely well by many candidates. Part (b), in which candidates had to complete the early event times and late event times, was often done extremely well. Errors occasionally occurred in the event times at the beginning of G and/or J. However, either full marks or two marks out of three were common in this part. Nearly all candidates correctly stated the minimum project completion time and critical activities in part (c). accurately and neatly with most errors occurring following through from errors in (b). From time-to-time activities were mis-plotted – for example, sometimes at the start of I and K. Examiners noted that some responses had missing activities. The three critical activities were rarely incorrect.
Key points from the mark scheme and examiner's report
forward pass for early times, backward pass for late times
finish 22
errors at the start of G and J
Oct 2020 · AS Paper 2 (Decision 1) · Q2(c)2 marks
Mark scheme (whole question; this part is marked with the orange bar)
Examiner's comment
This question on critical path analysis was answered extremely well by many candidates. activities in part (c).
Key points from the mark scheme and examiner's report
22 hours
critical activities A, E and J
Oct 2020 · AS Paper 2 (Decision 1) · Q2(d)1 mark
Mark scheme (whole question; this part is marked with the orange bar)
Examiner's comment
This question on critical path analysis was answered extremely well by many candidates. Part (d) required candidates to calculate the maximum number of hours by which activity H could be delayed without affecting the shortest possible completion time of the project and nearly all candidates realised that this calculation was equivalent to the total float for activity H and therefore was extremely well answered.
Key points from the mark scheme and examiner's report
total float of H = 13 − 5 − 7 = 1 hour
all three numbers must be seen
Oct 2020 · AS Paper 2 (Decision 1) · Q2(e)2 marks
Mark scheme (whole question; this part is marked with the orange bar)
Examiner's comment
This question on critical path analysis was answered extremely well by many candidates. Part (e) was generally very successfully attempted. Most candidates carried out a correct calculation and rounded their value up to give the correct lower bound for the number of workers. It was rare to see ’22’ (the minimum project completion time) divided by 11 (the number of activities). Most candidates in part (f) were well-versed in how to construct a cascade chart and examiners shortest possible time using the number of workers found in part (e). The most common approach seen by examiners was to realise that at time 8.5 activities E, D, F & H must be happening, so it is not possible to complete the project with three workers. Candidates are reminded that simply stating the activities that must be happening (together) without a specific reference to a time will not be credited with full marks.
Key points from the mark scheme and examiner's report
sum of activity times 64 ÷ 22 = 2.909…, round UP to 3 workers
answer 3 with no working scores 0
Oct 2020 · AS Paper 2 (Decision 1) · Q2(f)3 marks
Mark scheme (whole question; this part is marked with the orange bar)
Examiner's comment
This question on critical path analysis was answered extremely well by many candidates. Most candidates in part (f) were well-versed in how to construct a cascade chart and examiners saw very few scheduling diagrams. Most floats were drawn in the standard way (as shown in previous mark schemes) and critical activities were almost always seen drawn along the top of the cascade chart although this was not always the case. Cascade charts were usually completed accurately and neatly with most errors occurring following through from errors in (b). From
Key points from the mark scheme and examiner's report
critical activities A, E, J along the top
non-critical activities at earliest start with floats shown
errors followed from (b)
occasional mis-plotting of I and K
Oct 2020 · AS Paper 2 (Decision 1) · Q2(g)1 mark
Mark scheme (whole question; this part is marked with the orange bar)
Examiner's comment
This question on critical path analysis was answered extremely well by many candidates. Part (g) required the candidates to explain why it was not possible to complete the project in the shortest possible time using the number of workers found in part (e). The most common
Key points from the mark scheme and examiner's report
at time 8.5 activities D, E, F and H must all be happening, so 3 workers is not enough
must refer to a specific time and the activities
Oct 2020 · Paper 3D (Decision 1) · Q2(a)2 marks
Mark scheme (whole question; this part is marked with the orange bar)
Examiner's comment
The explanations in (a) describing the necessity for dummy activities were sometimes omitted or only stated in general terms. Candidates should be advised to name all relevant activities, using equivalent wording to that in this and previous mark schemes. In (b) most candidates showed their understanding
Key points from the mark scheme and examiner's report
dummy after B: F and G depend on B only but H depends on B and C
dummy after K: two activities cannot share the same start and end events
must name the activities, not general statements
Oct 2020 · Paper 3D (Decision 1) · Q2(b)2 marks
Mark scheme (whole question; this part is marked with the orange bar)
Examiner's comment
and previous mark schemes. In (b) most candidates showed their understanding of preceding activities, scoring both marks. Fully correct early and late event times diagrams were commonly seen. The most frequent error was 5, instead of 7, as the early time at the end of C, due to the failure to take account of the dummy activity. Minimum completion time and the critical activities were usually correct following a correct diagram. The resource histogram is a recent addition to the specification, and quite a few candidates did not attempt this in (d) or
Key points from the mark scheme and examiner's report
e.g. H: B, C
I: E, F
J: G, H
K and L: D, I
table is in the answer book
Oct 2020 · Paper 3D (Decision 1) · Q2(c)6 marks
Mark scheme (whole question; this part is marked with the orange bar)
Examiner's comment
The explanations in (a) describing the necessity for dummy activities were sometimes omitted or only stated in general terms. Candidates should be advised to name all relevant activities, using equivalent wording to that in this and previous mark schemes. In (b) most candidates showed their understanding of preceding activities, scoring both marks. Fully correct early and late event times diagrams were commonly seen. The most frequent error was 5, instead of 7, as the early time at the end of C, due to the failure to take account of the dummy activity. Minimum completion time and the critical activities were usually correct following a correct diagram. The resource histogram is a recent addition to the specification, and quite a few candidates did not attempt this in (d) or made a start but quickly gave up. From those who persevered there were many perfect histograms, and only a few lost all marks due to holes or overhangs. It was apparent that candidates had difficulty interpreting their histogram for (e). A number of candidates managed partial answers involving reduction from five workers to four by delaying D, G or H to time 10 or beyond, but it was very rare to see a complete correct answer.
Key points from the mark scheme and examiner's report
forward and backward passes
early time at the end of C is 7, not 5 (dummy)
minimum completion time 21 hours
critical activities A, E, I, L
Oct 2020 · Paper 3D (Decision 1) · Q2(d)3 marks
Mark scheme (whole question; this part is marked with the orange bar)
Examiner's comment
to the specification, and quite a few candidates did not attempt this in (d) or made a start but quickly gave up. From those who persevered there were many perfect histograms, and only a few lost all marks due to holes or overhangs. It was apparent that candidates had difficulty interpreting their histogram for (e).
Key points from the mark scheme and examiner's report
each activity at its earliest start time, no holes or overhangs, up to time 21
5 workers between times 7 and 10
often not attempted
Oct 2020 · Paper 3D (Decision 1) · Q2(e)2 marks
Mark scheme (whole question; this part is marked with the orange bar)
Examiner's comment
was apparent that candidates had difficulty interpreting their histogram for (e). A number of candidates managed partial answers involving reduction from five workers to four by delaying D, G or H to time 10 or beyond, but it was very rare to see a complete correct answer.
Key points from the mark scheme and examiner's report
yes: delay a non-critical activity (e.g. H to start at 10, then J to 15) using its float
delaying F fails
complete answers were very rare
June 2019 · AS Paper 2 (Decision 1) · Q3(a)5 marks
Mark scheme (whole question; this part is marked with the orange bar)
Examiner's comment
Candidates were on more familiar territory here and most candidates were able to earn a good number of marks in part (a). Most candidates were completing ‘activity on arc’ networks, although examiners noted several ‘activity on node’ networks - probably more than was the case with the legacy specification. Furthermore, examiners noted that several networks had more than one source node, no finish node and networks with fewer than two dummy activities. Usually candidates were able to pick up the first two marks and errors usually arose either with the first two precedence dummies or with the omission of activity H or activity K. Whilst most candidates now seem to be aware of the importance of arrows on dummies, there are still some candidates who make the costly mistake of not having arrows on their dummies. This makes it impossible to determine the preceding activities for H, I, J and K and ultimately lost three marks. Usually, candidates were able to place the uniqueness dummy for activities I and J although this was omitted on several occasions. Some lost the final accuracy mark for lack of arrows on activities (excluding dummies): Some candidates placed arrows only on dummies whereas others made slips and missed out one or two arrows along the away. Some candidates peppered their networks with extra dummies, often at the end of B or H or K. These candidates seem reluctant to extend their activities in order to meet the required event and instead place a dummy to ‘fill the gap’. Of course, while not strictly incorrect it is inefficient. Whilst most responses were clearly set out and often resembled the version given in the printed mark scheme or a correct equivalent, there were several candidates who had multiple arcs crossing over each- other. This is condoned but can make it difficult to see exactly where activities start and finish. It may be advisable for candidates to sketch out a rough diagram in order to see the best placement of activities before completing their final diagram. A word of caution however, sometimes when candidates do exactly this, they fail to copy their initial diagram accurately and miss off arrows and sometimes, more disastrously, activities.
Key points from the mark scheme and examiner's report
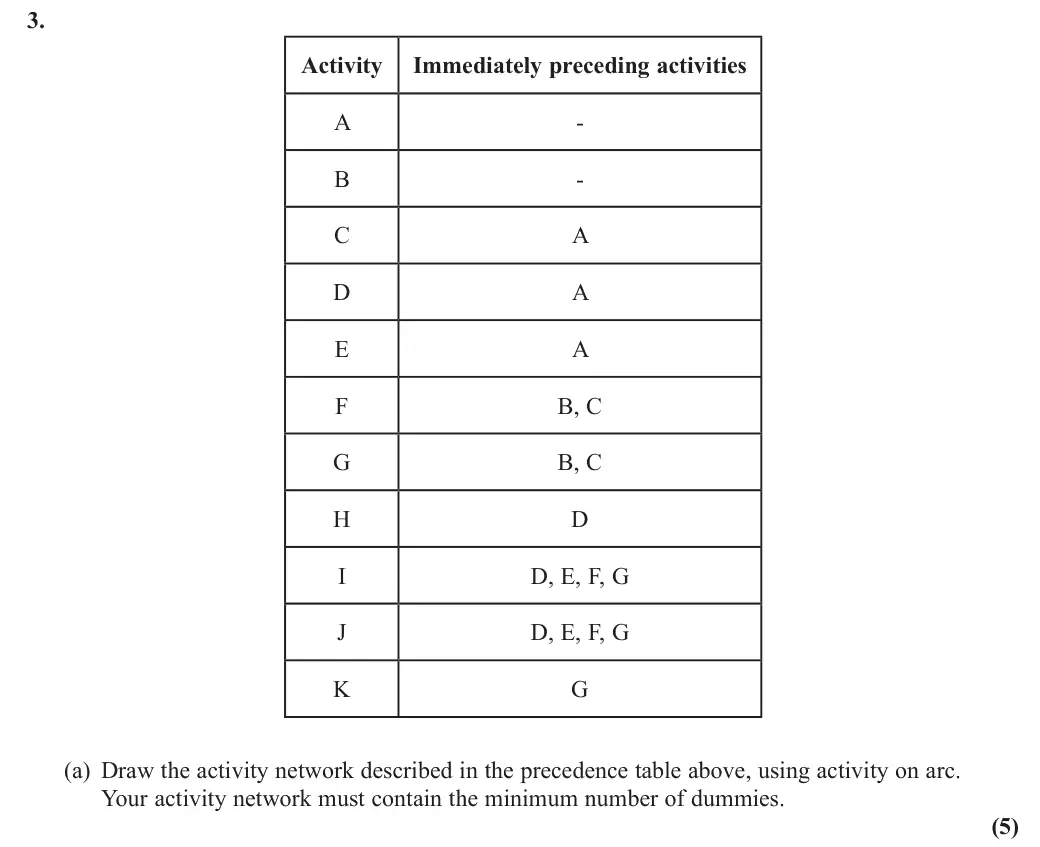
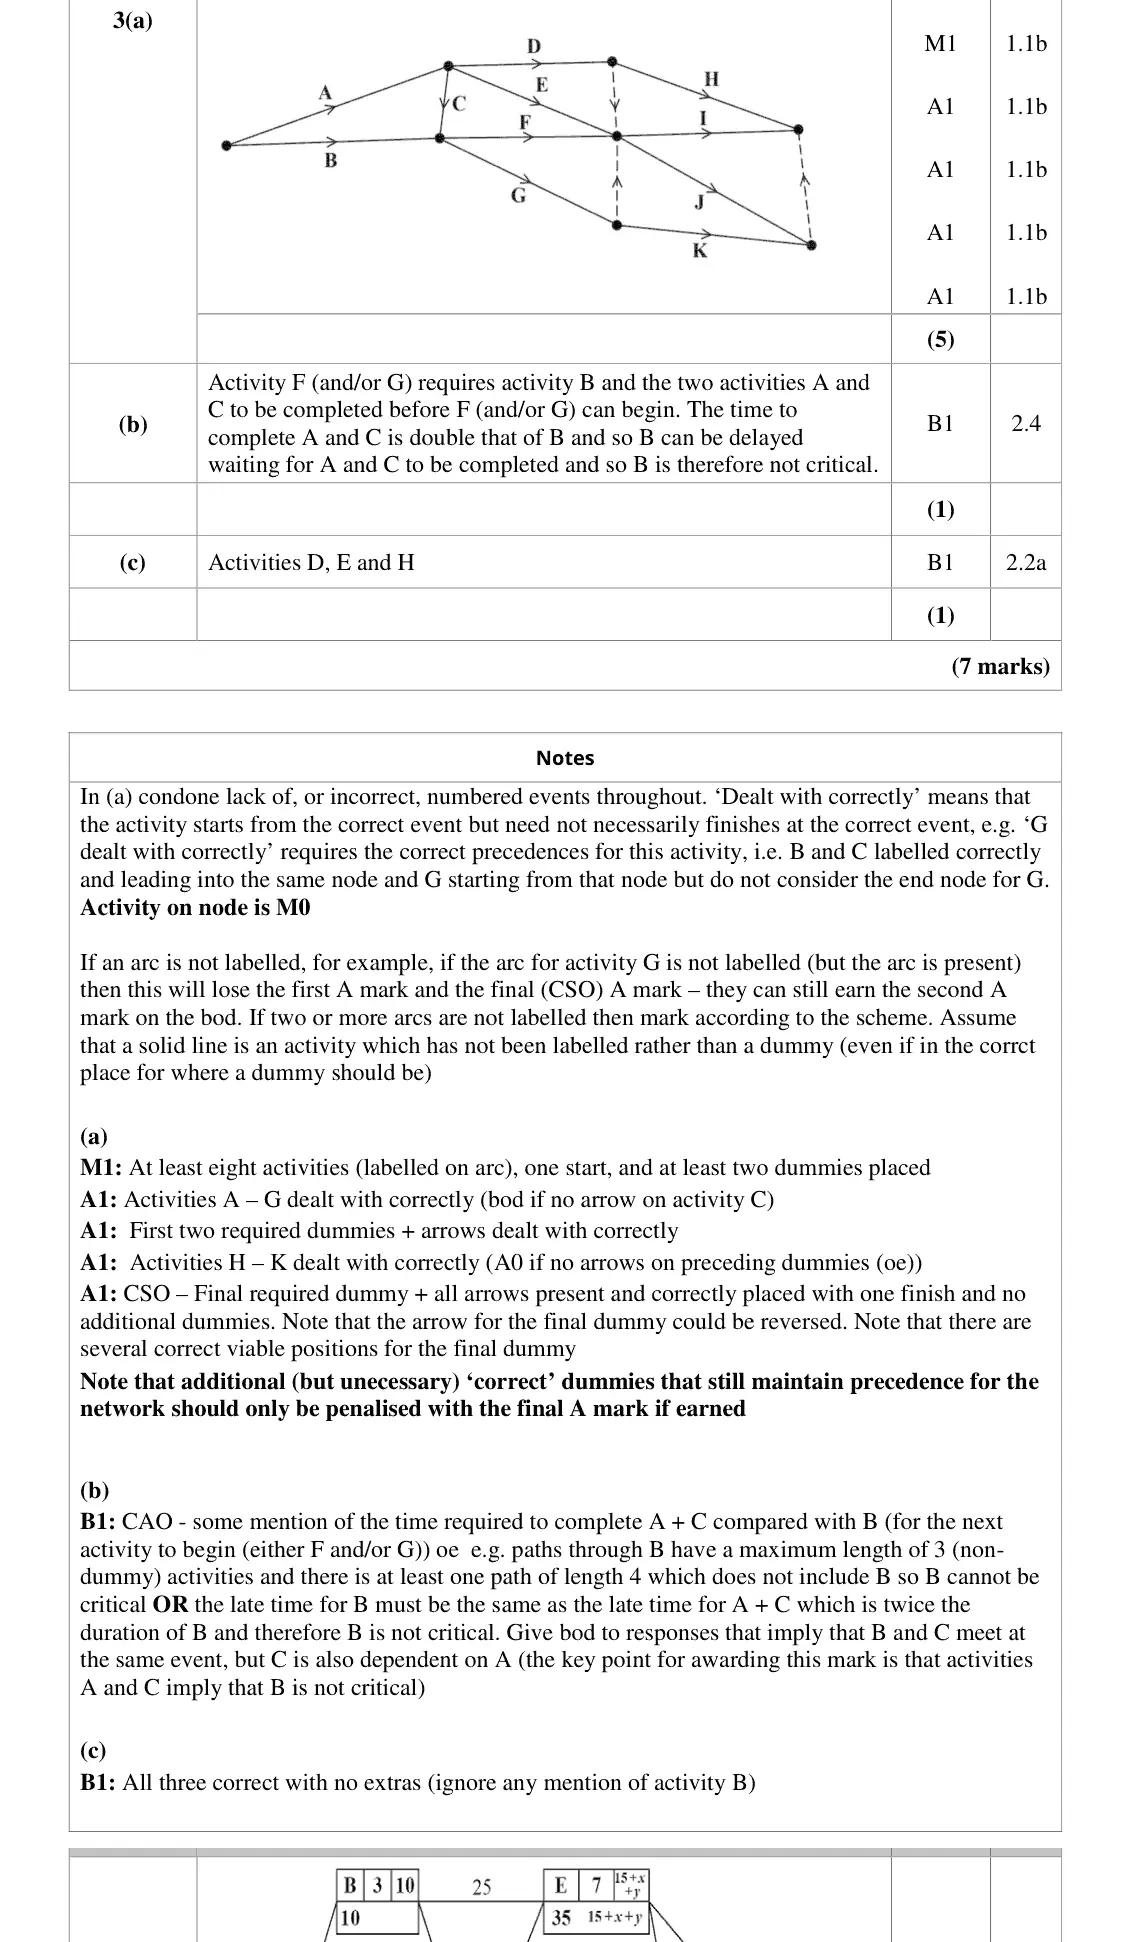
activity on arc with the minimum number of dummies (three: two precedence dummies plus a uniqueness dummy for I and J)
activity on node scores M0
dummies without arrows lost three marks
H or K often omitted
June 2019 · AS Paper 2 (Decision 1) · Q3(b)1 mark
Mark scheme (whole question; this part is marked with the orange bar)
Examiner's comment
Candidates were on more familiar territory here and most candidates were able to earn a good number In part (b), many candidates could clearly identify the reasons why activity B is not critical. However, articulating these reasons sometimes proved to be more of a challenge. Common responses which were insufficient for the mark included statements such as: “because F and G depend on B and C” which did not draw attention to the fact that C also depends on A; or “B is not on the shortest path” which did not give enough detail. Similarly, “B does not have a zero float” which was also too vague and was perhaps purely a learned definition for a critical activity. The most successful responses highlighted the dependency of C on A and the dependency of other activities (F and G) on both C and B. Other successful responses involved discussion of event times and the duration of A + the duration of C compared to the duration of activity B.
Key points from the mark scheme and examiner's report
F and G need B and C, but C follows A, so A + C takes twice as long as B and B can be delayed
"B is not on the longest path" or "B has non-zero float" too vague
June 2019 · AS Paper 2 (Decision 1) · Q3(c)1 mark
Mark scheme (whole question; this part is marked with the orange bar)
Examiner's comment
Candidates were on more familiar territory here and most candidates were able to earn a good number Part (c) was challenging for many candidates and it was relatively rare to see a correct answer here perhaps highlighting a lack of understanding of critical paths. Usually, candidates listed several activities. Some candidates were almost correct but incorrectly believed that K was not critical – perhaps failing to spot the path through K from A. Overall this question was successful in providing both access for less able candidates and differentiation amongst the more able ones.
Key points from the mark scheme and examiner's report
D, E and H
K often wrongly thought non-critical (path A, C, G, K)
June 2019 · Paper 3D (Decision 1) · Q4(a)2 marks
Mark scheme (whole question; this part is marked with the orange bar)
Examiner's comment
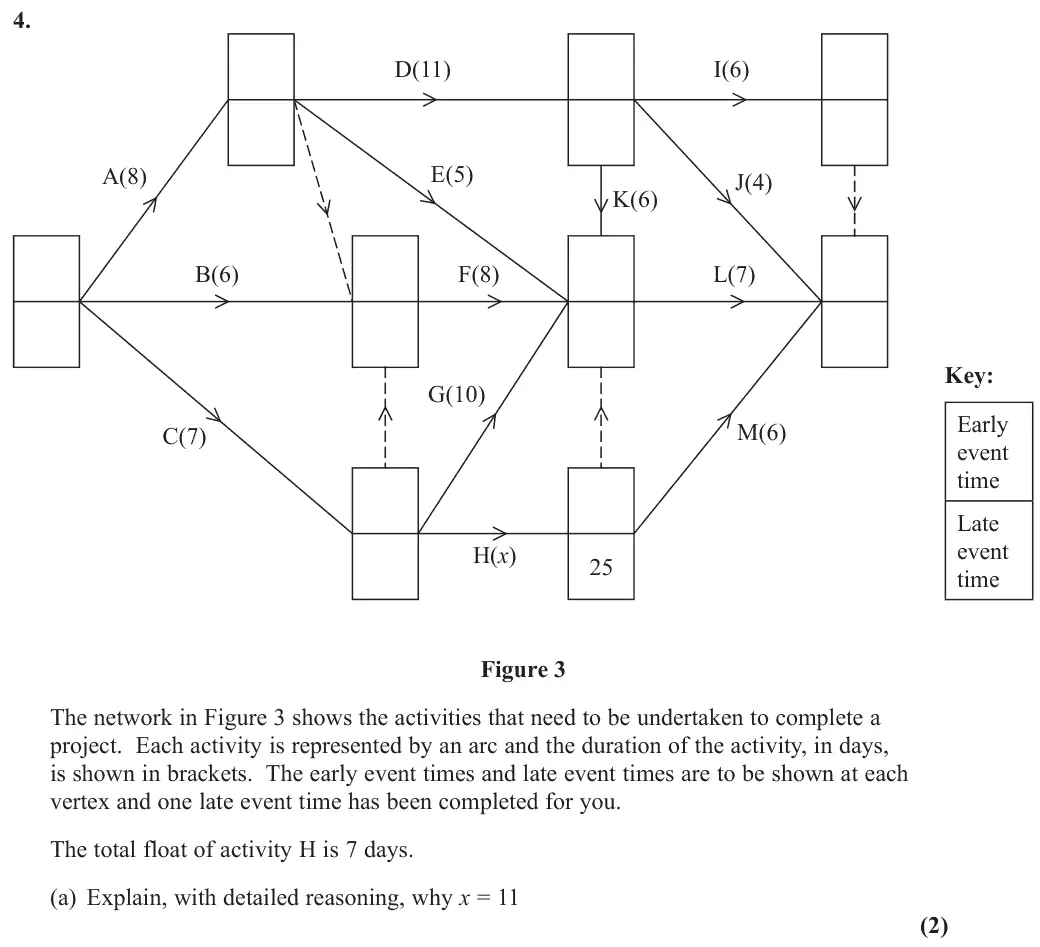
In part (a) very few candidates explained, with detailed reasoning, why x = 11. For the first mark candidates had to give a correct reason why the total float on activity H was given by 25 – 7 – x (e.g. mention that the early event time at the end of activity C is 7) and for the second mark (which was dependent on the first) a reason why the expression 25 – 7 – x leads to the given answer. Far too many candidates gave no reasoning at all and simply wrote down the equation 25 – 7 – x = 7 and then stated that x = 11.
Key points from the mark scheme and examiner's report
early event time at the end of C is 7, so float on H = 25 − 7 − x = 7 gives x = 11
must explain where 25 − 7 − x comes from
many just wrote the equation
June 2019 · Paper 3D (Decision 1) · Q4(b)3 marks
Mark scheme (whole question; this part is marked with the orange bar)
Examiner's comment
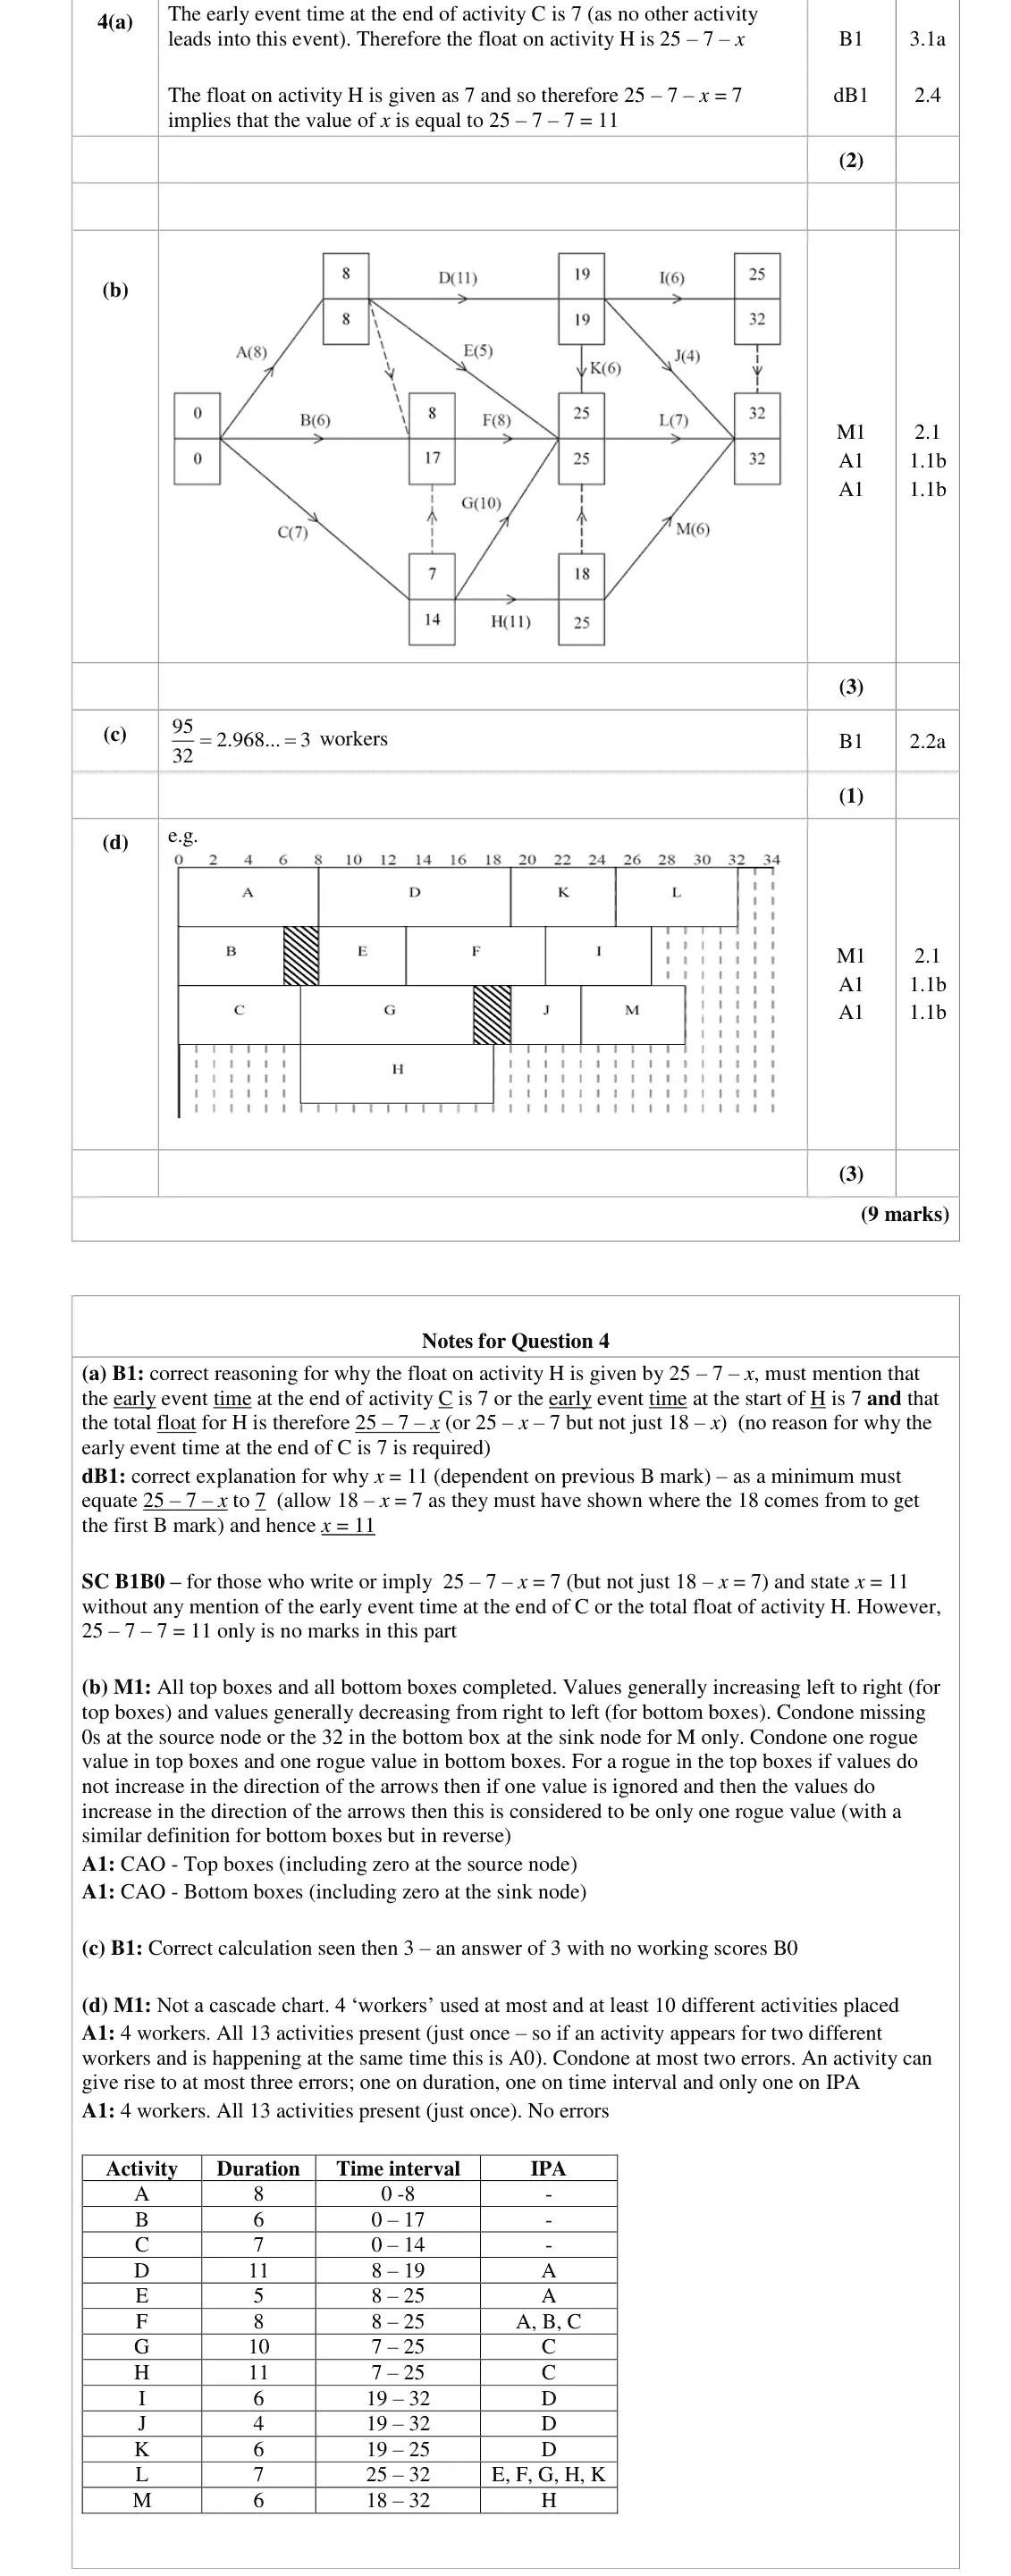
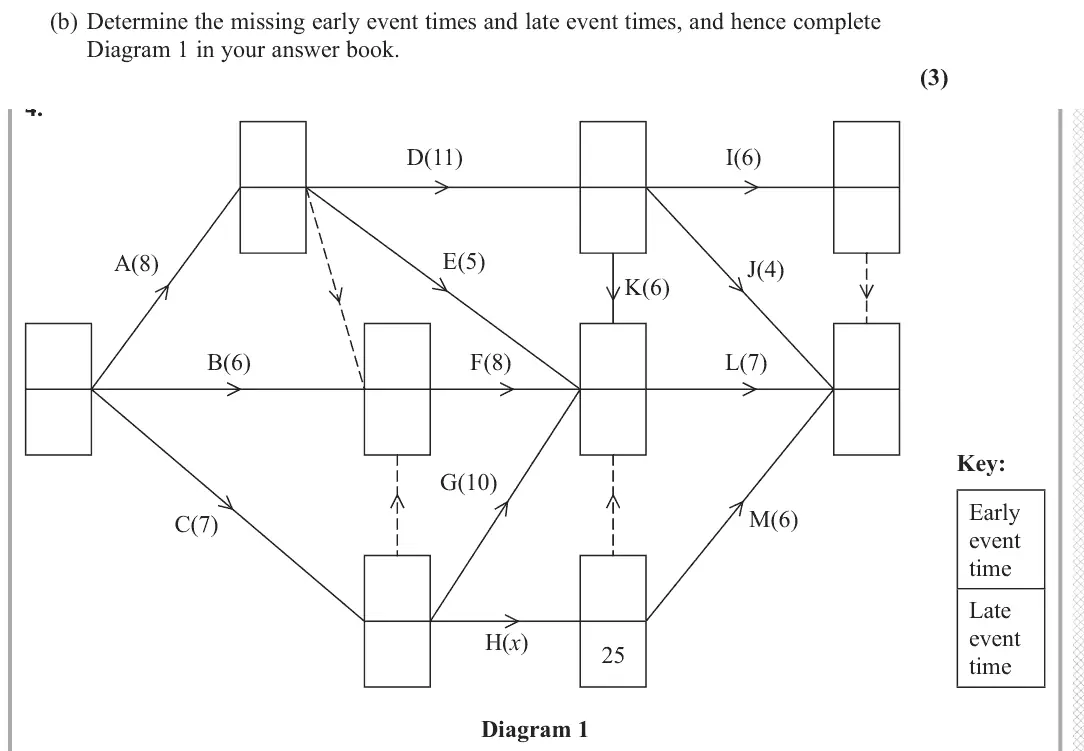
Part (b) was answered extremely well with many candidates correctly complete the diagram with the early event times and late event times. When errors did occur, they mostly occurred at the ends of activities B, F and/or H.
Key points from the mark scheme and examiner's report
forward pass for early, backward pass for late event times
project length 32
errors mostly at the ends of B, F and H
June 2019 · Paper 3D (Decision 1) · Q4(c)1 mark
Mark scheme (whole question; this part is marked with the orange bar)
Examiner's comment
Examiners noted that part (c) was generally answered correctly with nearly all showing a correct calculation.
Key points from the mark scheme and examiner's report
total activity time over critical time: 95/32 = 2.97 so 3 workers
answer without the calculation scores 0
June 2019 · Paper 3D (Decision 1) · Q4(d)3 marks
Mark scheme (whole question; this part is marked with the orange bar)
Examiner's comment
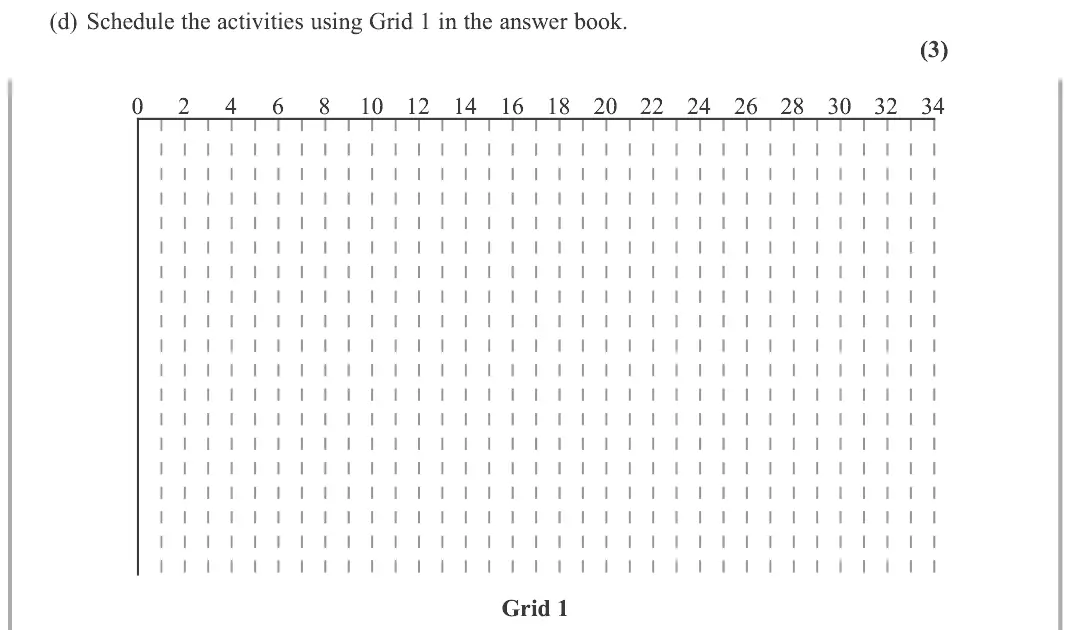
Most candidates did attempt to produce a schedule in part (d). However, a significant proportion of candidates tried to construct a schedule with only three workers (possibly due to their answer for part (c)), therefore scoring only one mark and completely disregarding the significance of the Immediately Preceding Activities (IPA). Of those candidates who did have four workers in their schedule, a pleasing number were correct, though errors were sometimes seen in either the duration, time interval or IPA for one or more activities. It was pleasing to note that cascade charts were rarely seen.
Key points from the mark scheme and examiner's report
4 workers needed despite the bound of 3
check every activity's duration, time interval and immediate predecessors
not a cascade chart
many forced 3 workers and ignored precedences
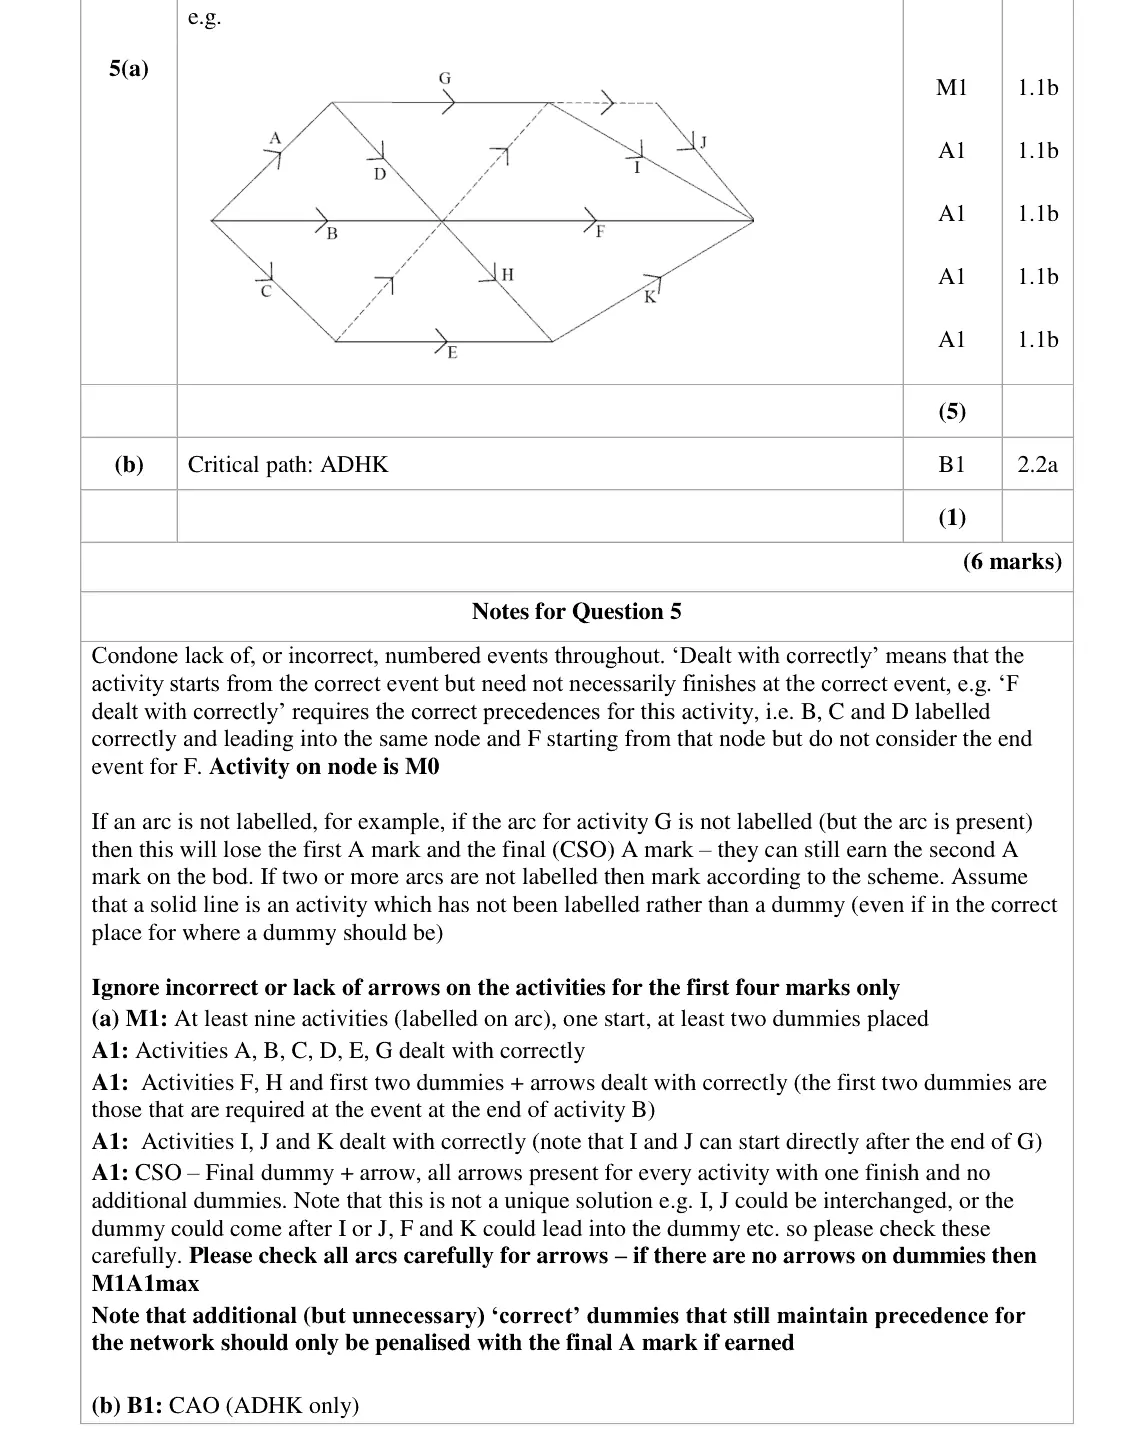
June 2019 · Paper 3D (Decision 1) · Q5(a)5 marks
Mark scheme (whole question; this part is marked with the orange bar)
Examiner's comment
Candidates generally showed a good understanding of the process of constructing an activity network from a precedence table in part (a), using arcs drawn with arrows and labelled for activities. Some scripts lacked a sink node at the end and a small number did not have a single source node. Some of the diagrams and labels were challenging to read, especially when they were very small and/or drawn with lines that crossed over. Some candidates were unsure about the placement of their dummies, putting them in ‘anywhere’ so that precedence was guaranteed. A very small number of candidates put activity on node, and some failed to check that they had all activities present, with activity K being the activity that was missing most often. Usually candidates were able to pick up the first two marks and errors usually arose either with the first two precedence dummies. Whilst most candidates now seem to be aware of the importance of arrows on dummies, there are still some candidates who make the costly mistake of not having arrows on their dummies. This makes it impossible to determine the preceding activities for F, H, I, J and K and ultimately lost three marks.
Key points from the mark scheme and examiner's report
activity on arc with the minimum number of dummies (two at the end of B, one more for I and J/K)
single start and end
arrows on all arcs including dummies
K often missing
June 2019 · Paper 3D (Decision 1) · Q5(b)1 mark
Mark scheme (whole question; this part is marked with the orange bar)
Examiner's comment
Candidates generally showed a good understanding of the process of constructing an activity network In part (b) only the most able candidates realised that if all the activities have the same duration then ADHK was the critical path.
Key points from the mark scheme and examiner's report
equal durations so the critical path is the one with most activities: ADHK
few candidates spotted this
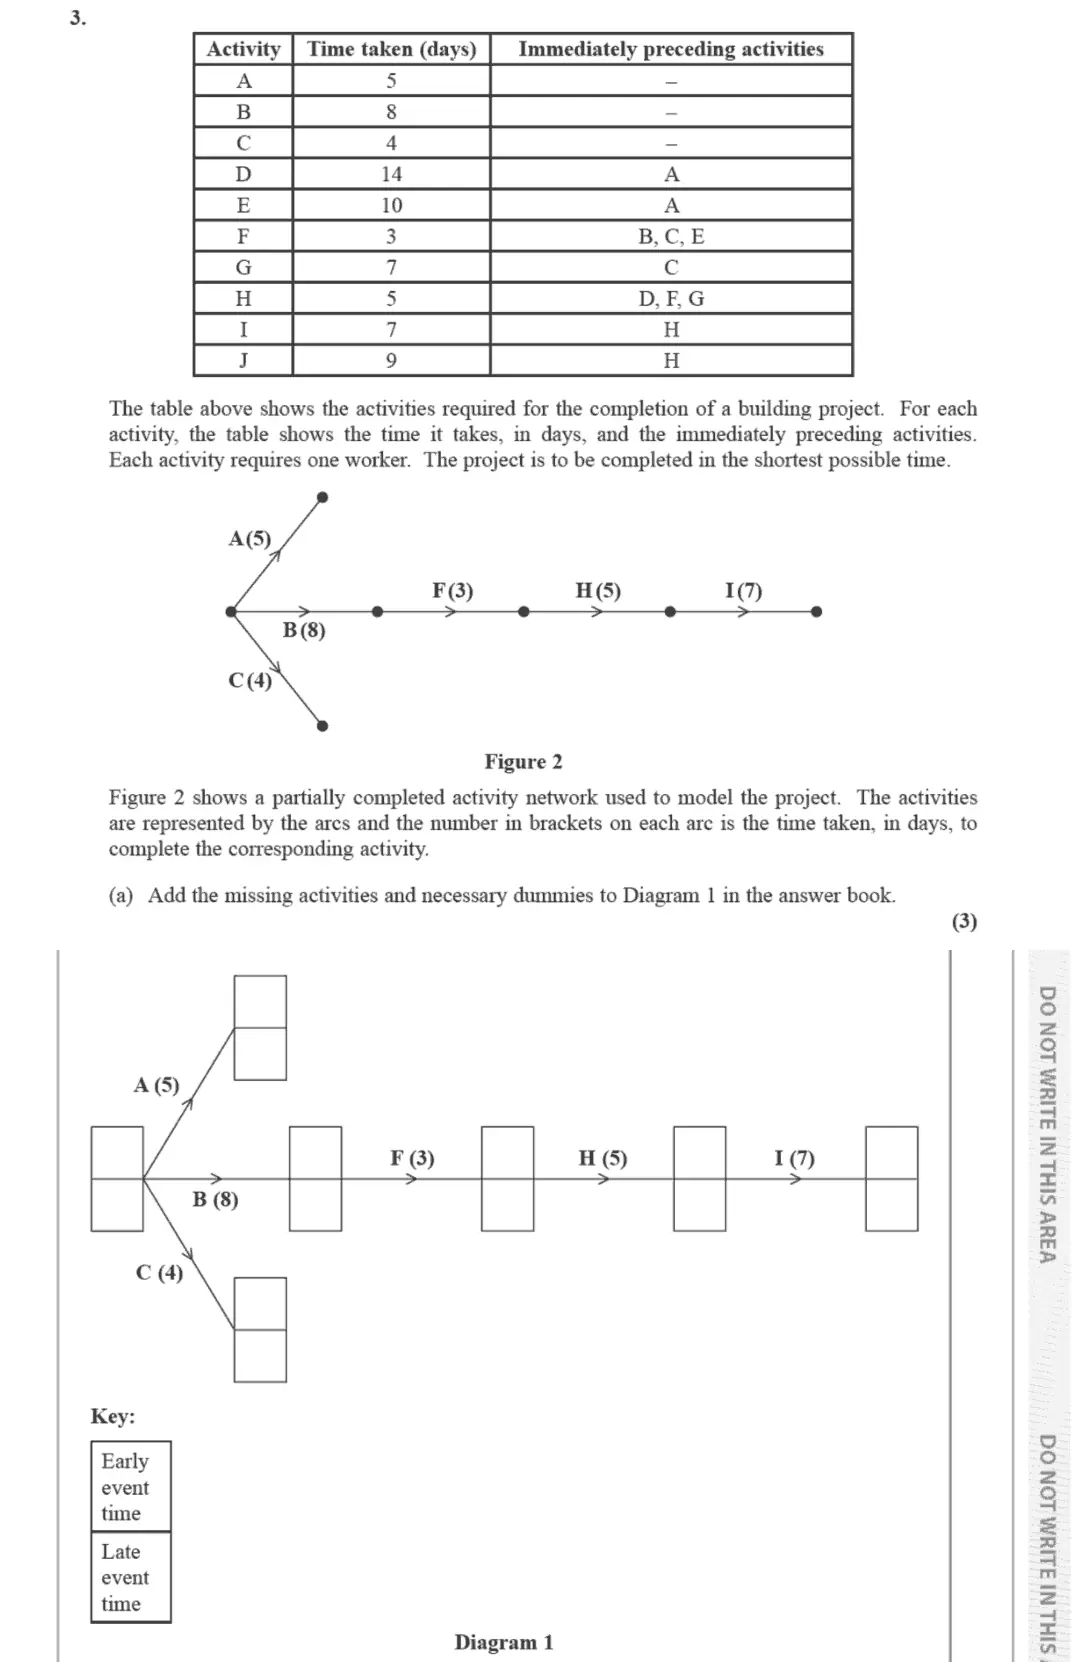
June 2018 · AS Paper 2 (Decision 1) · Q3(a)3 marks
Mark scheme (whole question; this part is marked with the orange bar)
Examiner's comment
This question was, at times, very well answered but the construction of an activity network with an efficient number of dummies proved to be something of a challenge for many students. Some of the issues noted by examiners were: There were often several extra dummies added after activities. Students often drew straight lines for activities and whenever a change in direction was required to connect the activity to the correct node, an event was added followed by a dummy. In addition, dummies were added joining the node at the end of activities A or C to the end point of the network. Missing dummy between the nodes at the end of activities I and J so that the network had two end points. Or occasionally, I and J violated the uniqueness rule by both passing between these two nodes. Both dummies and activities had missing arrows for a significant number of students. Sometimes no arrows whatsoever were added but more often there were one or two missing arrows. Activities G and D were drawn incorrectly feeding into the node at the start of activity J. Activity J missing. A missing event node at the end of activity J. Diagrams were often unclear and some students redrew their diagrams multiple times. For those students who were able to draw a workable activity network it was quite straightforward to write
Key points from the mark scheme and examiner's report
add D, E, G, J with exactly two dummies (end of C to start of F, since F needs B, C, E but G needs only C
end of J to the finish)
common errors: extra dummies, two end points, missing arrows on activities and dummies
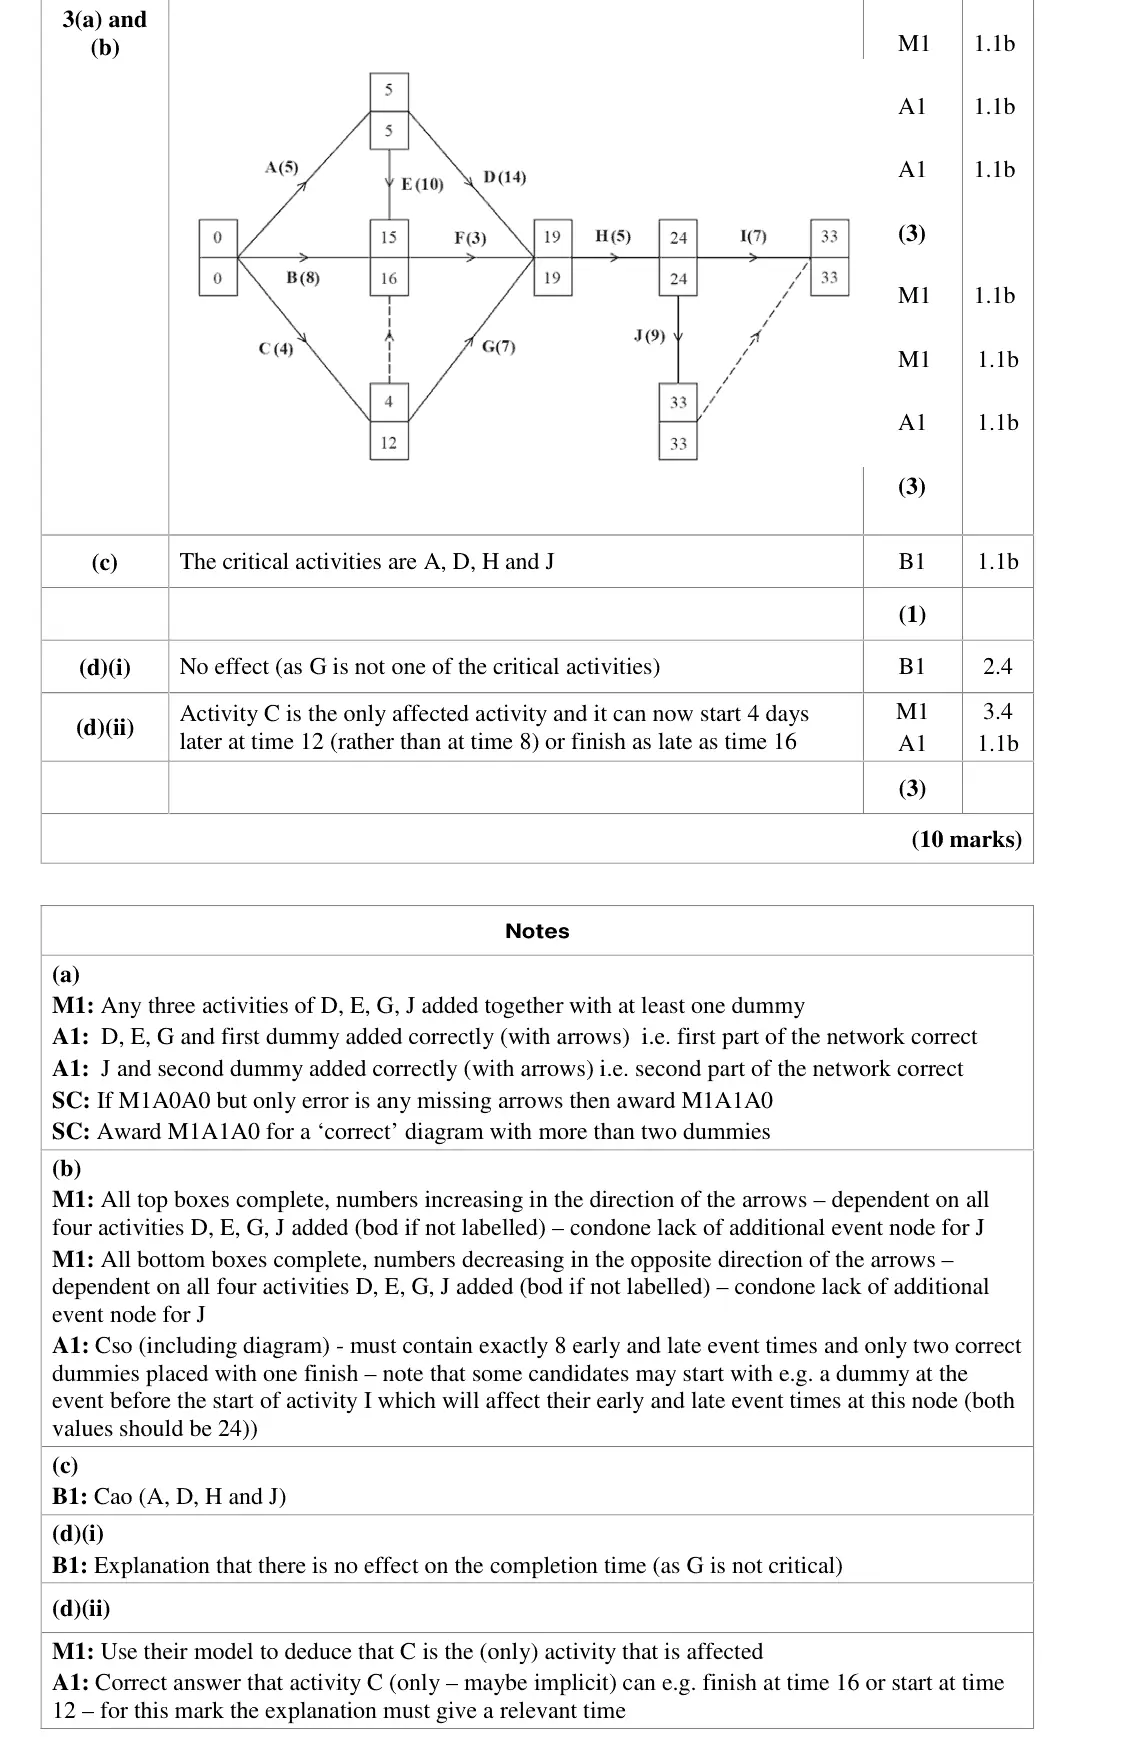
June 2018 · AS Paper 2 (Decision 1) · Q3(b)3 marks
Mark scheme (whole question; this part is marked with the orange bar)
Examiner's comment
This question was, at times, very well answered but the construction of an activity network with an efficient number of dummies proved to be something of a challenge for many students. Some of the issues noted by examiners were: There were often several extra dummies added after activities. Students often drew straight lines for activities and whenever a change in direction was required to connect the activity to the correct node, an event was added followed by a dummy. In addition, dummies were added joining the node at the end of activities A or C to the end point of the network. Missing dummy between the nodes at the end of activities I and J so that the network had two end points. Or occasionally, I and J violated the uniqueness rule by both passing between these two nodes. Both dummies and activities had missing arrows for a significant number of students. Sometimes no arrows whatsoever were added but more often there were one or two missing arrows. Activities G and D were drawn incorrectly feeding into the node at the start of activity J. Activity J missing. A missing event node at the end of activity J. Diagrams were often unclear and some students redrew their diagrams multiple times. For those students who were able to draw a workable activity network it was quite straightforward to write
Key points from the mark scheme and examiner's report
early times increase along arrows, late times decrease backwards
finish 33 days
must contain exactly 8 event nodes
June 2018 · AS Paper 2 (Decision 1) · Q3(c)1 mark
Mark scheme (whole question; this part is marked with the orange bar)
Examiner's comment
down the critical activities in (c). Although activity I appeared regularly in place of J or as an addition to A, D, H and J.
Key points from the mark scheme and examiner's report
A, D, H and J
I often given in place of or as well as J
June 2018 · AS Paper 2 (Decision 1) · Q3(d)3 marks
Mark scheme (whole question; this part is marked with the orange bar)
Examiner's comment
In (d)(i), most students were able to recognise that the removal of activity G would have no effect on the shortest completion time. Although some did state that it would be reduced. Similarly, for (d)(ii), the question asked for a comment on the timings of the remaining activities – so to gain both marks here, students needed to mention both that activity C was the only affected activity, and also that the timing of this activity would now be adjusted to finish at time 16 (or start as late as time 12).
Key points from the mark scheme and examiner's report
(i) no effect as G is not critical
(ii) only C is affected: it can now start at 12 or finish as late as 16
many omitted a relevant time
Find an Edexcel Further Maths tutor
Stuck on this? Book a trial lesson with our Further Maths tutor.