D2.3.2 Use of the labelling procedure to augment a flow to determine the…
Section
D2.3 Flows in networks
Level
AS & A level
Statement
Use of the labelling procedure to augment a flow to determine the maximum flow in a network.
Guidance
The arrow in the same direction as the arc will be used to identify the amount by which the flow along that arc can be increased. The arrow in the opposite direction will be used to identify the amount by which the flow in the arc could be reduced.
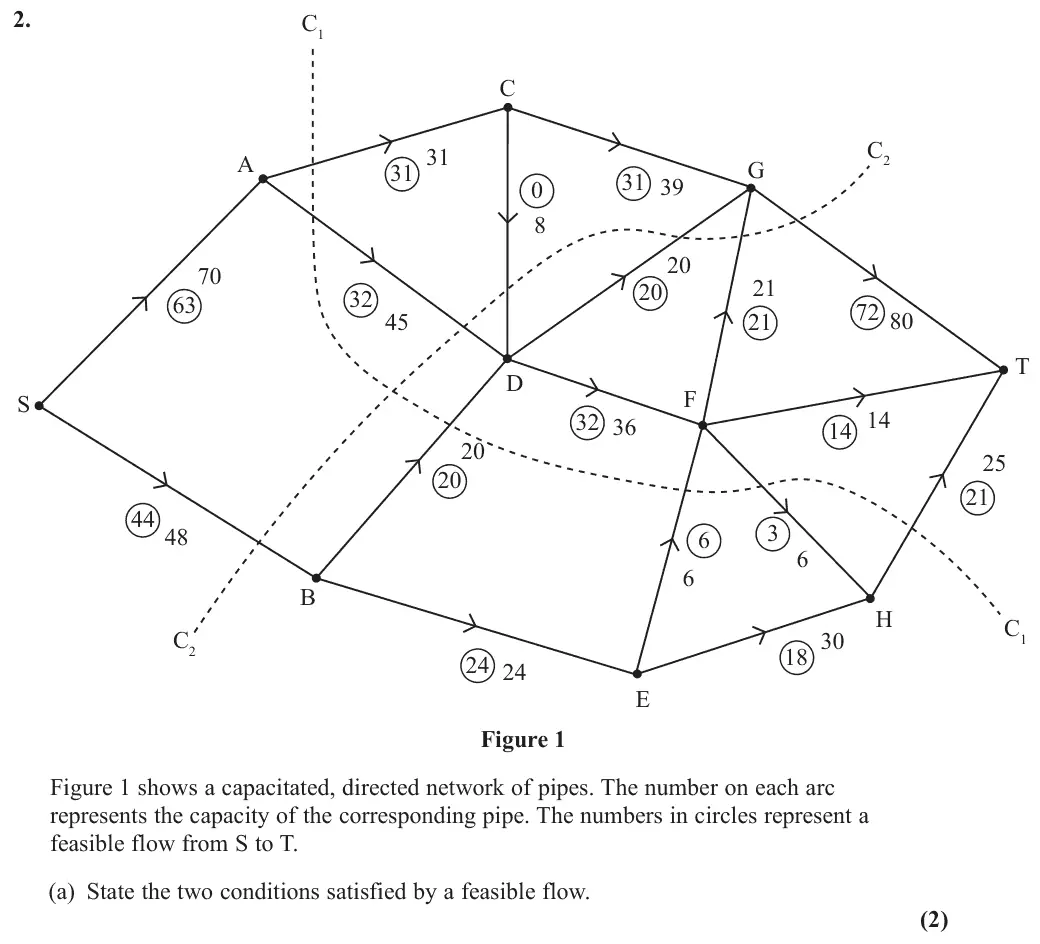
June 2025 · AS Paper 2 (Decision 2) · Q2(a)2 marks
Mark scheme (whole question; this part is marked with the orange bar)
Examiner's comment
Many learners struggled to answer part (a) in sufficient detail, for example just stating “cannot exceed capacity” without relating this to the flow in an arc. Most learners listed the saturated arcs correctly and many also calculated the value of the cuts correctly, although there were some errors seen. While many learners did give the correct flow augmenting route, there was a significant minority who failed to find this. As a consequence, there were a number of errors seen with the final flow diagram and some learners did not attempt this. Those learners who did attempt the final flow diagram generally went on to attempt to prove that the flow was maximal by finding a cut through saturated arcs. However, there were a number of errors seen, either with an incorrect cut, not stating the value of the cut or flow or failing to write the conclusion that, due to the Maximum Flow – Minimum Cut theorem the flow is maximal.
Key points from the mark scheme and examiner's report
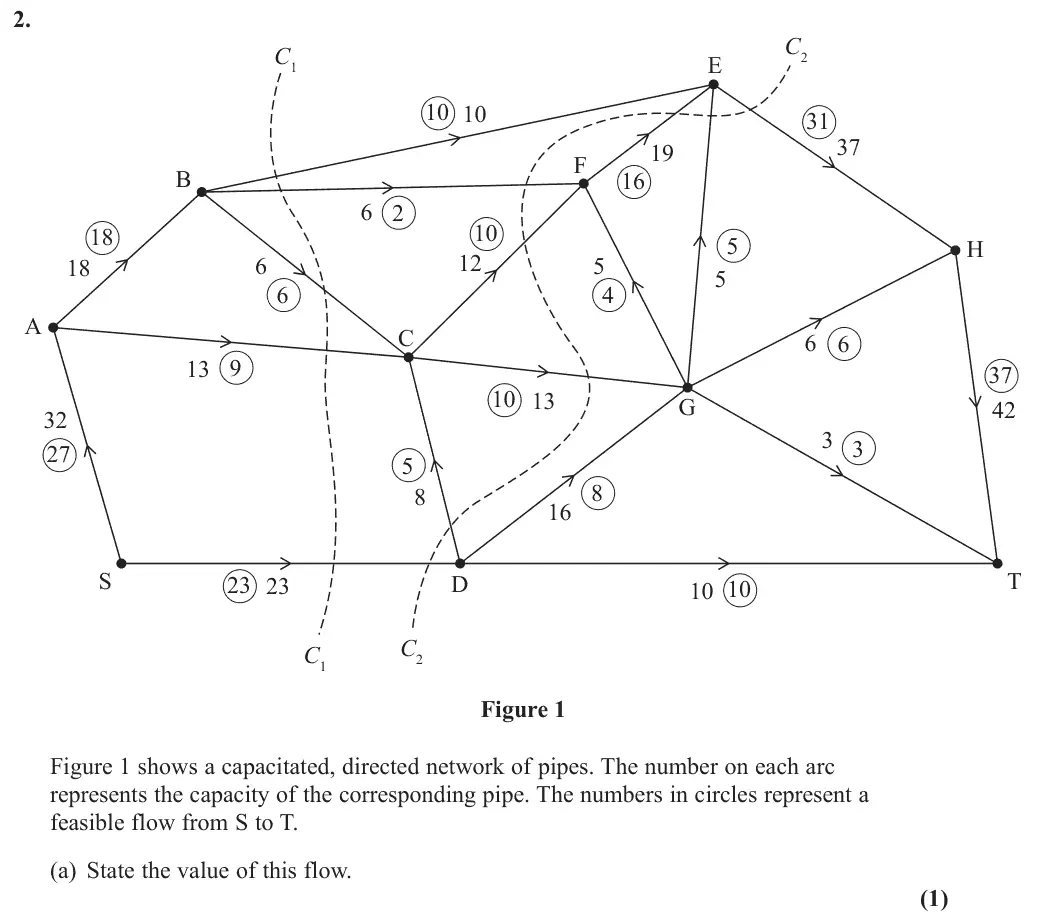
flow in each arc cannot exceed its capacity
flow in = flow out at every vertex except S and T
'cannot exceed capacity' without referring to arcs was common
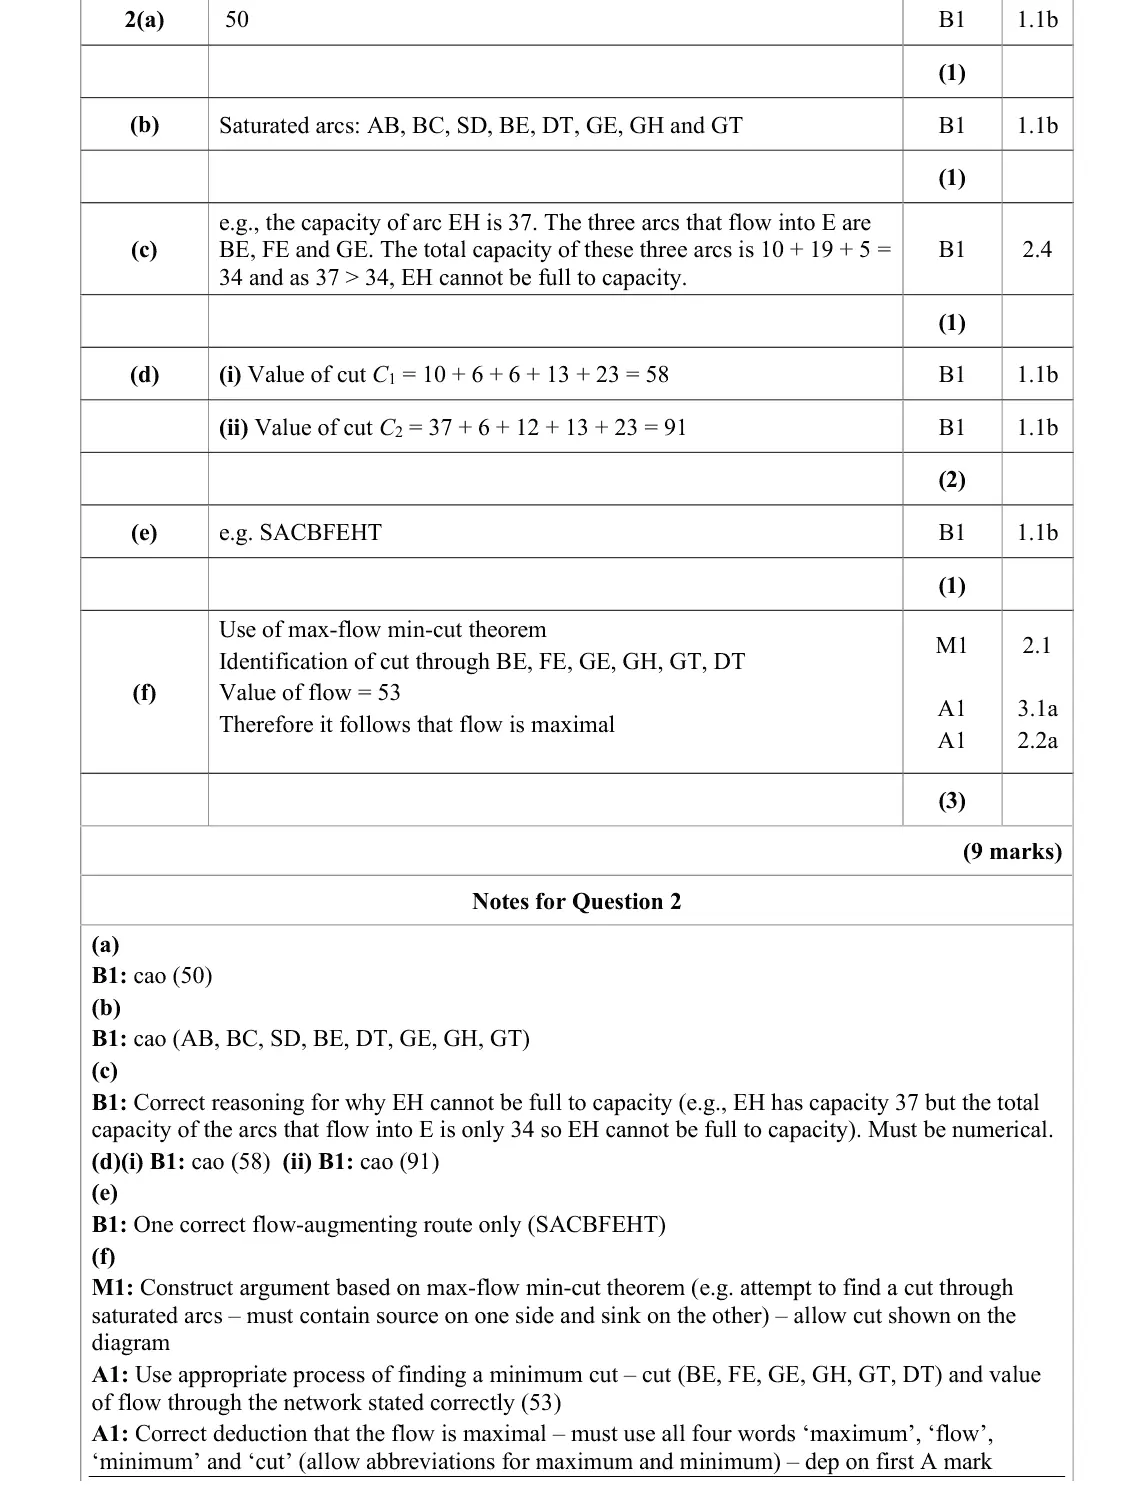
June 2025 · AS Paper 2 (Decision 2) · Q2(b)1 mark
Mark scheme (whole question; this part is marked with the orange bar)
Examiner's comment
Many learners struggled to answer part (a) in sufficient detail, for example just stating “cannot exceed capacity” without relating this to the flow in an arc. Most learners listed the saturated arcs correctly and many also calculated the value of the cuts correctly, although there were some errors seen. While many learners did give the correct flow augmenting route, there was a significant minority who failed to find this. As a consequence, there were a number of errors seen with the final flow diagram and some learners did not attempt this. Those learners who did attempt the final flow diagram generally went on to attempt to prove that the flow was maximal by finding a cut through saturated arcs. However, there were a number of errors seen, either with an incorrect cut, not stating the value of the cut or flow or failing to write the conclusion that, due to the Maximum Flow – Minimum Cut theorem the flow is maximal.
Key points from the mark scheme and examiner's report
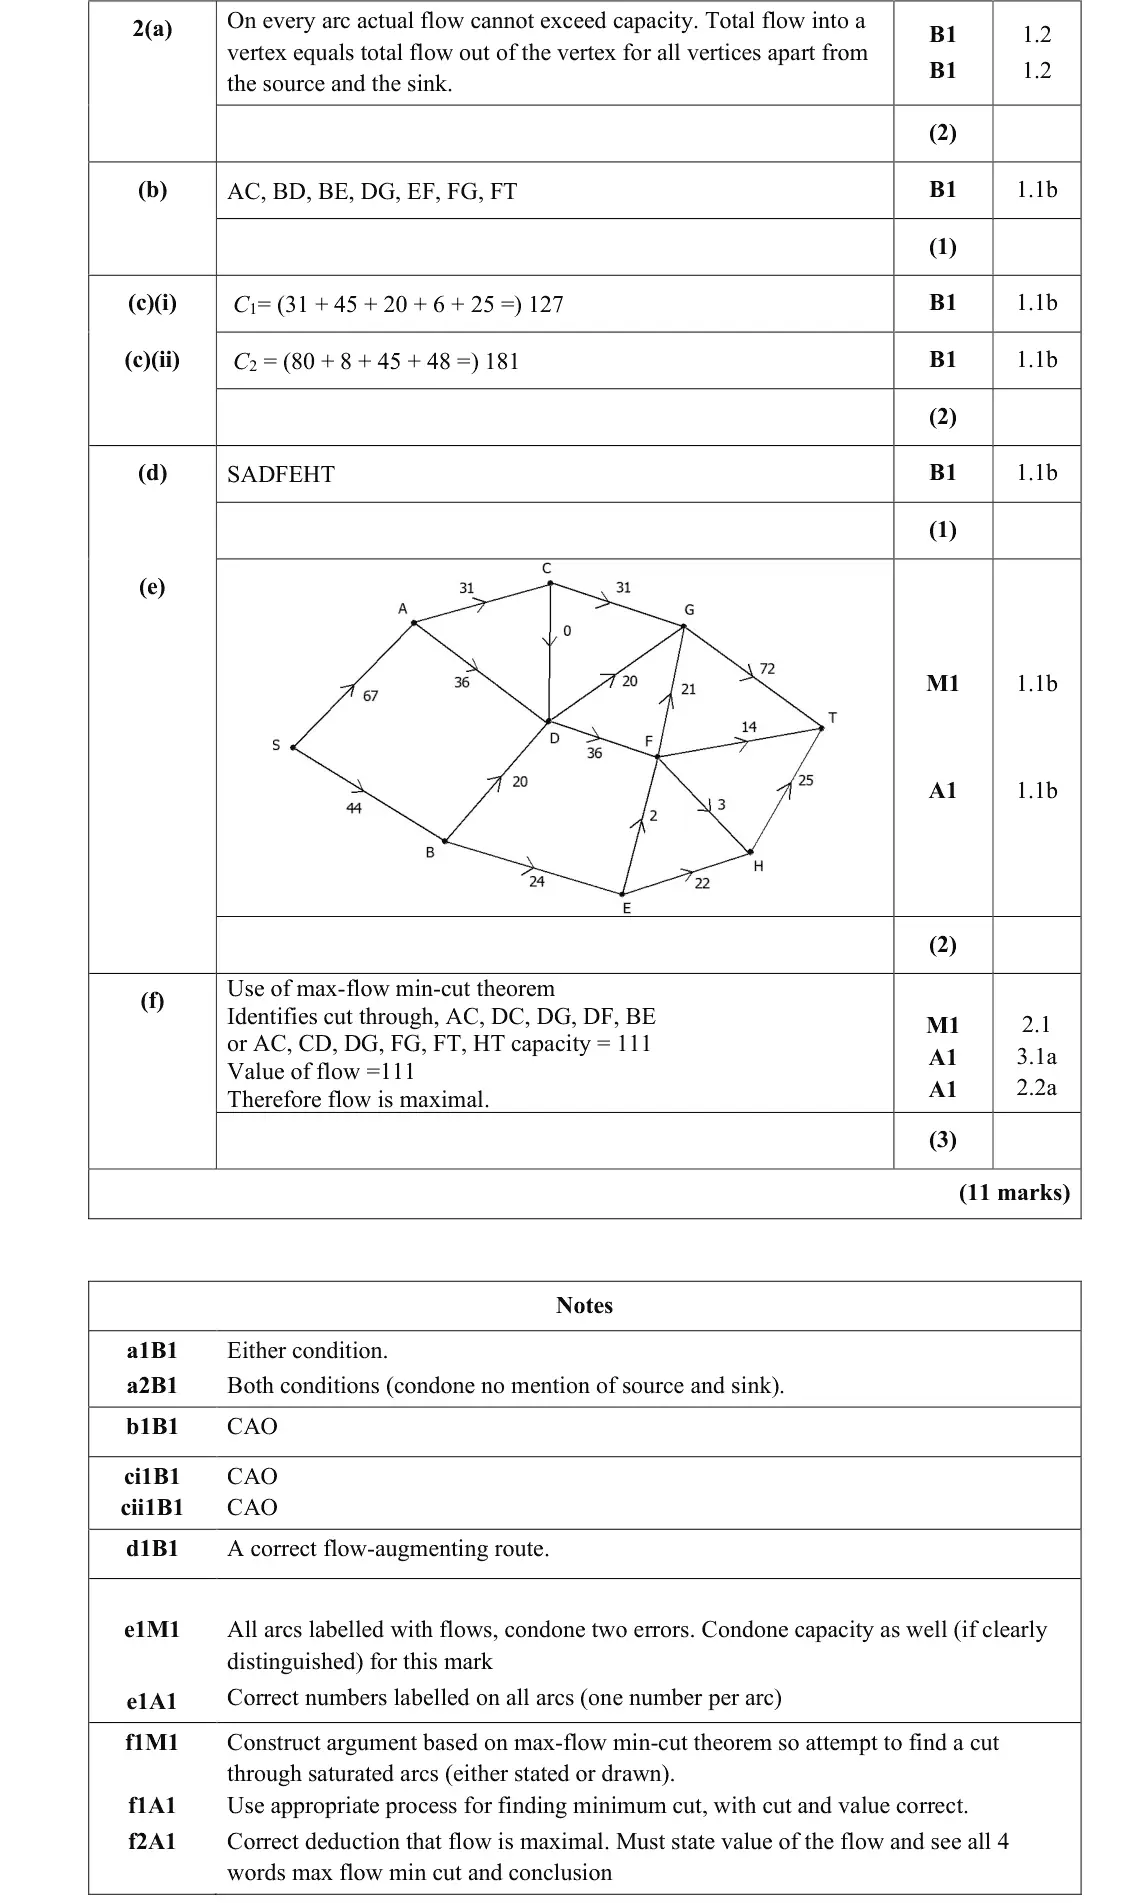
AC, BD, BE, DG, EF, FG, FT
June 2025 · AS Paper 2 (Decision 2) · Q2(d)1 mark
Mark scheme (whole question; this part is marked with the orange bar)
Examiner's comment
Many learners struggled to answer part (a) in sufficient detail, for example just stating “cannot exceed capacity” without relating this to the flow in an arc. Most learners listed the saturated arcs correctly and many also calculated the value of the cuts correctly, although there were some errors seen. While many learners did give the correct flow augmenting route, there was a significant minority who failed to find this. As a consequence, there were a number of errors seen with the final flow diagram and some learners did not attempt this. Those learners who did attempt the final flow diagram generally went on to attempt to prove that the flow was maximal by finding a cut through saturated arcs. However, there were a number of errors seen, either with an incorrect cut, not stating the value of the cut or flow or failing to write the conclusion that, due to the Maximum Flow – Minimum Cut theorem the flow is maximal.
Key points from the mark scheme and examiner's report
SADFEHT, using the backflow on EF
a significant minority could not find it
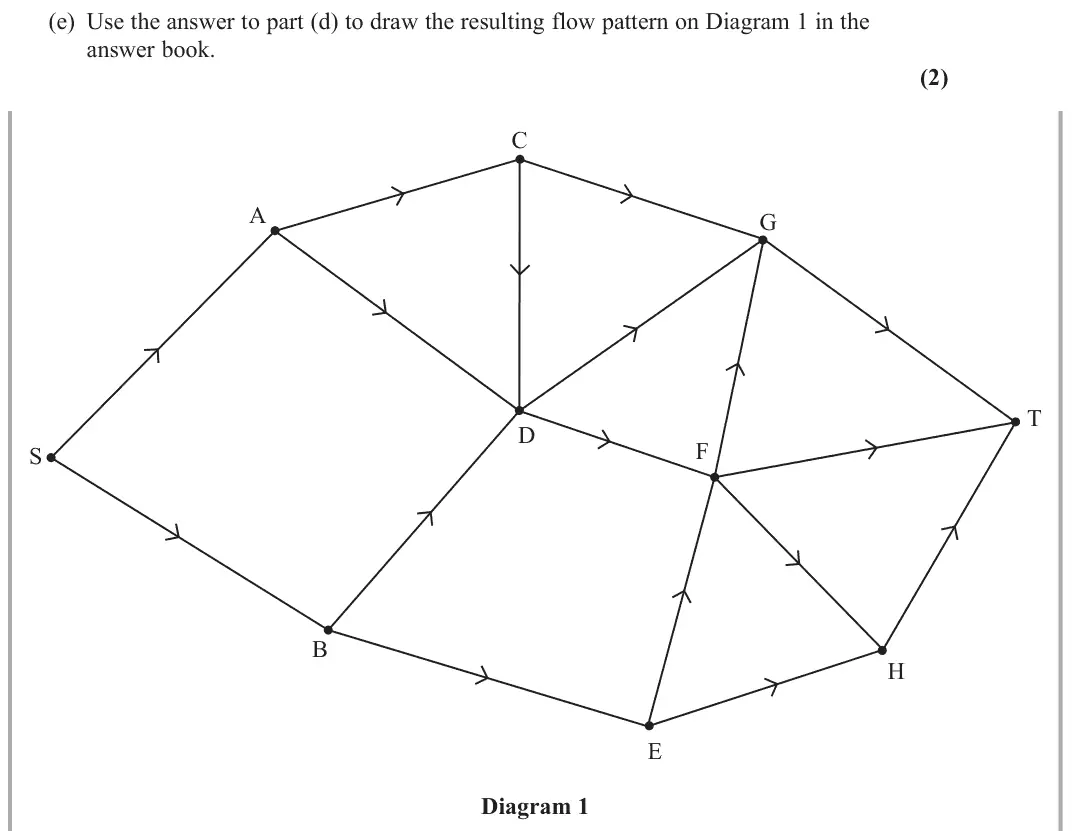
June 2025 · AS Paper 2 (Decision 2) · Q2(e)2 marks
Mark scheme (whole question; this part is marked with the orange bar)
Examiner's comment
Many learners struggled to answer part (a) in sufficient detail, for example just stating “cannot exceed capacity” without relating this to the flow in an arc. Most learners listed the saturated arcs correctly and many also calculated the value of the cuts correctly, although there were some errors seen. While many learners did give the correct flow augmenting route, there was a significant minority who failed to find this. As a consequence, there were a number of errors seen with the final flow diagram and some learners did not attempt this. Those learners who did attempt the final flow diagram generally went on to attempt to prove that the flow was maximal by finding a cut through saturated arcs. However, there were a number of errors seen, either with an incorrect cut, not stating the value of the cut or flow or failing to write the conclusion that, due to the Maximum Flow – Minimum Cut theorem the flow is maximal.
Key points from the mark scheme and examiner's report
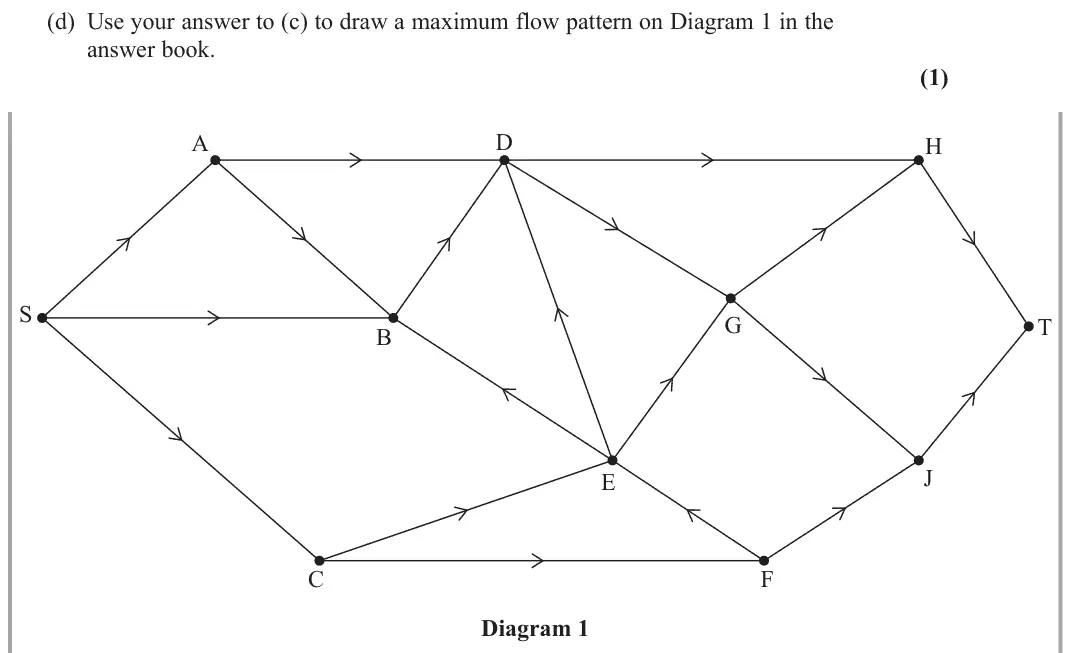
flow of 111 on Diagram 1: one number on every arc (e.g. SA 67, AD 36, DF 36, EF 2, FH 3, EH 22, HT 25)
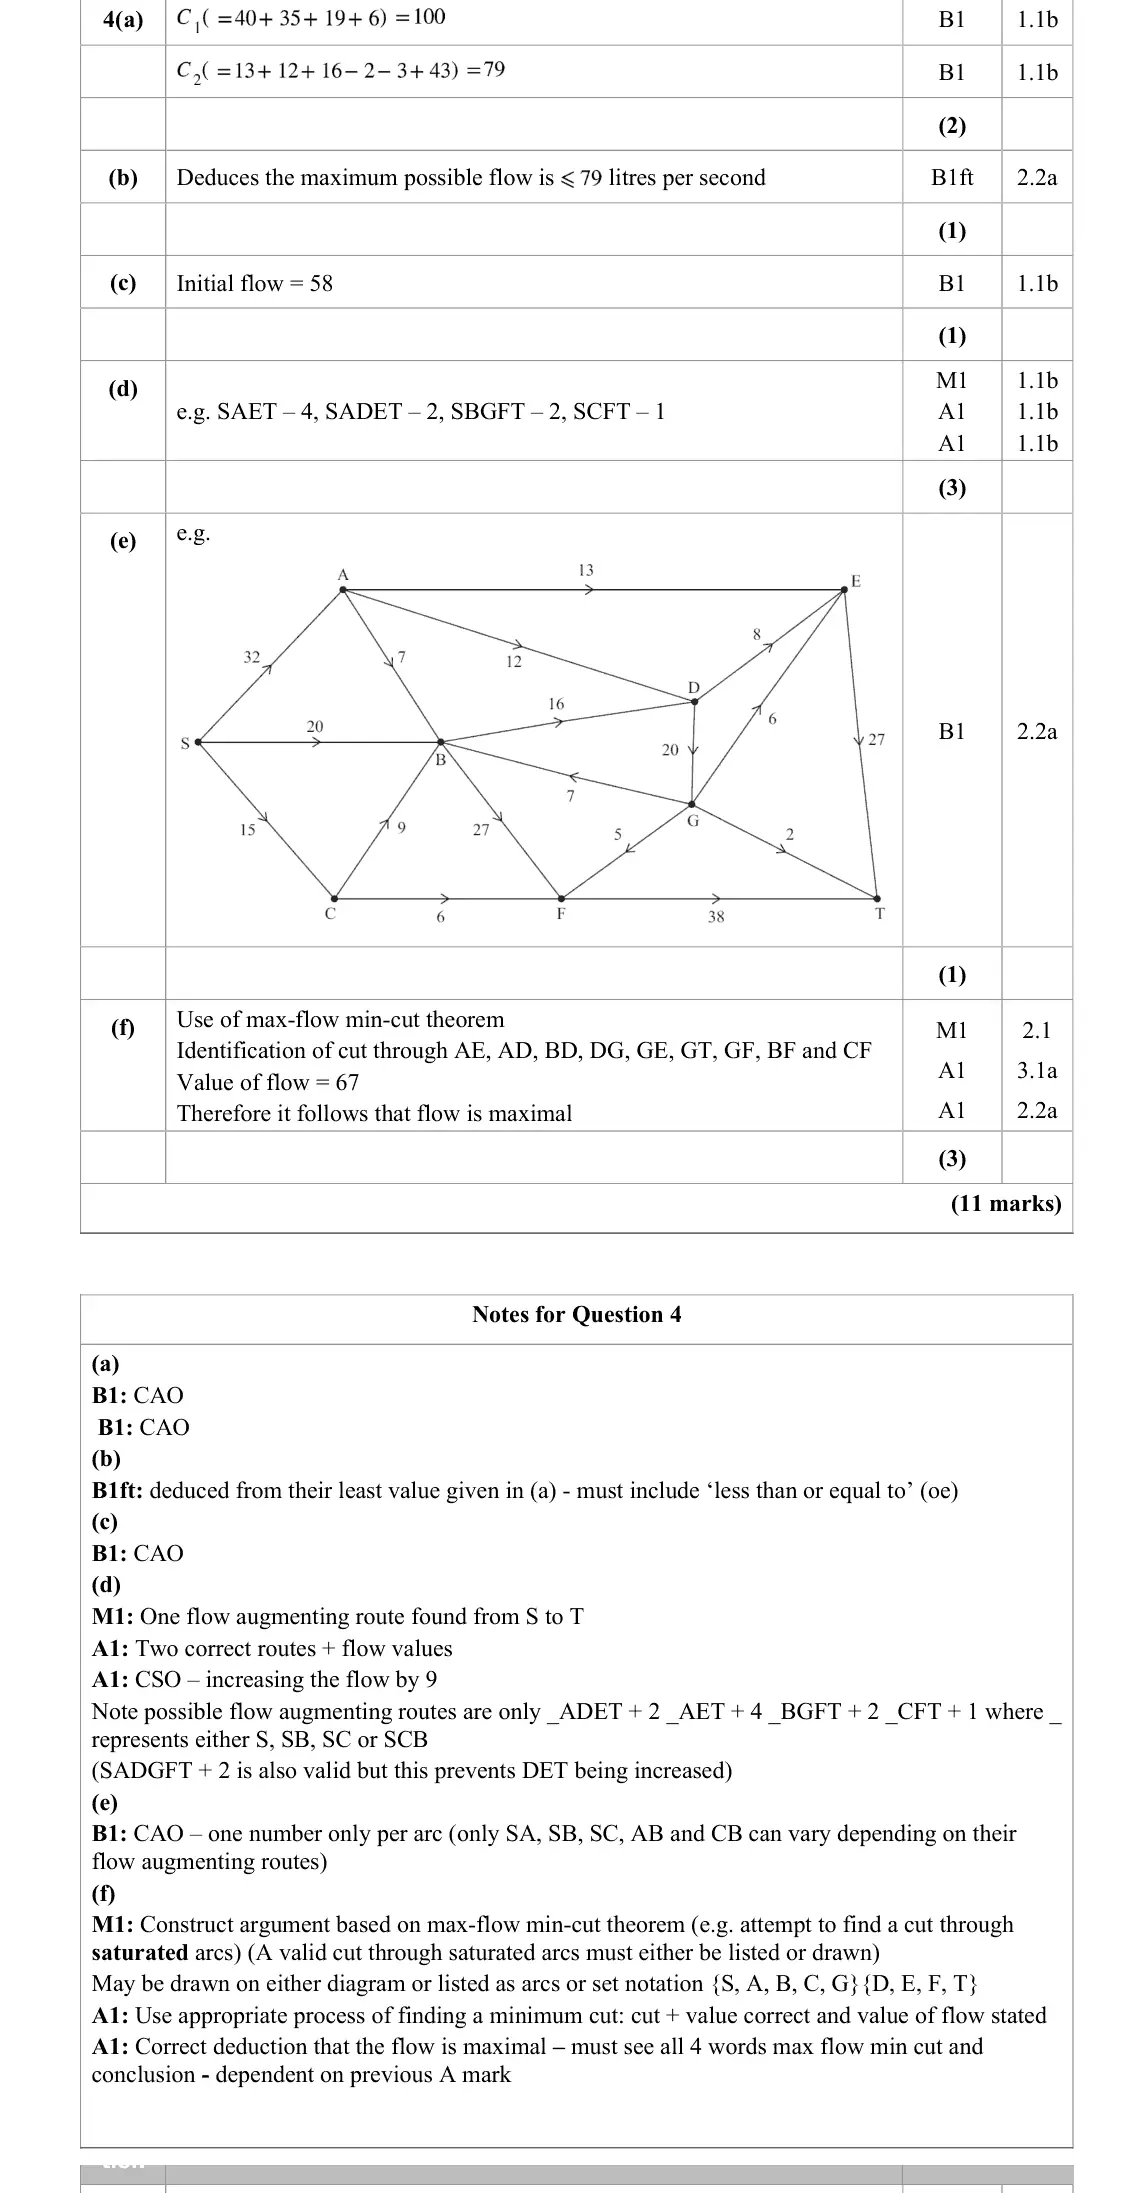
June 2025 · Paper 4D (Decision 2) · Q4(c)1 mark
Mark scheme (whole question; this part is marked with the orange bar)
Examiner's comment
A significant number of candidates struggled to answer this question well. While a good number of candidates calculated the value of cut C1 correctly, many did not calculate C2 correctly. Most candidates related the maximum value of the flow to the smaller value of their cuts, but some incorrectly stated that it was equal to this, rather than less than or equal to the value. Some candidates were able to deduce the value of the initial flow, but a significant number failed to do so. Most candidates were able to find at least two correct flow augmenting routes, although relatively few found all four and the correct final flow of 67. Very few candidates drew a correct final flow diagram and relatively few even attempted to prove that their flow was maximal. Of those that did attempt this, only some were able to build a complete argument that this was true.
Key points from the mark scheme and examiner's report
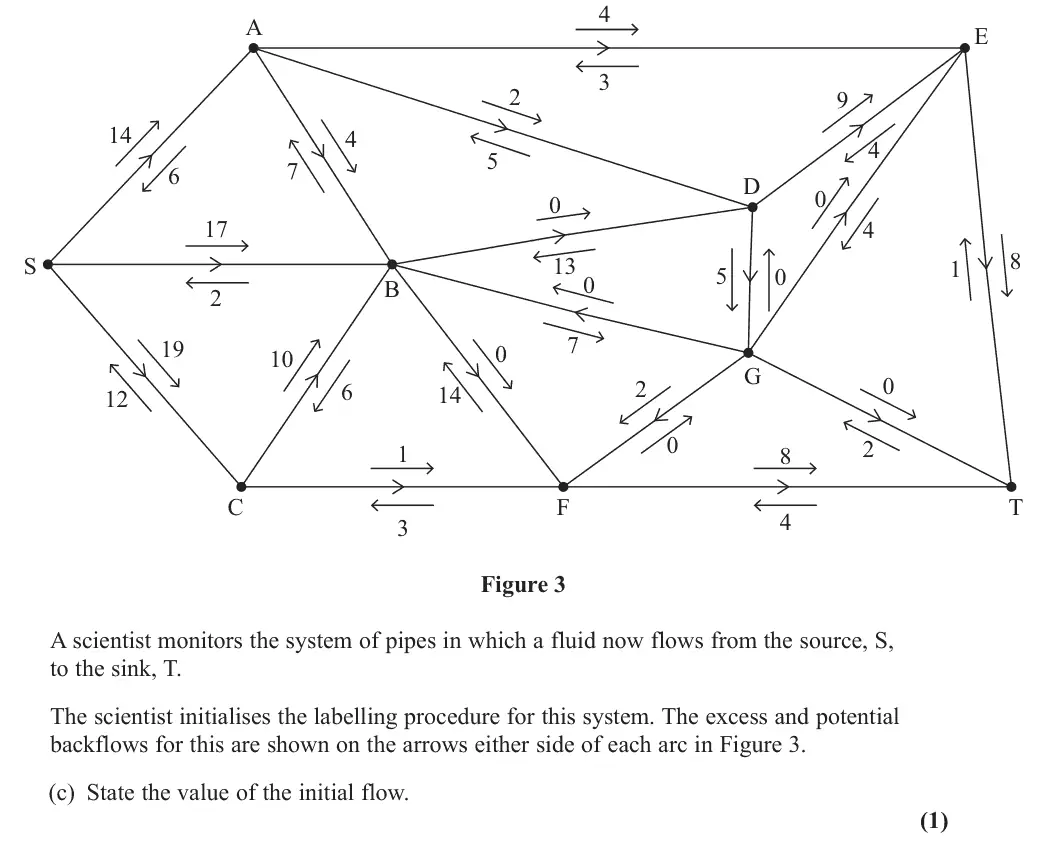
initial flow 58 (from the backflow arrows into T or out of S)
many could not deduce it
June 2025 · Paper 4D (Decision 2) · Q4(d)3 marks
Mark scheme (whole question; this part is marked with the orange bar)
Examiner's comment
A significant number of candidates struggled to answer this question well. While a good number of candidates calculated the value of cut C1 correctly, many did not calculate C2 correctly. Most candidates related the maximum value of the flow to the smaller value of their cuts, but some incorrectly stated that it was equal to this, rather than less than or equal to the value. Some candidates were able to deduce the value of the initial flow, but a significant number failed to do so. Most candidates were able to find at least two correct flow augmenting routes, although relatively few found all four and the correct final flow of 67. Very few candidates drew a correct final flow diagram and relatively few even attempted to prove that their flow was maximal. Of those that did attempt this, only some were able to build a complete argument that this was true.
Key points from the mark scheme and examiner's report
e.g. SAET 4, SADET 2, SBGFT 2, SCFT 1: increase of 9 to 67
few found all four routes
June 2025 · Paper 4D (Decision 2) · Q4(e)1 mark
Mark scheme (whole question; this part is marked with the orange bar)
Examiner's comment
A significant number of candidates struggled to answer this question well. While a good number of candidates calculated the value of cut C1 correctly, many did not calculate C2 correctly. Most candidates related the maximum value of the flow to the smaller value of their cuts, but some incorrectly stated that it was equal to this, rather than less than or equal to the value. Some candidates were able to deduce the value of the initial flow, but a significant number failed to do so. Most candidates were able to find at least two correct flow augmenting routes, although relatively few found all four and the correct final flow of 67. Very few candidates drew a correct final flow diagram and relatively few even attempted to prove that their flow was maximal. Of those that did attempt this, only some were able to build a complete argument that this was true.
Key points from the mark scheme and examiner's report
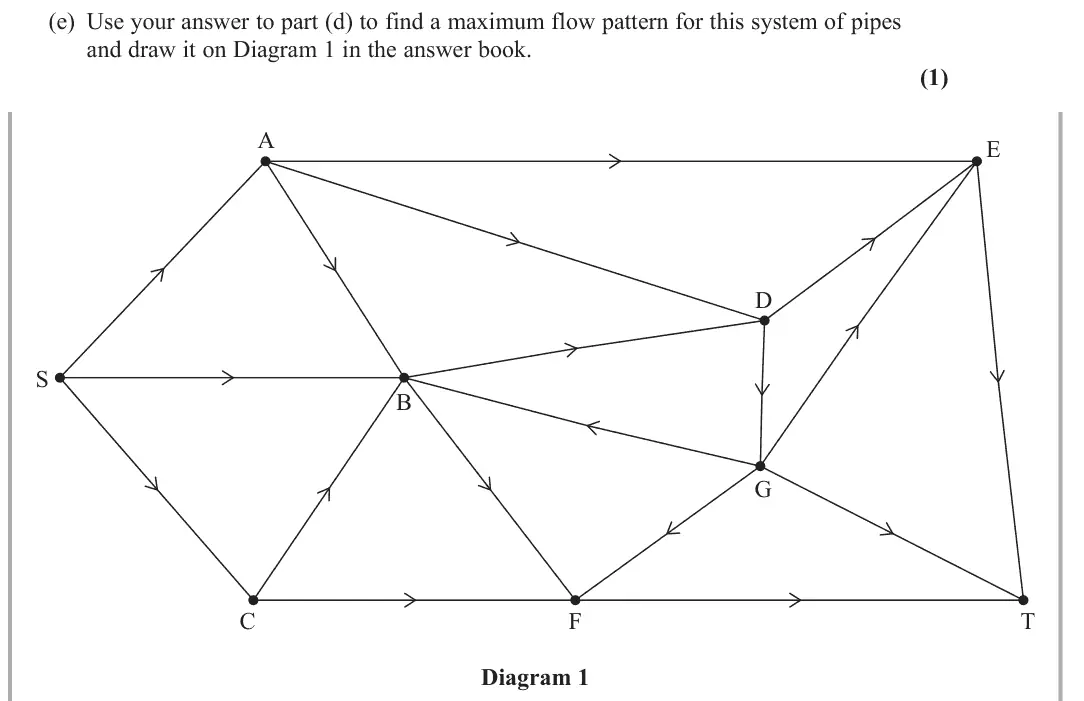
flow of 67, one number per arc, consistent at every vertex and within the (lower, upper) bounds
very few drew a correct diagram
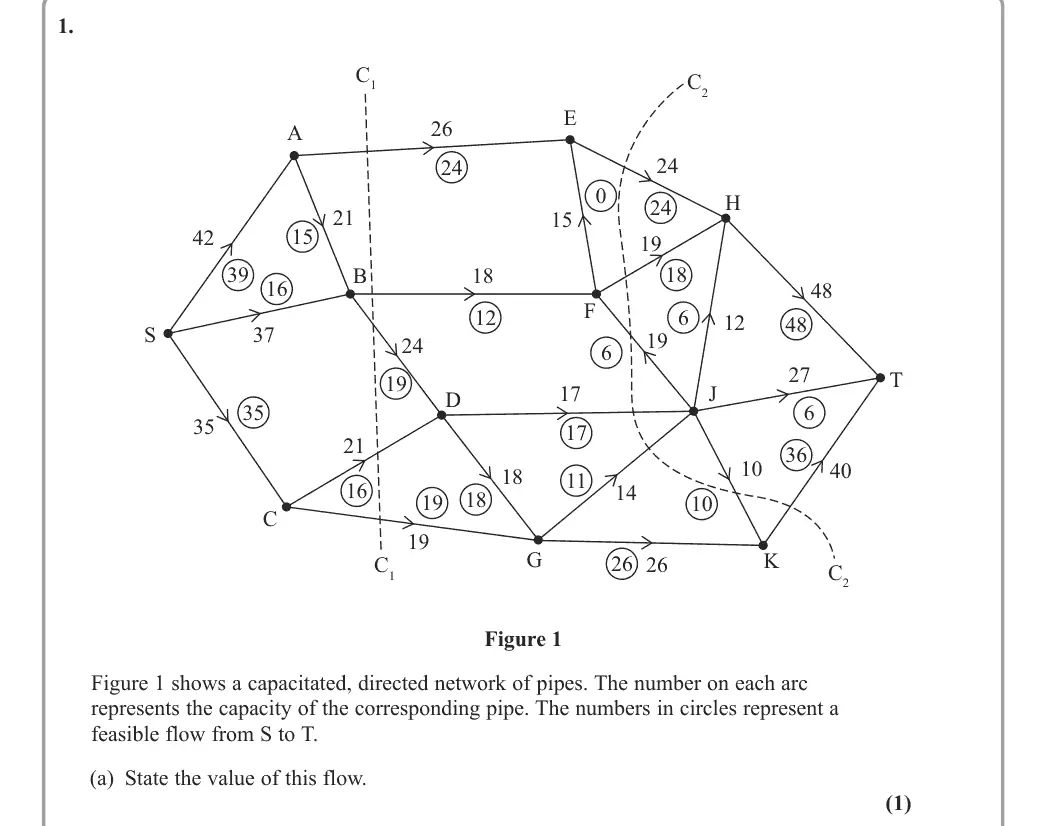
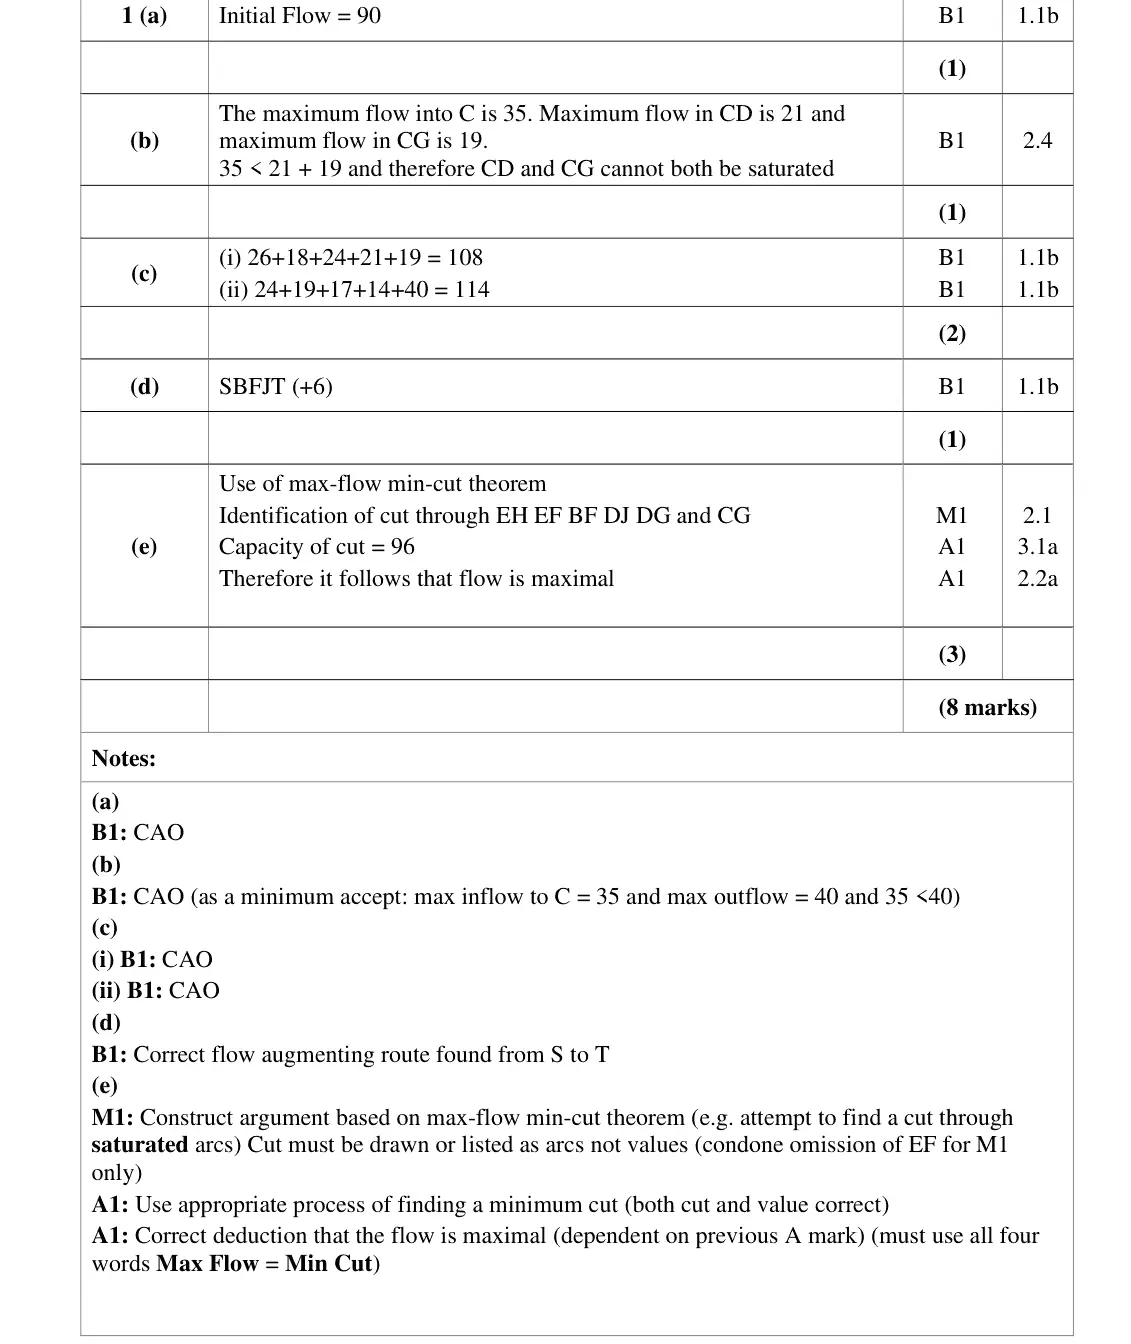
June 2024 · AS Paper 2 (Decision 2) · Q1(a)1 mark
Mark scheme (whole question; this part is marked with the orange bar)
Examiner's comment
Most candidates found this question accessible and were able to answer at least some parts. Most calculated the initial flow correctly and then recognised that the capacity of SC (35) could not saturate the two arcs connected to it as their combined capacities totalled 40. However, some failed to mention that the flow of 35 was the maximum or did not compare 35 and 40 or did not give values for the capacities at all. A few focused on the flow beyond C without mention of the flow into C. Most candidates calculated the correct value for the first cut, but a number made errors with the, more complicated, second cut. Many candidates found the correct flow augmenting route, although some incorrectly tried to increase the flow in JH or HT. Although most candidates had a general idea of the maximum flow minimum cut theorem, a significant number did not answer this part of the question well. The cut was often not shown on the diagram. When it was, it sometimes went through AE instead of EH, which is not a saturated arc. Those listing the arcs of their cut occasionally omitted EF. Some just referred to a cut, C3, without showing it or listing its arcs. Most who had the correct cut stated the flow of 96 and the maximum flow/minimum cut theorem. A few stated flows of 96 and ‘max flow/min cut’ but scored no marks as no cut was given or shown.
Key points from the mark scheme and examiner's report
value of the flow is 90
June 2024 · AS Paper 2 (Decision 2) · Q1(d)1 mark
Mark scheme (whole question; this part is marked with the orange bar)
Examiner's comment
Most candidates found this question accessible and were able to answer at least some parts. Most calculated the initial flow correctly and then recognised that the capacity of SC (35) could not saturate the two arcs connected to it as their combined capacities totalled 40. However, some failed to mention that the flow of 35 was the maximum or did not compare 35 and 40 or did not give values for the capacities at all. A few focused on the flow beyond C without mention of the flow into C. Most candidates calculated the correct value for the first cut, but a number made errors with the, more complicated, second cut. Many candidates found the correct flow augmenting route, although some incorrectly tried to increase the flow in JH or HT. Although most candidates had a general idea of the maximum flow minimum cut theorem, a significant number did not answer this part of the question well. The cut was often not shown on the diagram. When it was, it sometimes went through AE instead of EH, which is not a saturated arc. Those listing the arcs of their cut occasionally omitted EF. Some just referred to a cut, C3, without showing it or listing its arcs. Most who had the correct cut stated the flow of 96 and the maximum flow/minimum cut theorem. A few stated flows of 96 and ‘max flow/min cut’ but scored no marks as no cut was given or shown.
Key points from the mark scheme and examiner's report
SBFJT (+6)
some tried to increase JH or HT, which are not possible
June 2024 · Paper 4D (Decision 2) · Q1(a)2 marks
Mark scheme (whole question; this part is marked with the orange bar)
Examiner's comment
Most candidates produced a good response to this question and were generally able to answer parts a, b, c and d. Where some candidates had problems was in not drawing the correct cut or
Key points from the mark scheme and examiner's report
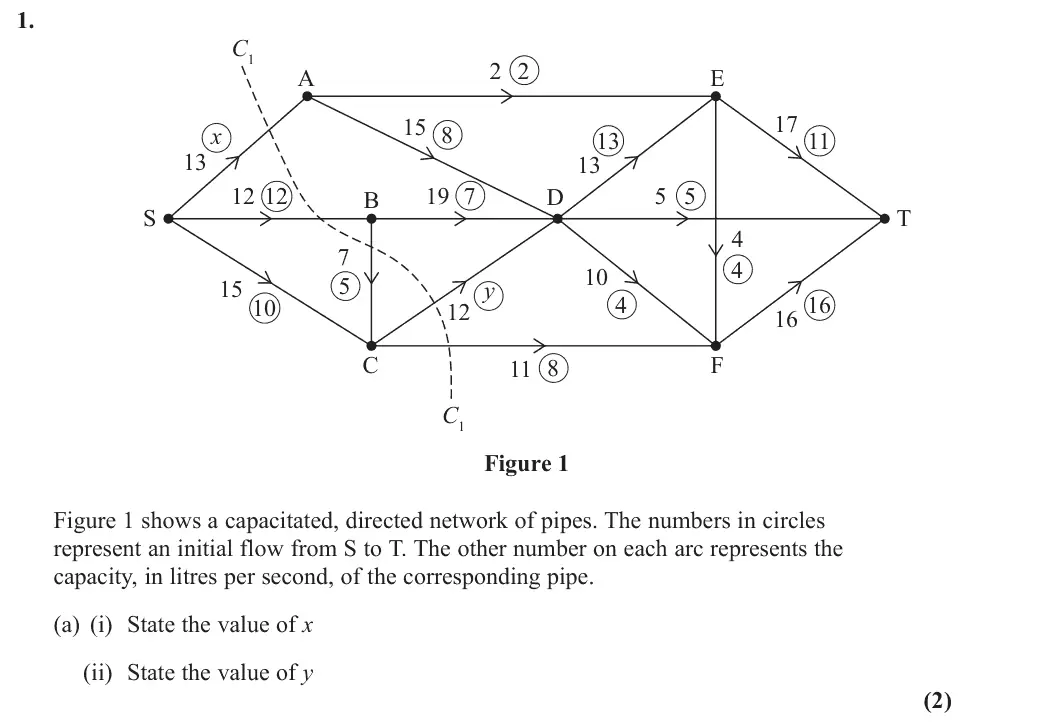
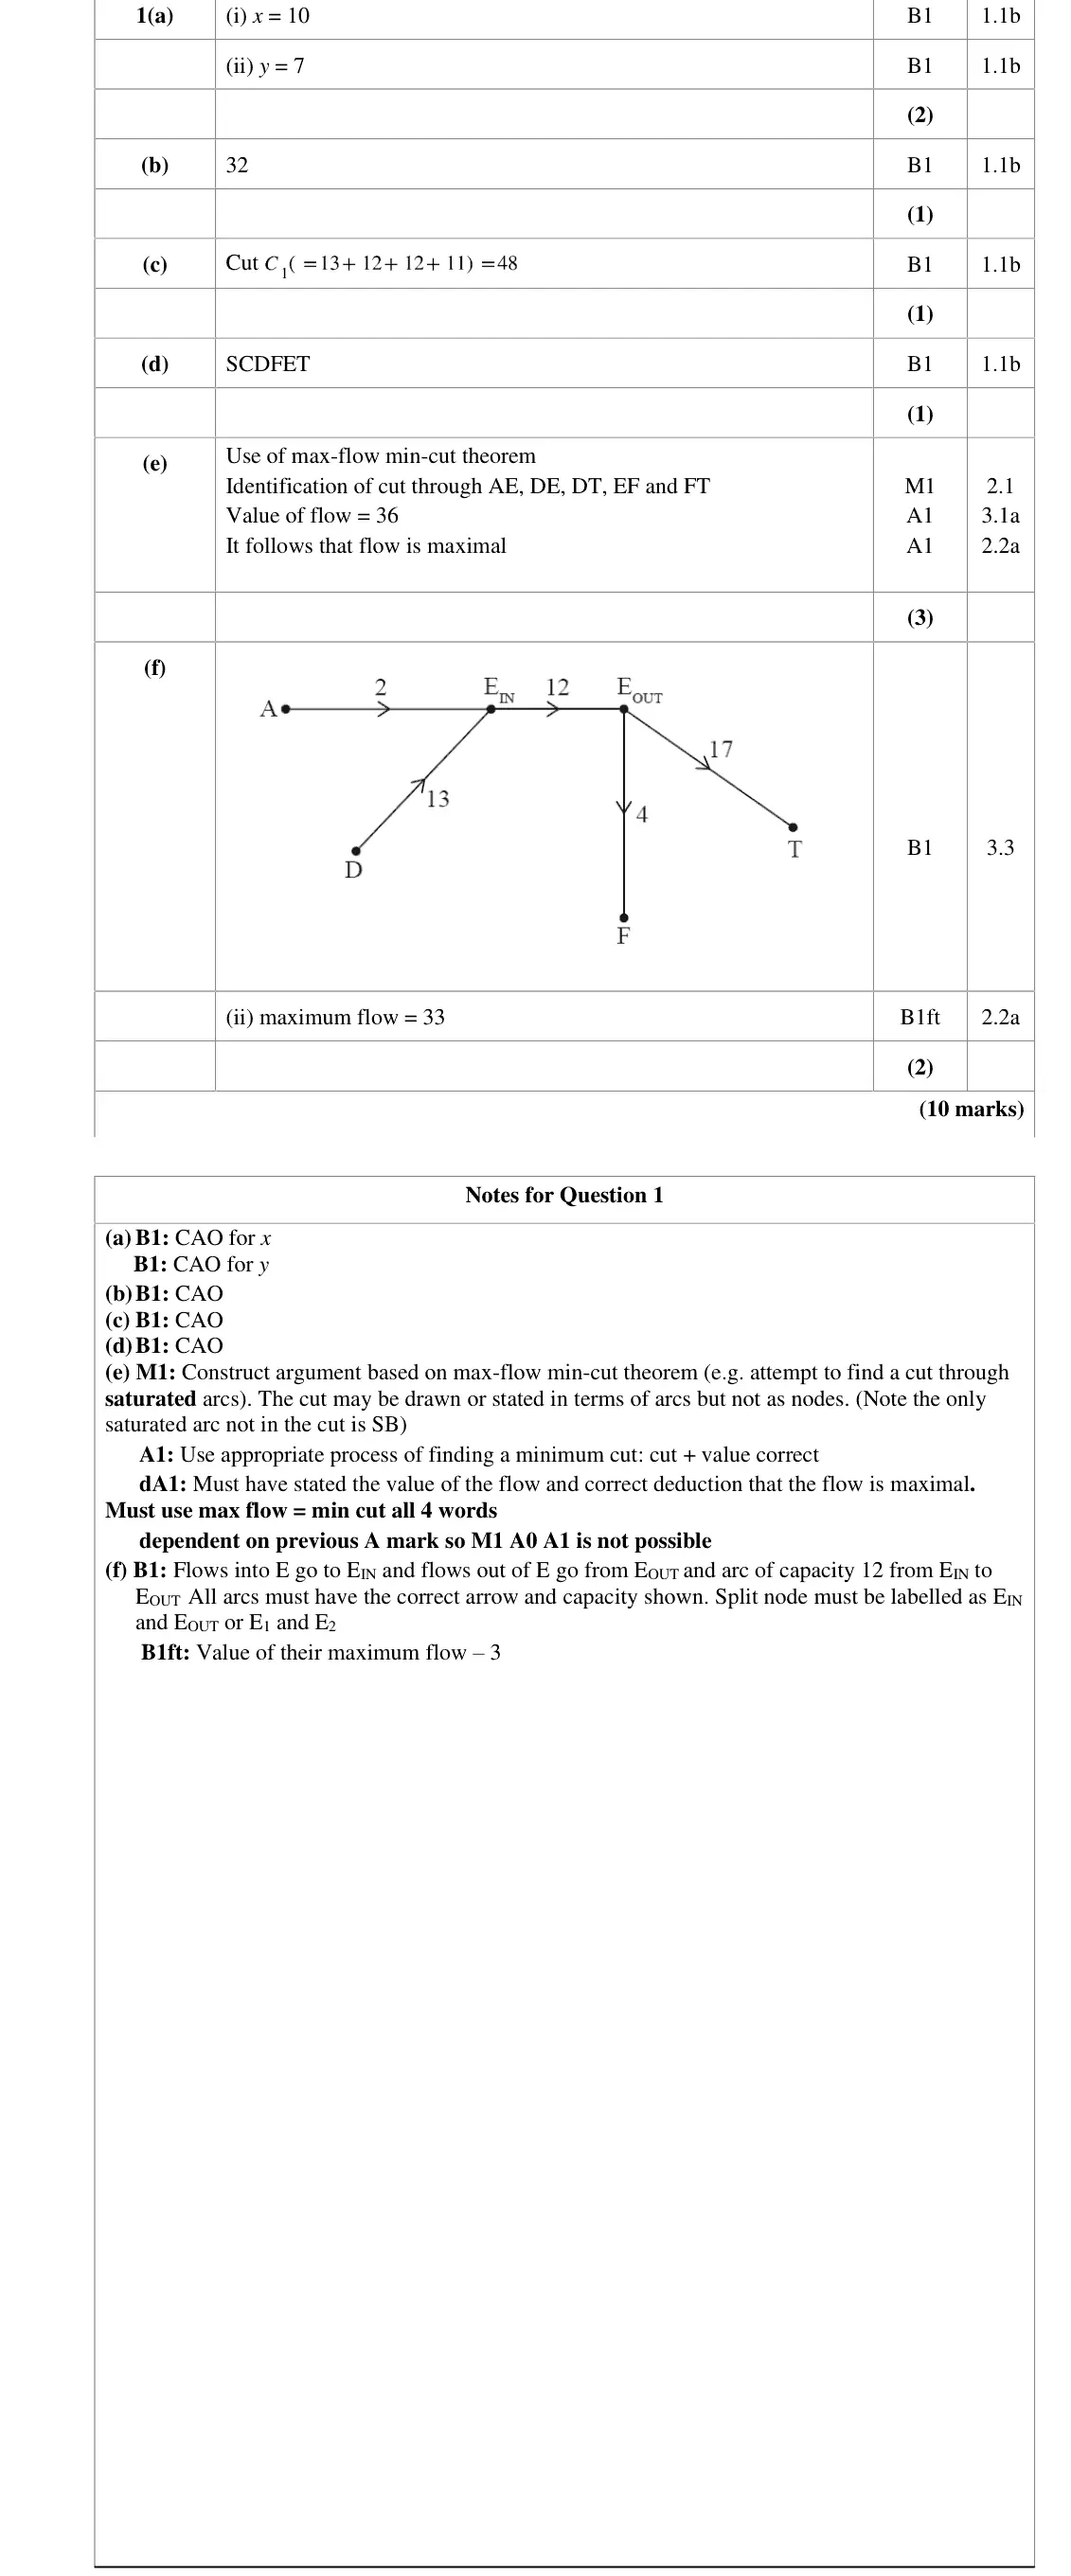
flow in = flow out at A and D: x = 10, y = 7
June 2024 · Paper 4D (Decision 2) · Q1(b)1 mark
Mark scheme (whole question; this part is marked with the orange bar)
Examiner's comment
Most candidates produced a good response to this question and were generally able to answer parts a, b, c and d. Where some candidates had problems was in not drawing the correct cut or
Key points from the mark scheme and examiner's report
initial flow 32
June 2024 · Paper 4D (Decision 2) · Q1(d)1 mark
Mark scheme (whole question; this part is marked with the orange bar)
Examiner's comment
Most candidates produced a good response to this question and were generally able to answer parts a, b, c and d. Where some candidates had problems was in not drawing the correct cut or
Key points from the mark scheme and examiner's report
S–C–D–F–E–T, using the backflow in EF
June 2023 · AS Paper 2 (Decision 2) · Q2(a)1 mark
Mark scheme (whole question; this part is marked with the orange bar)
Examiner's comment
In (a) and (b) nearly all candidates correctly stated the initial flow from S to T as 72 and the value of the given cut (as 92).
Key points from the mark scheme and examiner's report
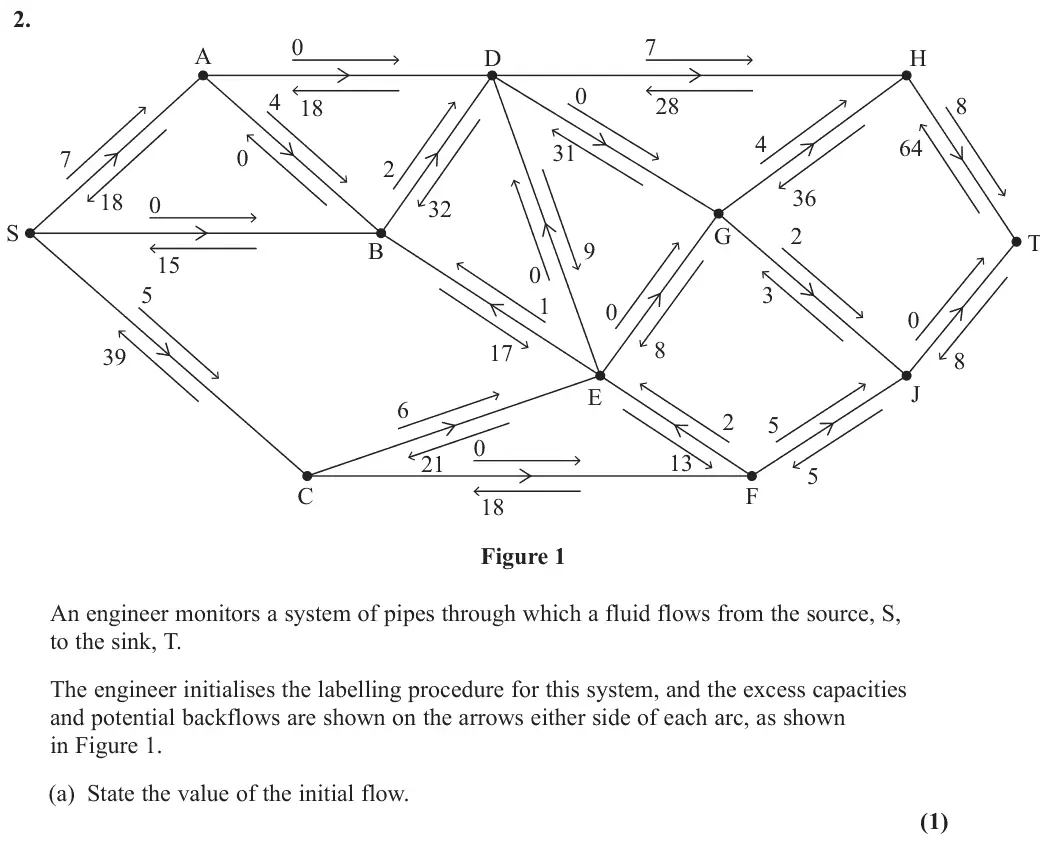
initial flow 72 from the potential backflows into T (or out of S)
June 2023 · AS Paper 2 (Decision 2) · Q2(c)3 marks
Mark scheme (whole question; this part is marked with the orange bar)
Examiner's comment
Most candidates stated at least one correct flow-augmenting route in part (c) (together with its length) although some gave routes that totalled more than the maximum permissible increase (which was 5). Candidates are reminded that routes should be stated in terms of nodes starting with S and finishing with T.
Key points from the mark scheme and examiner's report
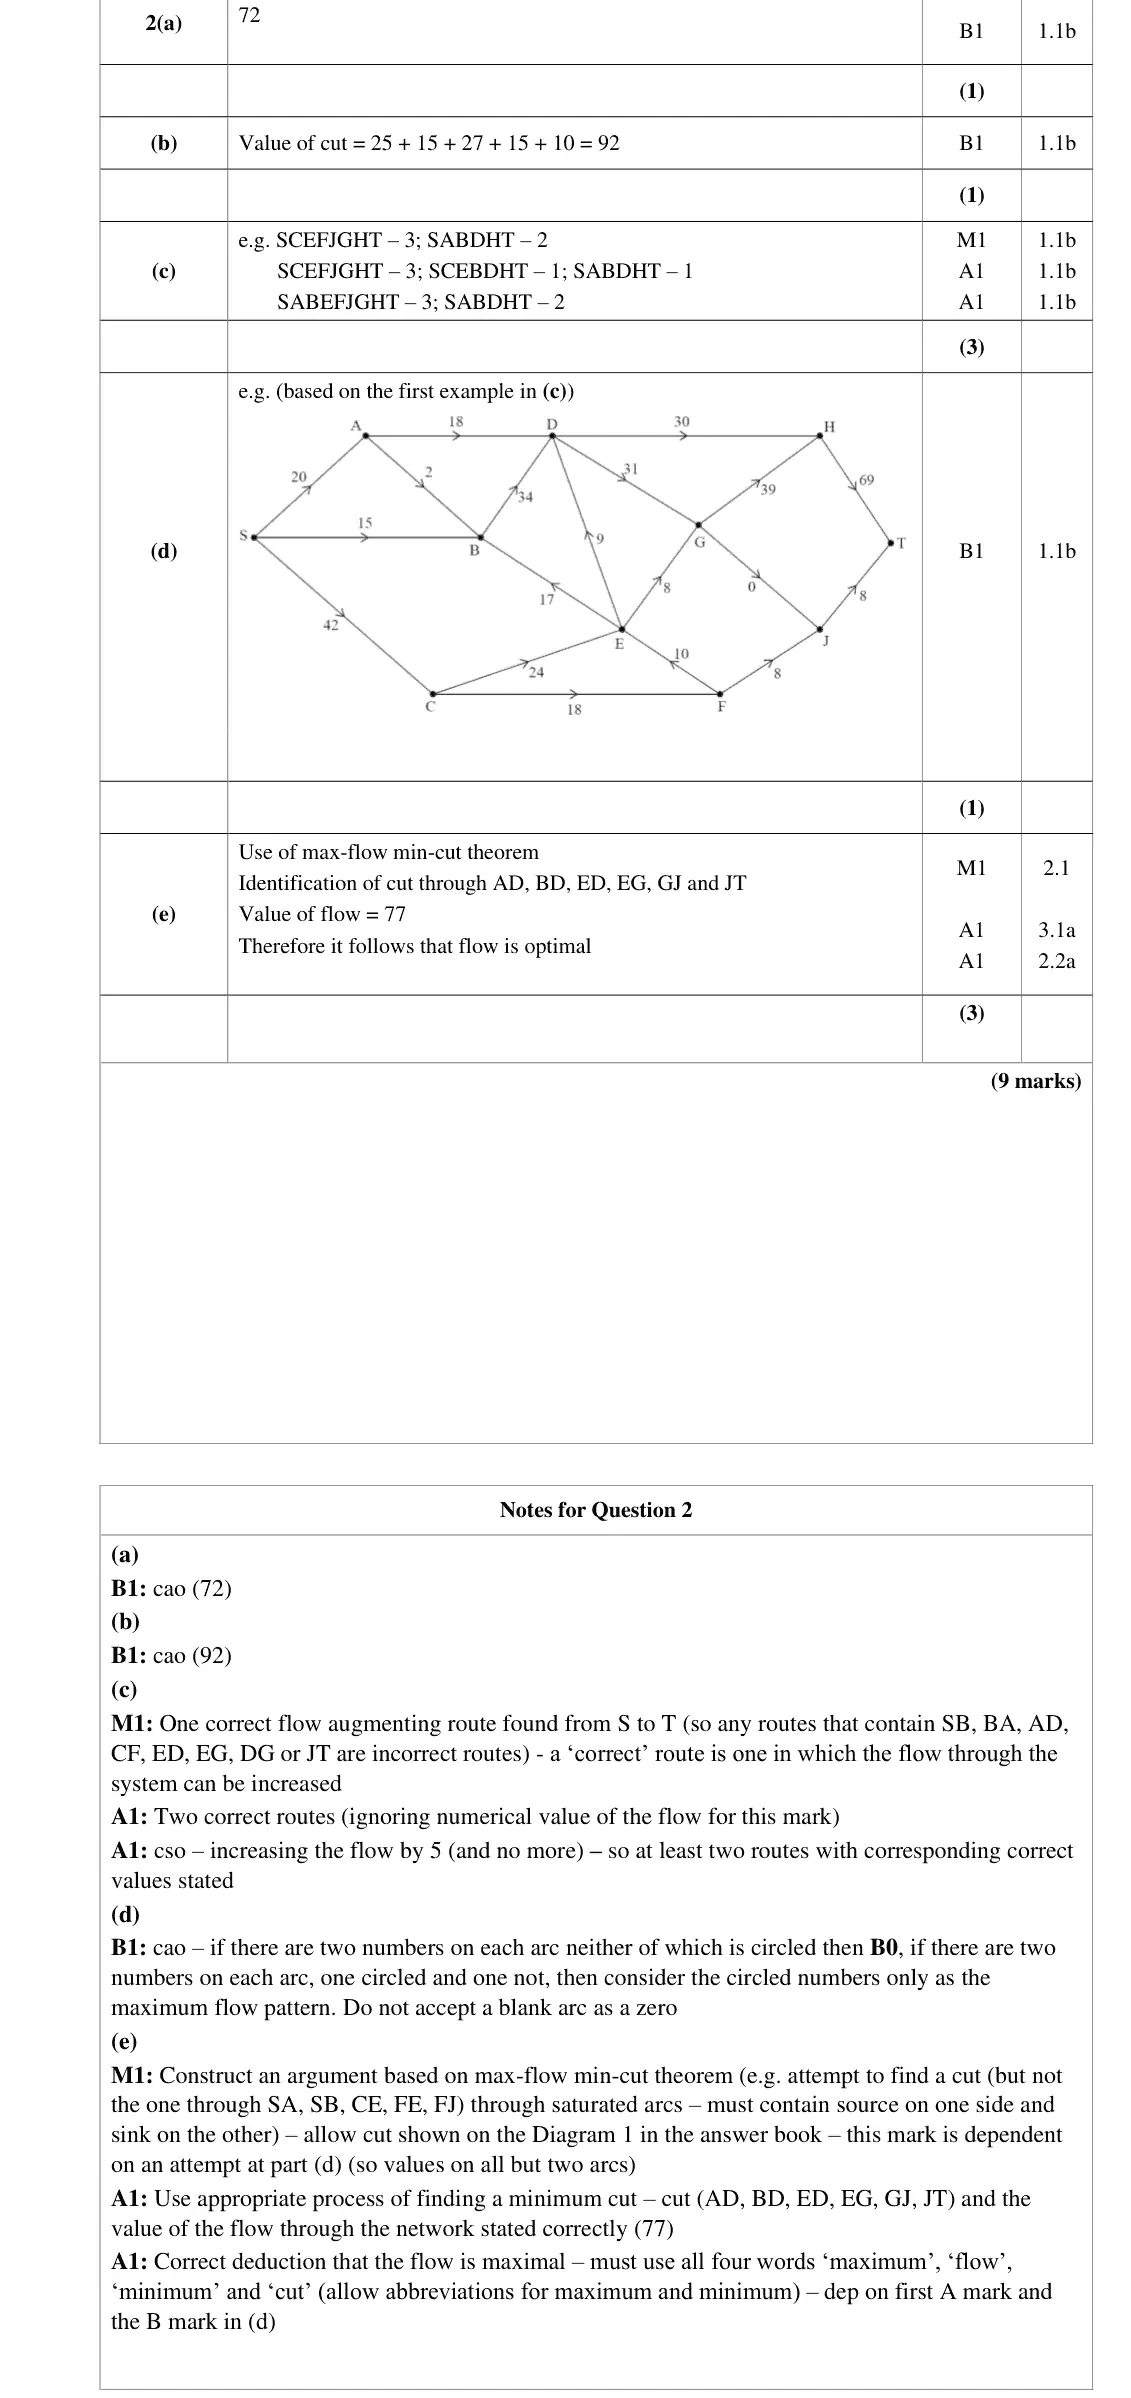
routes as node lists from S to T with flows, e.g. SCEFJGHT 3, SABDHT 2
total increase exactly 5 (some exceeded it)
June 2023 · AS Paper 2 (Decision 2) · Q2(d)1 mark
Mark scheme (whole question; this part is marked with the orange bar)
Examiner's comment
Although many candidates correctly found the flow-augmenting routes required (to increase the flow by a maximum of 5 units) it was rare for candidates to draw a correct maximum flow pattern in part (d). Candidates are reminded that no arc should be left blank (a blank is not assumed to be 0) and that each arc should only have a single value written on it (and therefore they should not waste time showing the flow and the capacity on each arc).
Key points from the mark scheme and examiner's report
flow of 77 on Diagram 1
one value on every arc, a blank is not taken as 0
correct patterns were rare
June 2023 · Paper 4D (Decision 2) · Q1(a)1 mark
Mark scheme (whole question; this part is marked with the orange bar)
Examiner's comment
This question proved to be accessible for most candidates. Most candidates stated the value of the initial flow correctly. Some made errors calculating the value of the cuts, either by omitting an arc or by including arcs flowing from the sink to the source. Most candidates found the correct flow augmenting route. A significant number of candidates made errors attempting to prove that the flow is maximal. Most either drew or stated a cut, although some incorrectly including AF in their cut. The most common error was failing to state the value of either the flow or the cut (or both) and some candidates failed to make reference to the Maximum Flow – Minimum Cut Theorem.
Key points from the mark scheme and examiner's report
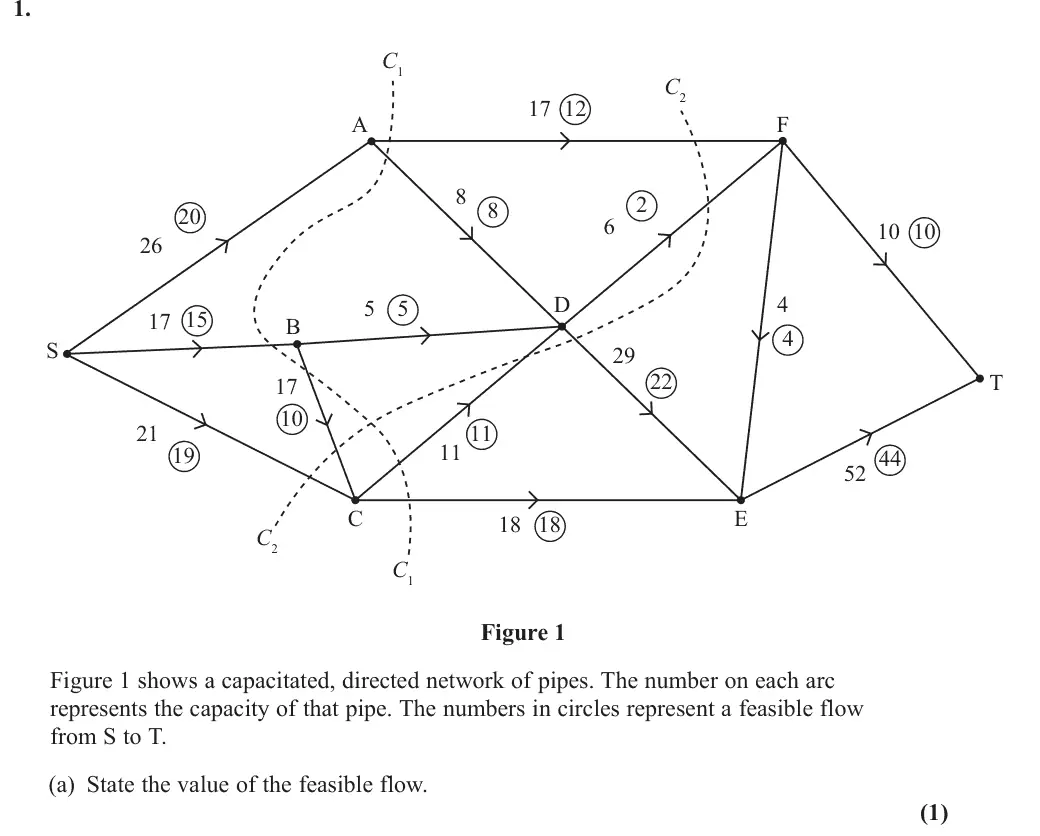
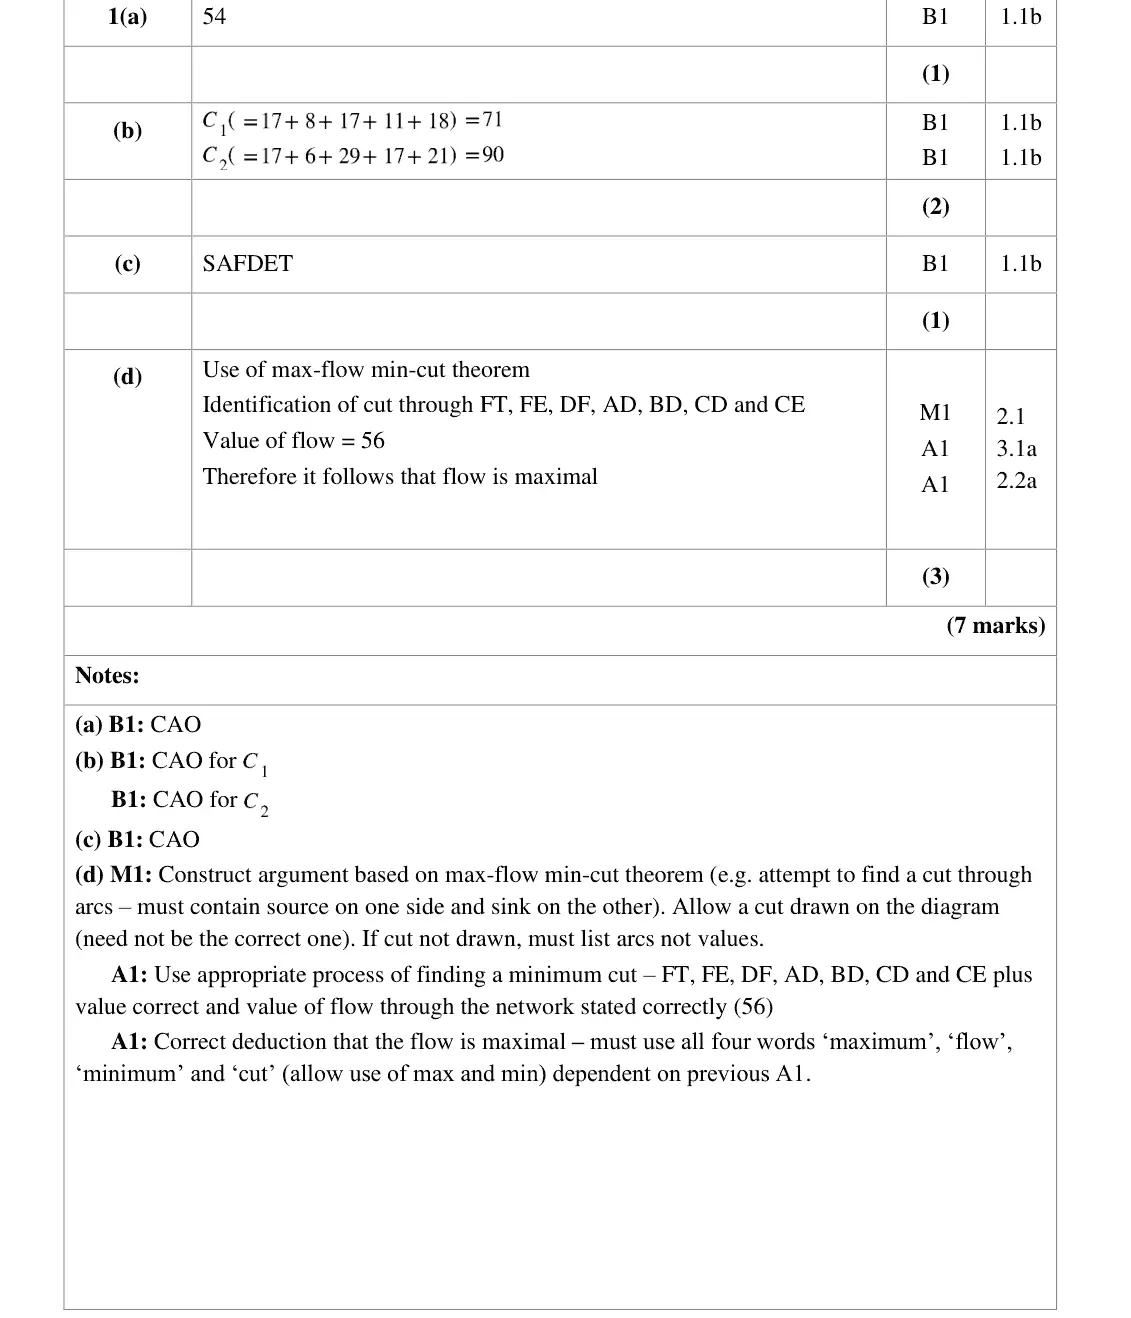
value of the feasible flow 54
June 2023 · Paper 4D (Decision 2) · Q1(c)1 mark
Mark scheme (whole question; this part is marked with the orange bar)
Examiner's comment
This question proved to be accessible for most candidates. Most candidates stated the value of the initial flow correctly. Some made errors calculating the value of the cuts, either by omitting an arc or by including arcs flowing from the sink to the source. Most candidates found the correct flow augmenting route. A significant number of candidates made errors attempting to prove that the flow is maximal. Most either drew or stated a cut, although some incorrectly including AF in their cut. The most common error was failing to state the value of either the flow or the cut (or both) and some candidates failed to make reference to the Maximum Flow – Minimum Cut Theorem.
Key points from the mark scheme and examiner's report
S–A–F–D–E–T (uses backflow in DF)
June 2022 · AS Paper 2 (Decision 2) · Q2(a)1 mark
Mark scheme (whole question; this part is marked with the orange bar)
Examiner's comment
In (a) and (b) nearly all candidates correctly stated the feasible flow from S to T as 50 and the eight saturated arcs respectively.
Key points from the mark scheme and examiner's report
value of the flow is 50
June 2022 · AS Paper 2 (Decision 2) · Q2(b)1 mark
Mark scheme (whole question; this part is marked with the orange bar)
Examiner's comment
In (a) and (b) nearly all candidates correctly stated the feasible flow from S to T as 50 and the eight saturated arcs respectively.
Key points from the mark scheme and examiner's report
AB, BC, SD, BE, DT, GE, GH, GT
June 2022 · AS Paper 2 (Decision 2) · Q2(e)1 mark
Mark scheme (whole question; this part is marked with the orange bar)
Examiner's comment
Most candidates correctly stated the required flow-augmenting route in (e) although some gave more than one route (even though the question specifically asked for a single route).
Key points from the mark scheme and examiner's report
single route SACBFEHT using the backflow on BC
some gave more than one route
June 2022 · Paper 4D (Decision 2) · Q4(b)1 mark
Mark scheme (whole question; this part is marked with the orange bar)
Examiner's comment
Most candidates correctly listed all 7 saturated arcs, although a few failed to do so, only giving 6 of them. Almost all candidates then stated the correct initial flow of 95 and many gave a correct explanation that the maximum flow into F was 22 which is less than 24 the capacity of FT. Some did not give both figures and were penalised here. Most candidates found the correct value of the cut C1but a significant number made an error with C2 stating 108 having incorrectly subtracted the capacity of BD. A significant number of candidates failed to find the correct flow augmenting route of SABDFT and other errors here included a descriptive approach, listing the route as a series of arcs with associated actions, or trying to give multiple routes. While many candidates had some idea of the max-flow-min-cut theorem, it was often not used correctly. Some failed to state the value of the flow. Others did not draw or list the arcs in the cut correctly or did not state the value of the cut. Some then failed to use correct wording and make the deduction that the flow was maximal. A surprising number of candidates called their augmented flow of 98 ‘initial flow’, which, though incorrect, was not penalised.
Key points from the mark scheme and examiner's report
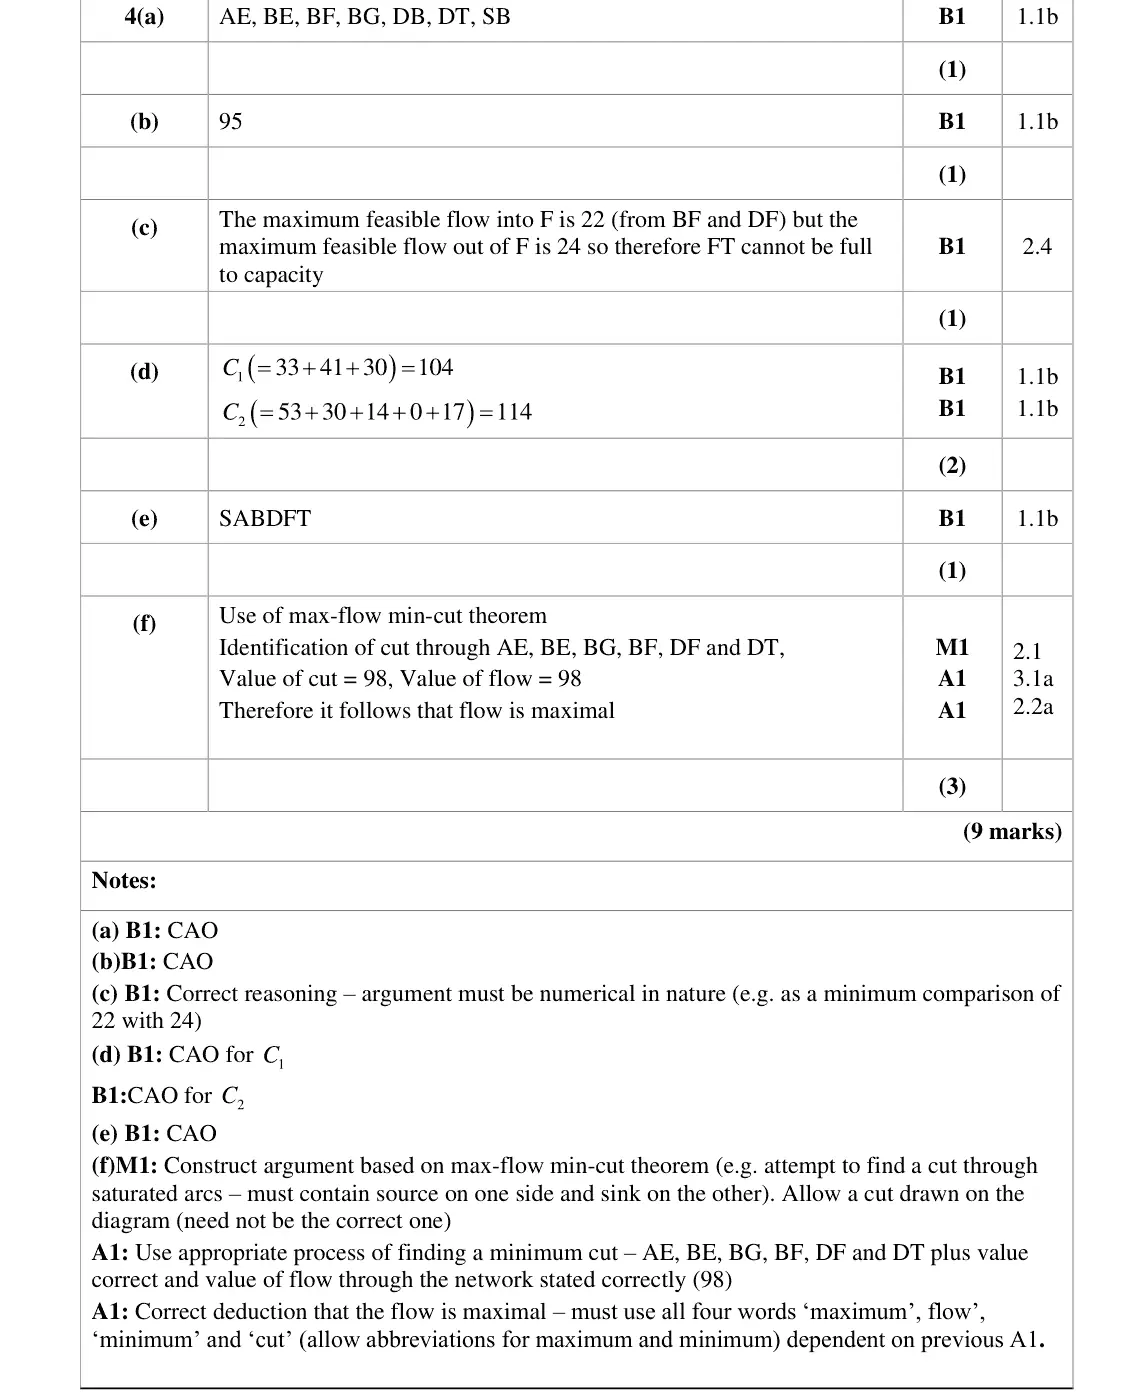
initial flow 95
June 2022 · Paper 4D (Decision 2) · Q4(e)1 mark
Mark scheme (whole question; this part is marked with the orange bar)
Examiner's comment
Most candidates correctly listed all 7 saturated arcs, although a few failed to do so, only giving 6 of them. Almost all candidates then stated the correct initial flow of 95 and many gave a correct explanation that the maximum flow into F was 22 which is less than 24 the capacity of FT. Some did not give both figures and were penalised here. Most candidates found the correct value of the cut C1but a significant number made an error with C2 stating 108 having incorrectly subtracted the capacity of BD. A significant number of candidates failed to find the correct flow augmenting route of SABDFT and other errors here included a descriptive approach, listing the route as a series of arcs with associated actions, or trying to give multiple routes. While many candidates had some idea of the max-flow-min-cut theorem, it was often not used correctly. Some failed to state the value of the flow. Others did not draw or list the arcs in the cut correctly or did not state the value of the cut. Some then failed to use correct wording and make the deduction that the flow was maximal. A surprising number of candidates called their augmented flow of 98 ‘initial flow’, which, though incorrect, was not penalised.
Key points from the mark scheme and examiner's report
S–A–B–D–F–T, reducing the flow in DB (backflow)
a list of arcs with actions or multiple routes not accepted
Nov 2021 · Paper 4D (Decision 2) · Q5(c)1 mark
Mark scheme (whole question; this part is marked with the orange bar)
Key points from the mark scheme and examiner's report
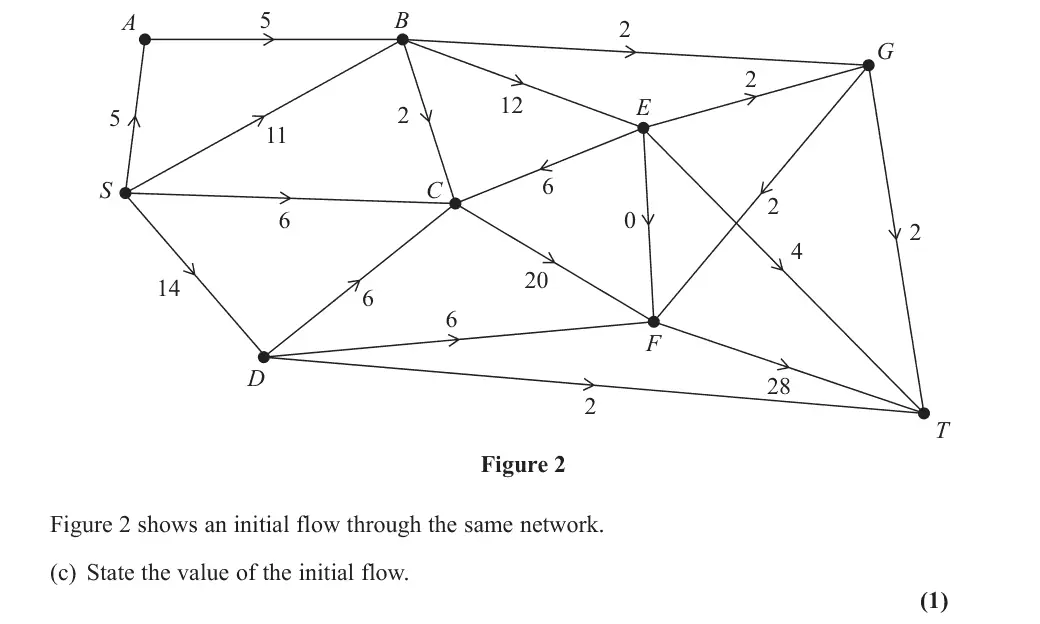
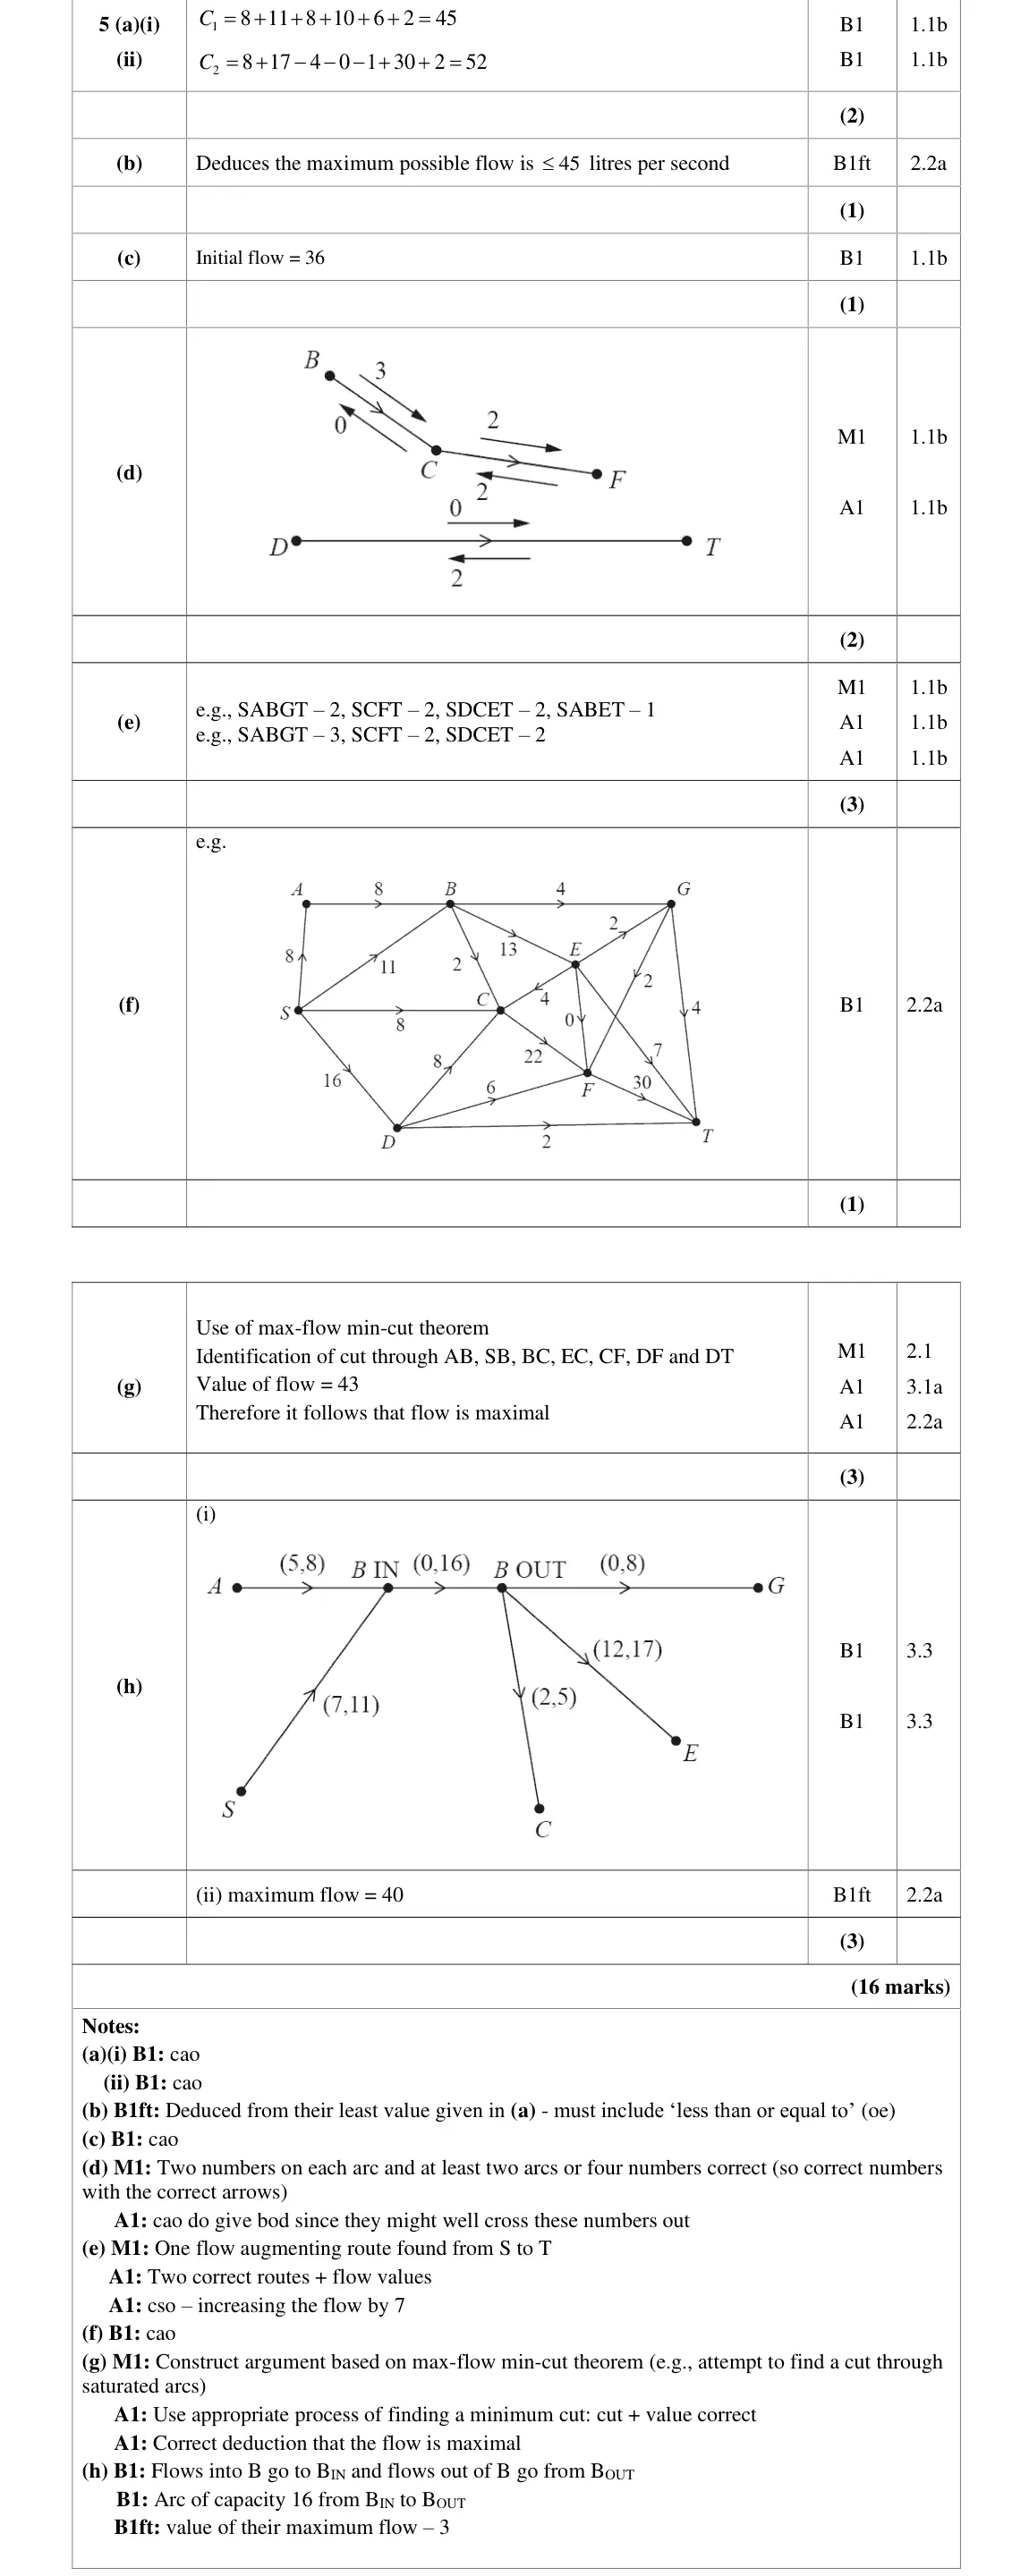
initial flow 36
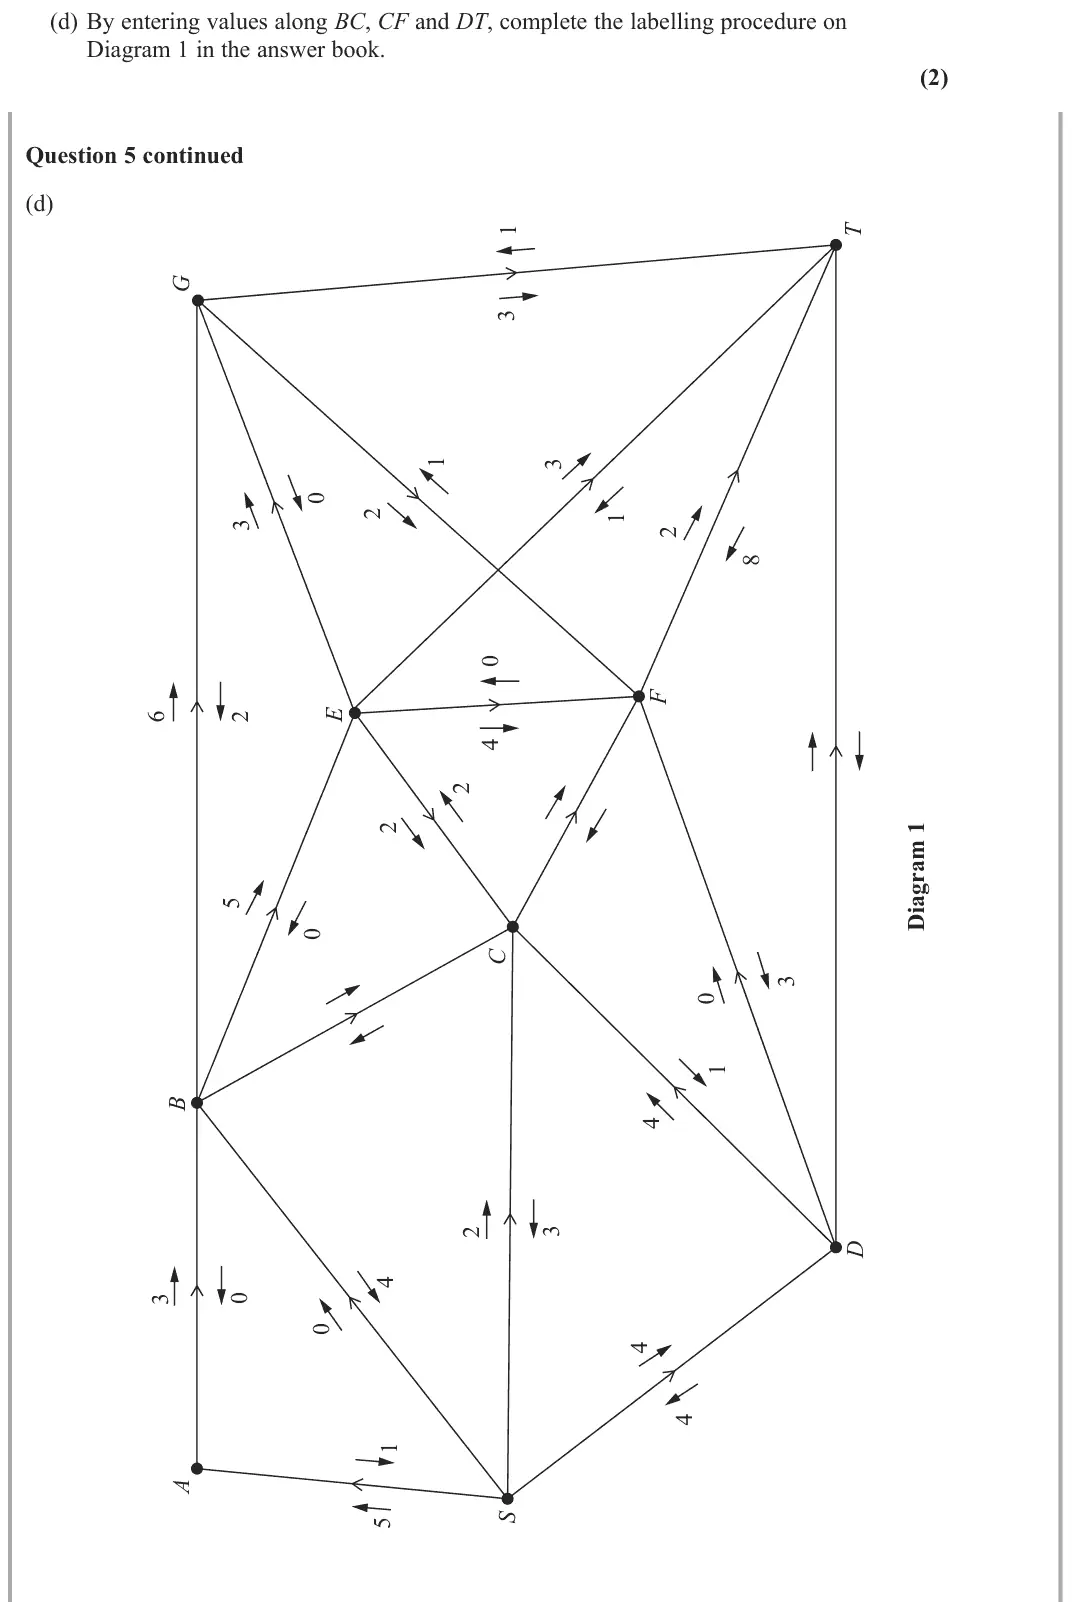
Nov 2021 · Paper 4D (Decision 2) · Q5(d)2 marks
Mark scheme (whole question; this part is marked with the orange bar)
Key points from the mark scheme and examiner's report
forward arrow shows spare capacity, backward arrow the current flow above the lower capacity: BC 3 and 0, CF 2 and 2, DT 0 and 2
Nov 2021 · Paper 4D (Decision 2) · Q5(e)3 marks
Mark scheme (whole question; this part is marked with the orange bar)
Key points from the mark scheme and examiner's report
e.g. SABGT 3, SCFT 2, SDCET 2
total increase 7
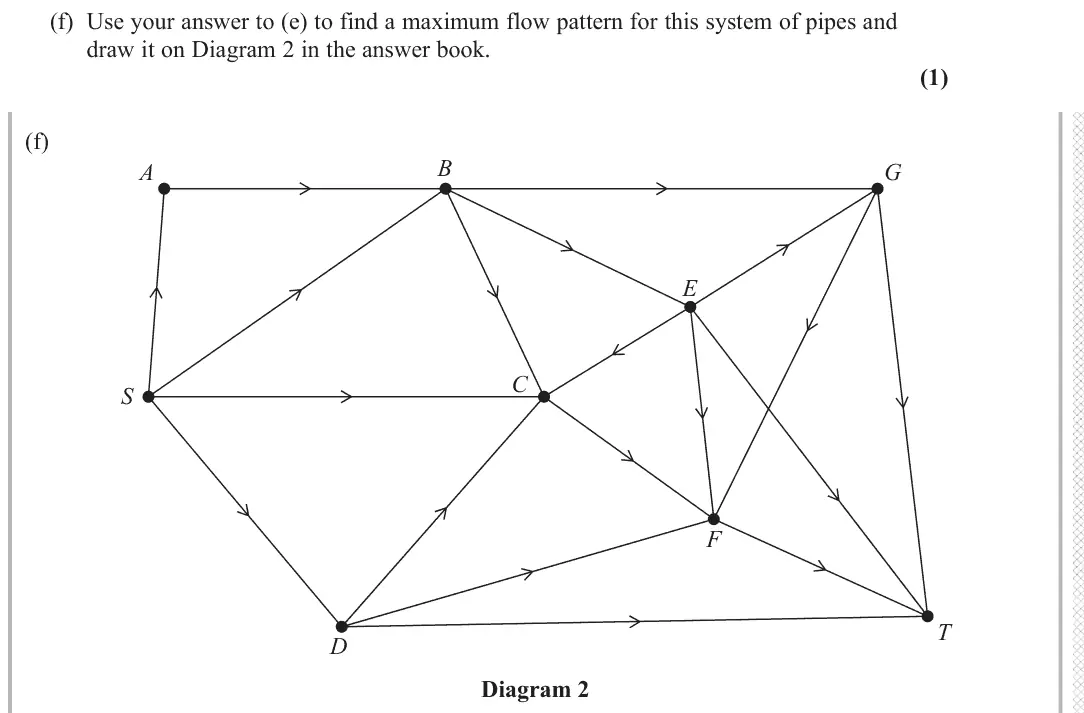
Nov 2021 · Paper 4D (Decision 2) · Q5(f)1 mark
Mark scheme (whole question; this part is marked with the orange bar)
Key points from the mark scheme and examiner's report
flow of 43 with one number per arc, consistent at every vertex and within bounds
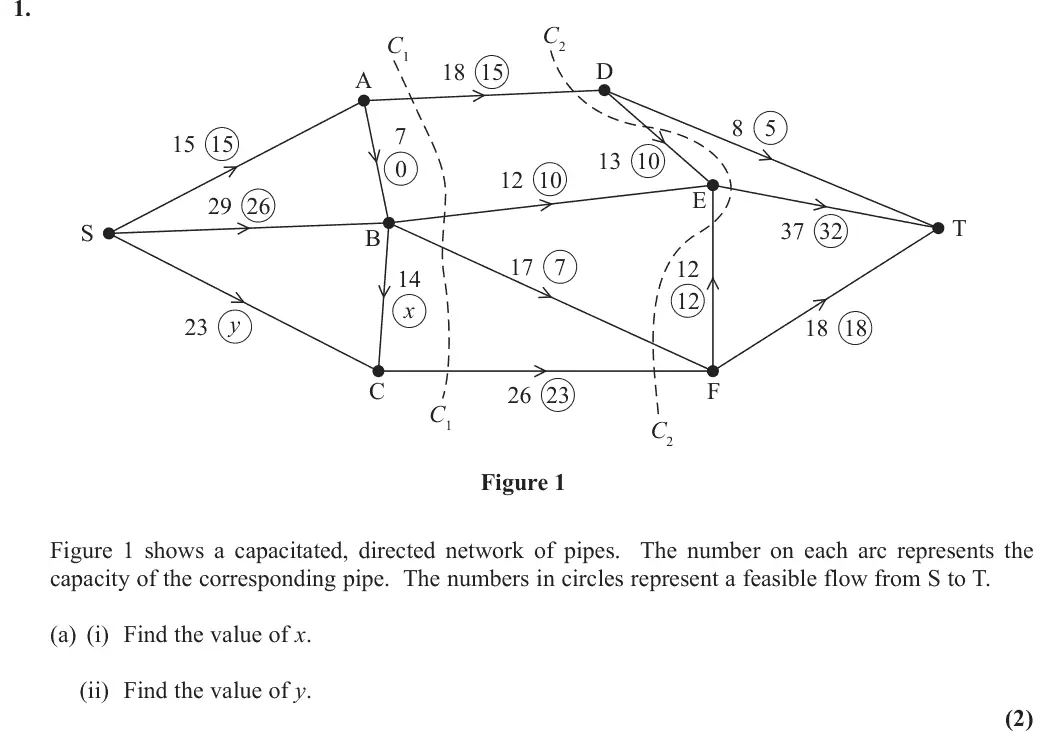
Oct 2020 · AS Paper 2 (Decision 2) · Q1(a)2 marks
Mark scheme (whole question; this part is marked with the orange bar)
Key points from the mark scheme and examiner's report
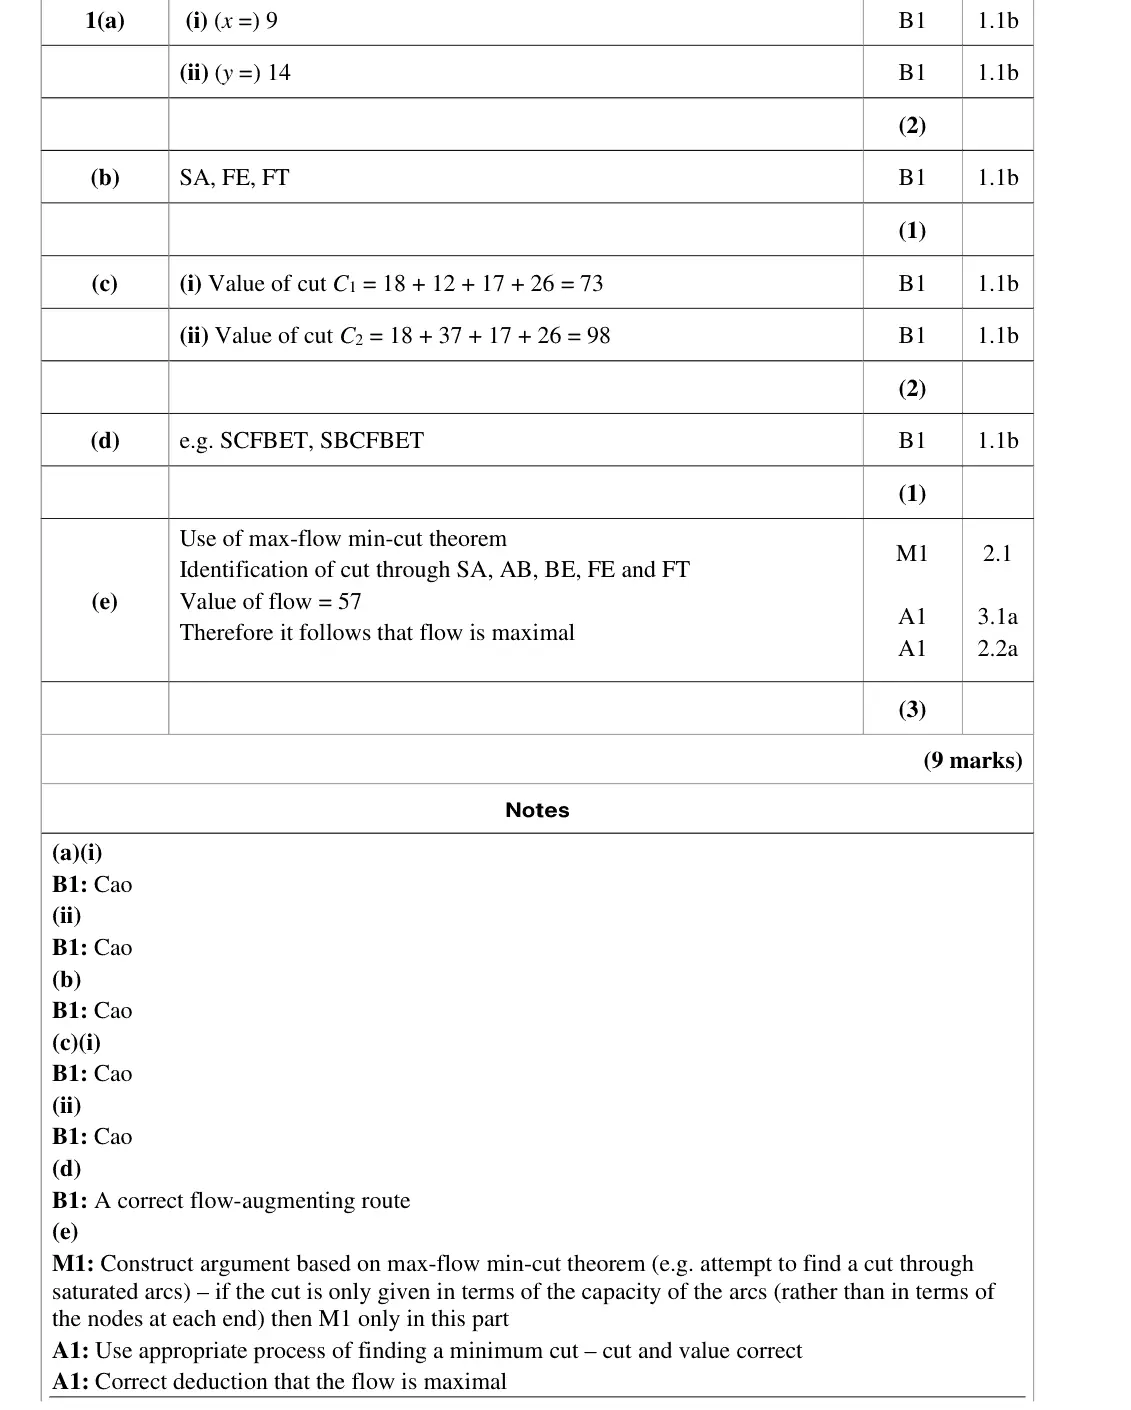
flow in = flow out at each vertex: x = 9, y = 14
Oct 2020 · AS Paper 2 (Decision 2) · Q1(b)1 mark
Mark scheme (whole question; this part is marked with the orange bar)
Key points from the mark scheme and examiner's report
saturated arcs SA, FE, FT (flow equals capacity)
Oct 2020 · AS Paper 2 (Decision 2) · Q1(d)1 mark
Mark scheme (whole question; this part is marked with the orange bar)
Key points from the mark scheme and examiner's report
a route using CF with spare capacity 2 along every forward arc and backflow on BF, e.g. SCFBET
June 2019 · AS Paper 2 (Decision 2) · Q3(a)1 mark
Mark scheme (whole question; this part is marked with the orange bar)
Examiner's comment
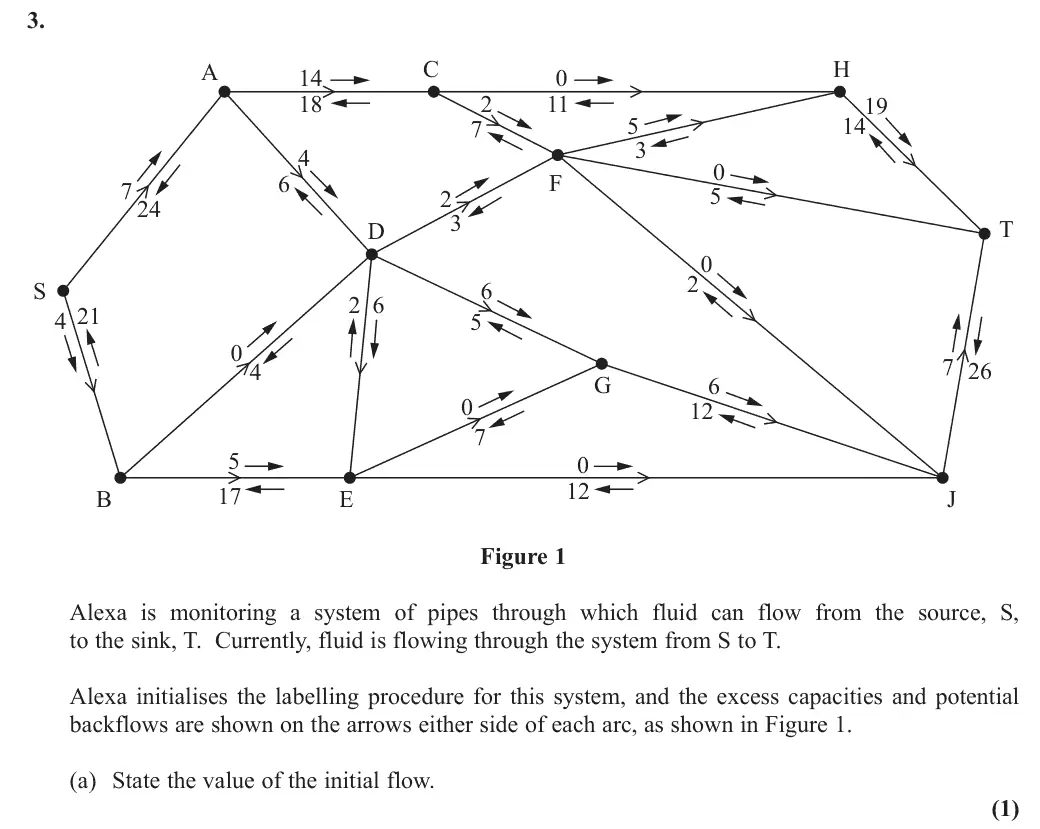
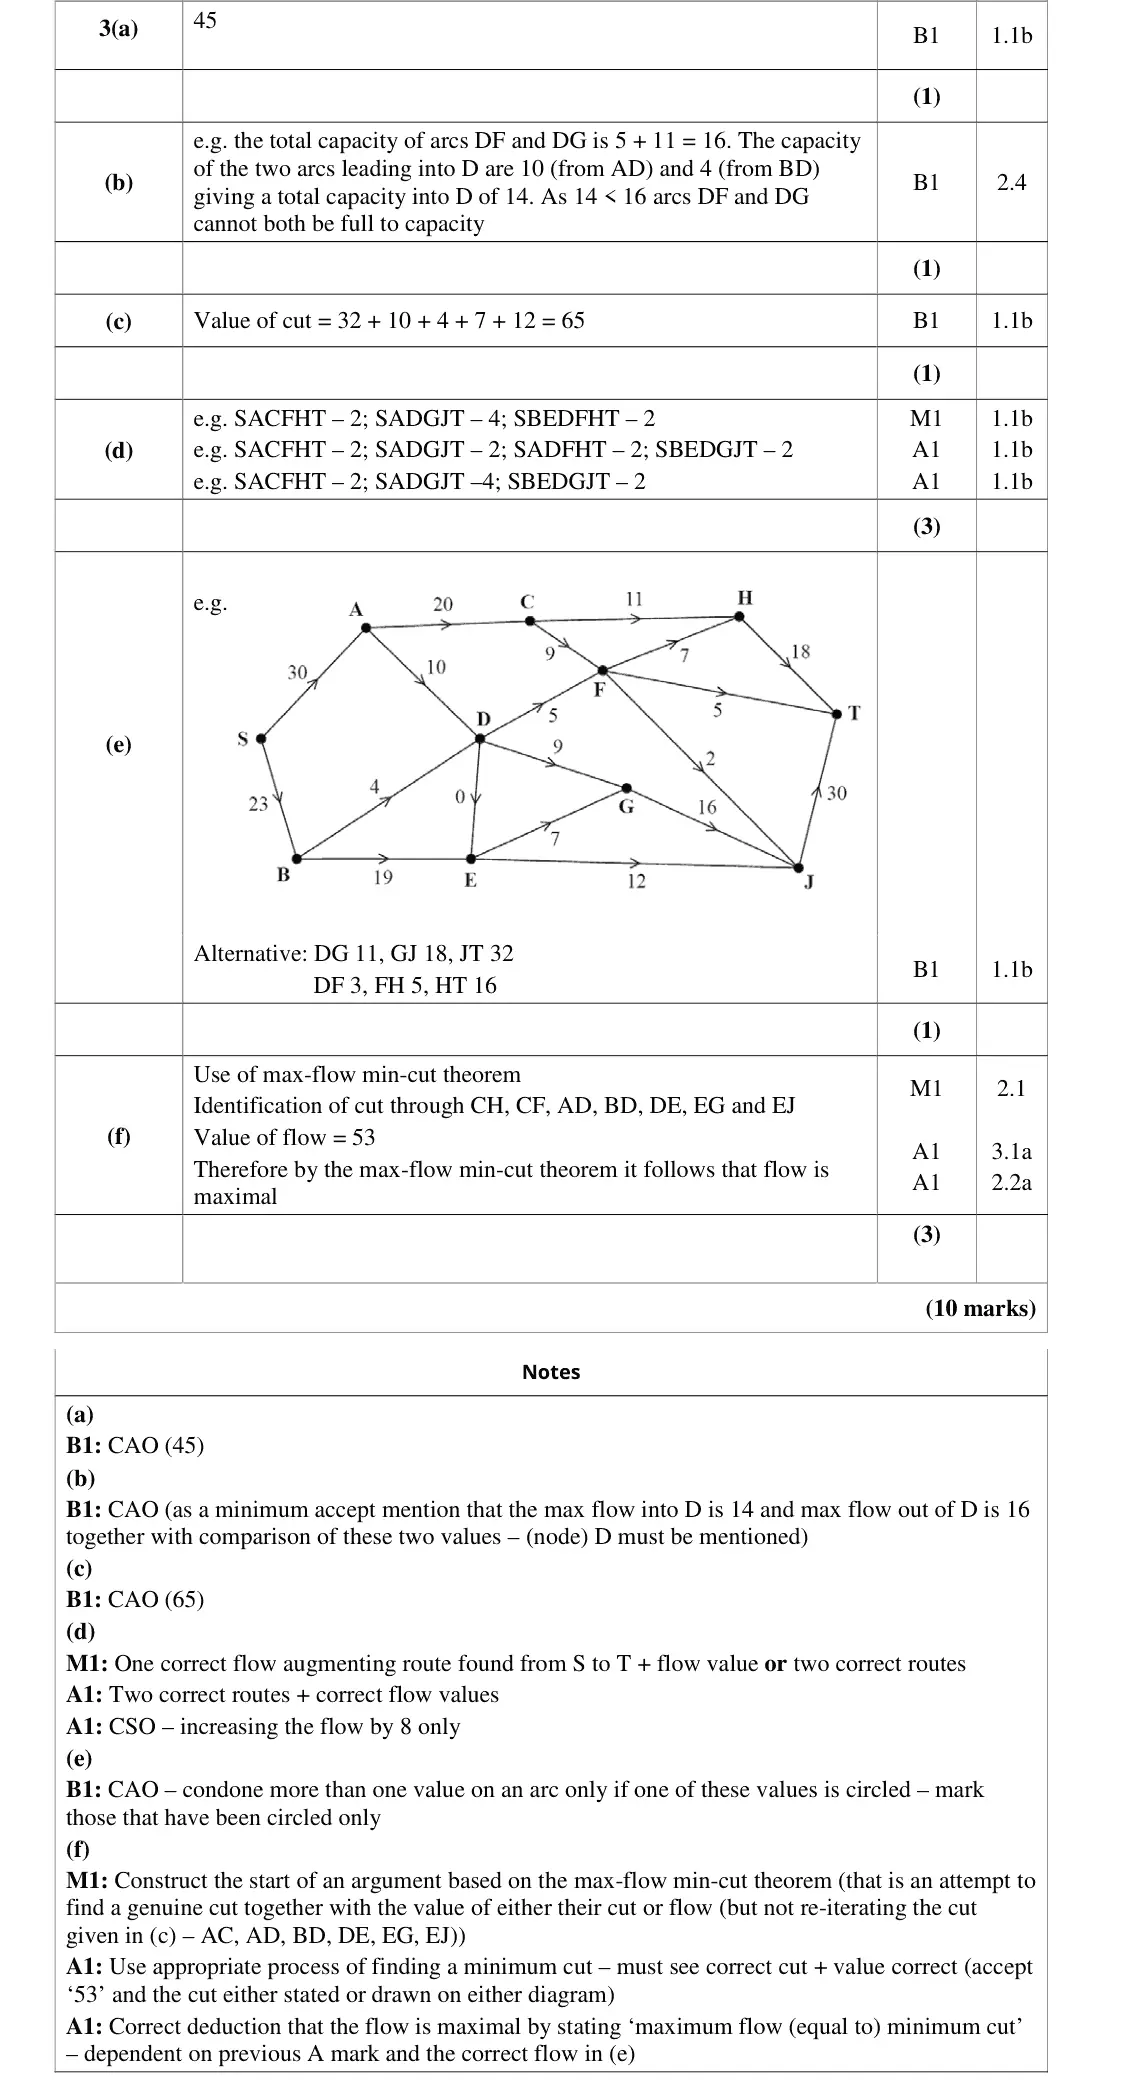
In part (a) nearly all candidates correctly stated the initial flow as 45.
Key points from the mark scheme and examiner's report
initial flow 45 (sum of potential backflows on arcs into T, or out of S)
June 2019 · AS Paper 2 (Decision 2) · Q3(d)3 marks
Mark scheme (whole question; this part is marked with the orange bar)
Examiner's comment
Most candidates could correctly apply the labelling procedure in part (d) to find at least two correct flow-augmenting routes (and corresponding flows) but not all managed to increase the flow by the correct amount of 8 (and some surprisingly managed to increase the flow to 10).
Key points from the mark scheme and examiner's report
list routes with flows, e.g. SACFHT 2, SADGJT 4, SBEDGJT 2
the flow increases by exactly 8 to 53
some augmented by 10
June 2019 · AS Paper 2 (Decision 2) · Q3(e)1 mark
Mark scheme (whole question; this part is marked with the orange bar)
Examiner's comment
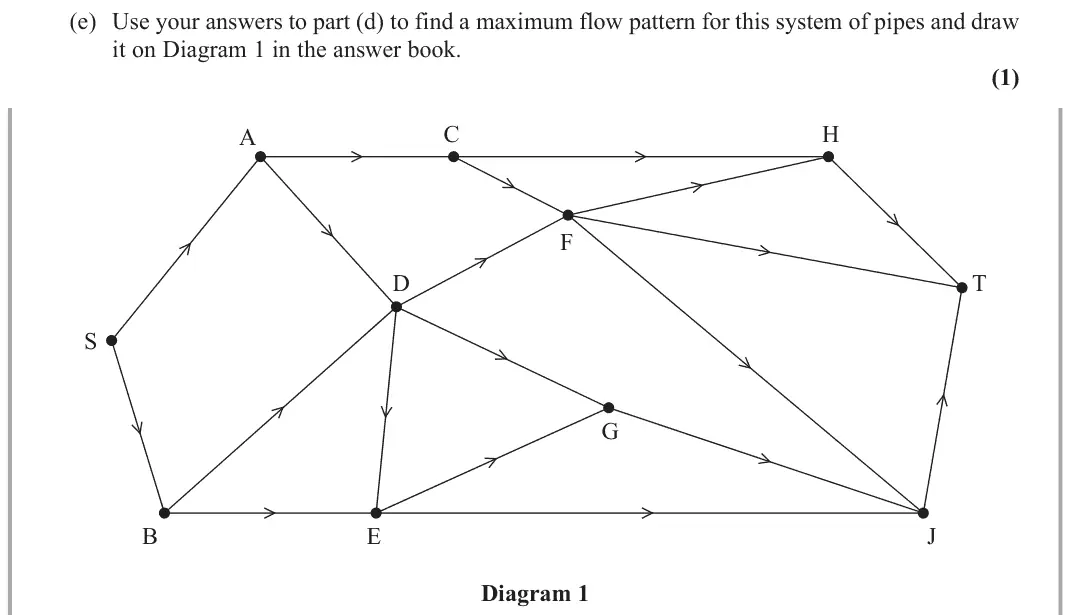
In part (e) candidates are reminded of the following two points when showing a flow on a diagram. There should only be one number on each arc and all arcs should be assigned a value (even if this value is zero). Both points were condoned by examiners this series, but this may not be so in the future. State the value of the flow through the network after augmentation and what this implied about the maximum flow e.g. the current flow through the network is 53 which implies that the maximum flow is 53 Conclude the proof by referring to the maximum flow-minimum cut theorem e.g. the min. cut is 53 and the max. flow is 53 but by the maximum flow-minimum cut theorem the max. flow is equal to min. cut therefore the maximum flow is 53 and therefore the flow in part (e) is indeed optimal.
Key points from the mark scheme and examiner's report
flow of 53 on Diagram 1
one number on every arc, including zeros
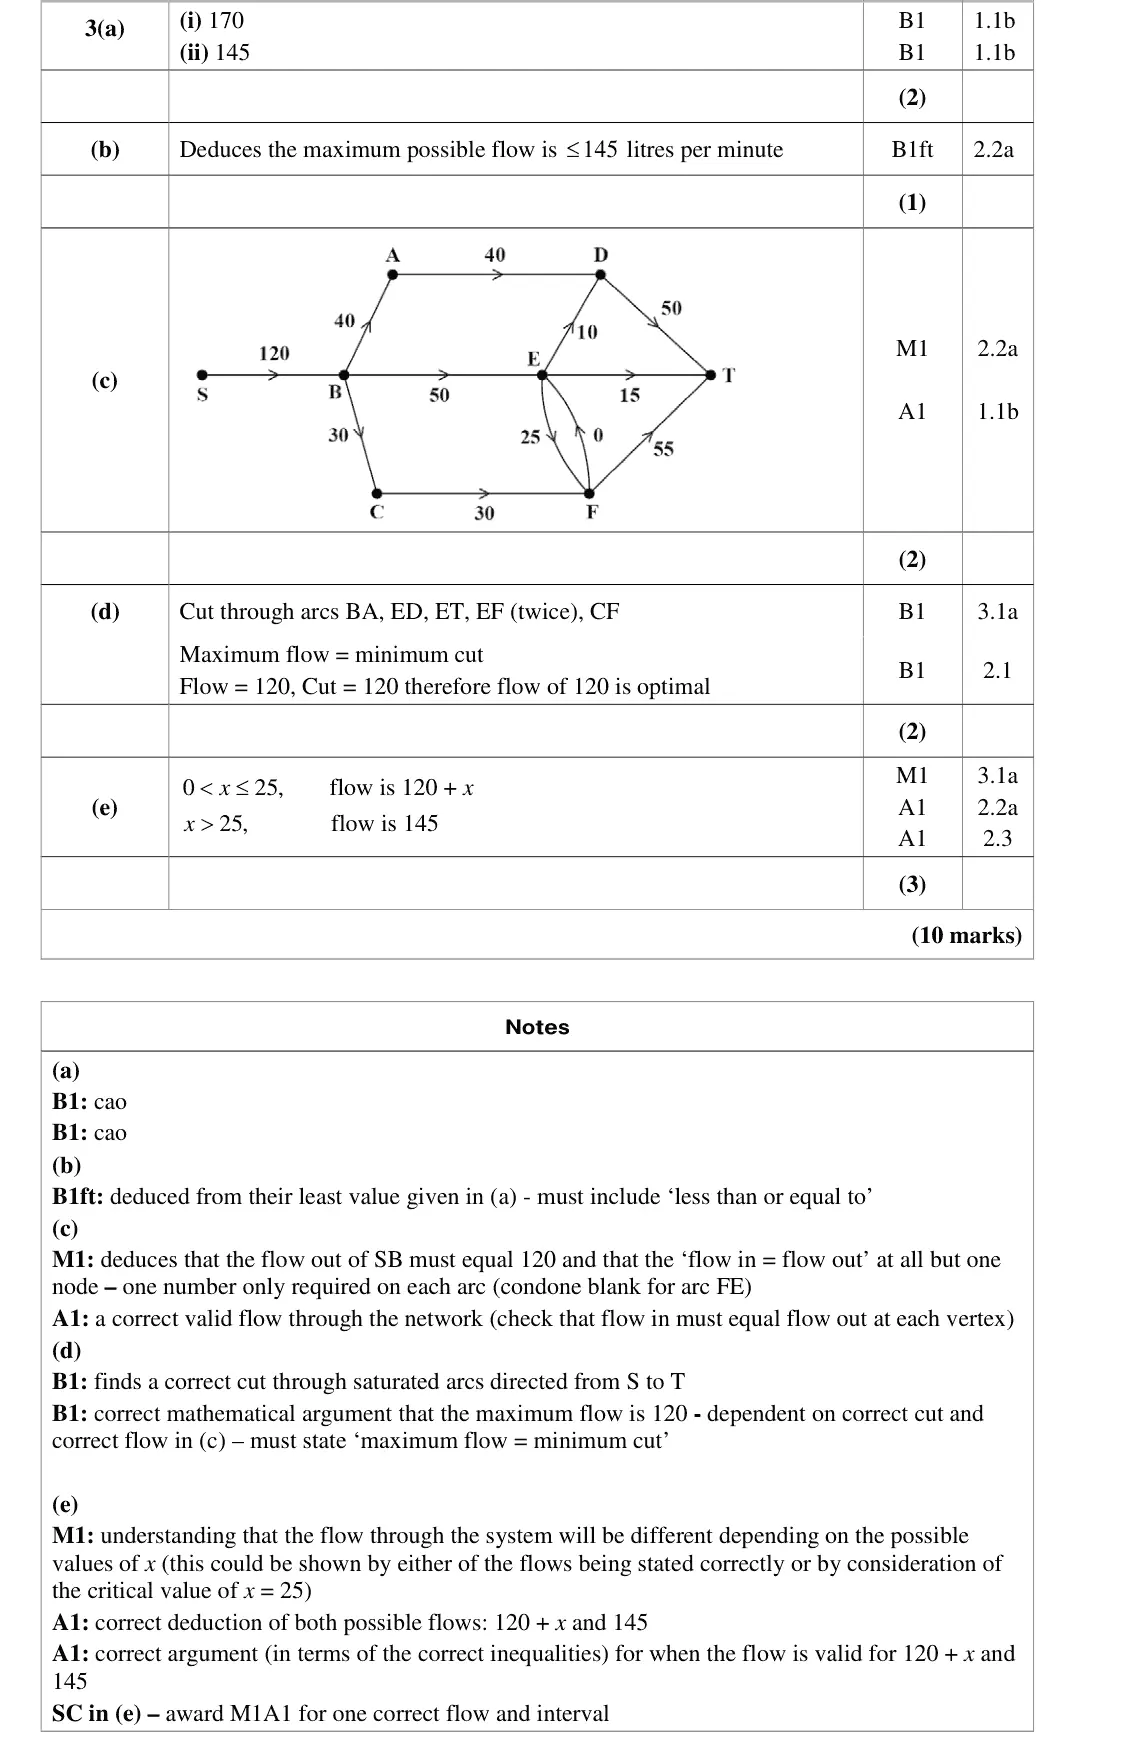
June 2018 · AS Paper 2 (Decision 2) · Q3(c)2 marks
Mark scheme (whole question; this part is marked with the orange bar)
Examiner's comment
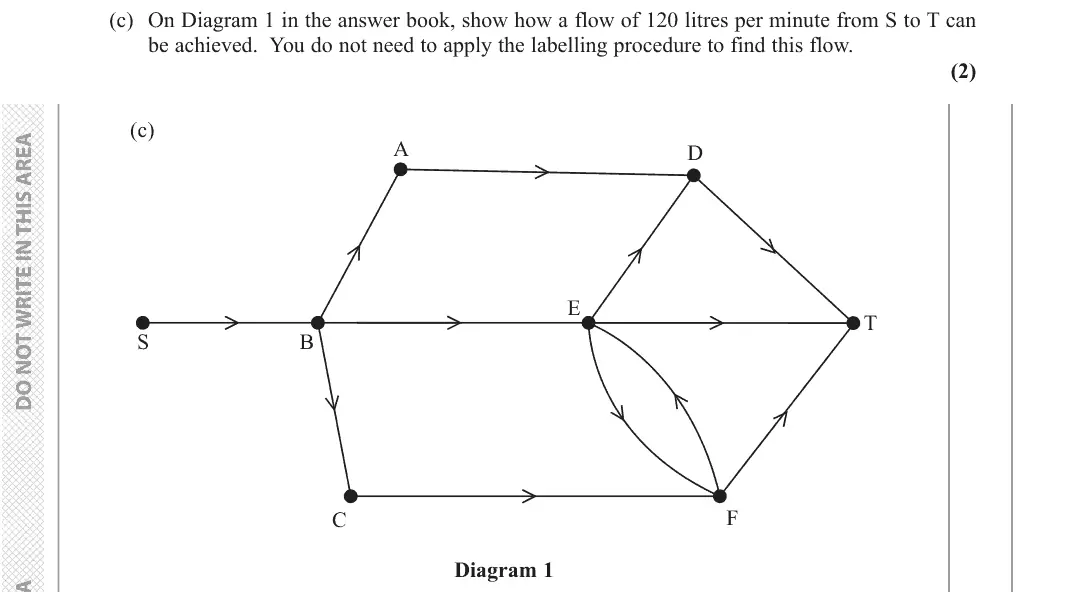
In part (a) nearly all students correctly calculated the value of both cuts with the most common error being the inclusion of the 30 (from arc FE) in the capacity of cut C2. In (b) most students realised that the maximum flow through the system was linked to the smaller of the two values found in (a) but many did not explicitly state that the maximum possible flow is less than or equal to 145 litres per minute. Even though (c) specifically told students that they did not have to apply the labelling procedure to find a flow of 120 litres per minute from S to T many still did so. Of those students that realised that 120 must flow along SB most went on to show a correct flow. Students are reminded of the following two points when showing a flow on a diagram. There should only be one number on each arc and all arcs should be assigned a value (even if this value is zero). Both of these points were condoned by examiners this session but this may not be so in the future. Part (e) discriminated well and while many students correctly deduced one of the two maximum possible flows through the system very few could give both flows together with the corresponding range of possible values of x.
Key points from the mark scheme and examiner's report
120 must flow along SB with flow in = flow out at every vertex
no labelling procedure needed though many used it anyway
Find an Edexcel Further Maths tutor
Stuck on this? Book a trial lesson with our Further Maths tutor.