Mark scheme (whole question; this part is marked with the orange bar)
Examiner's comment
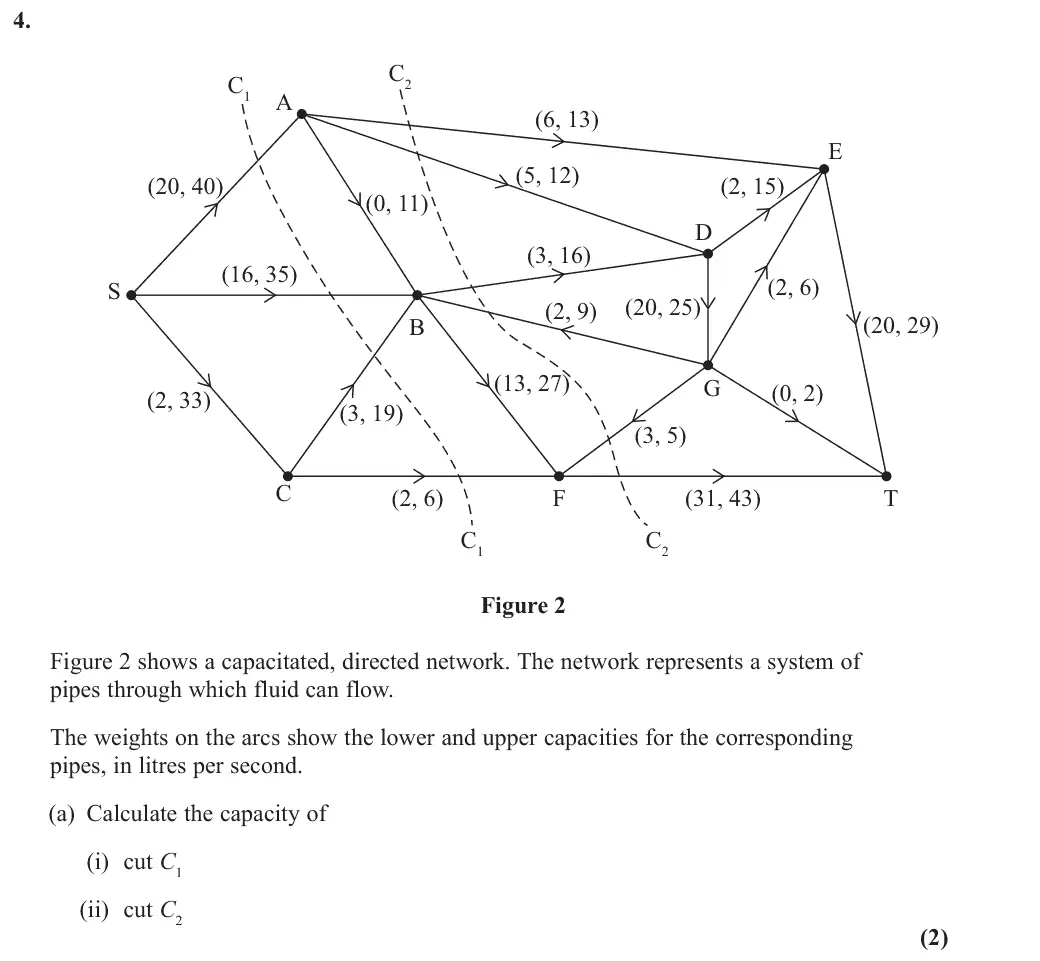
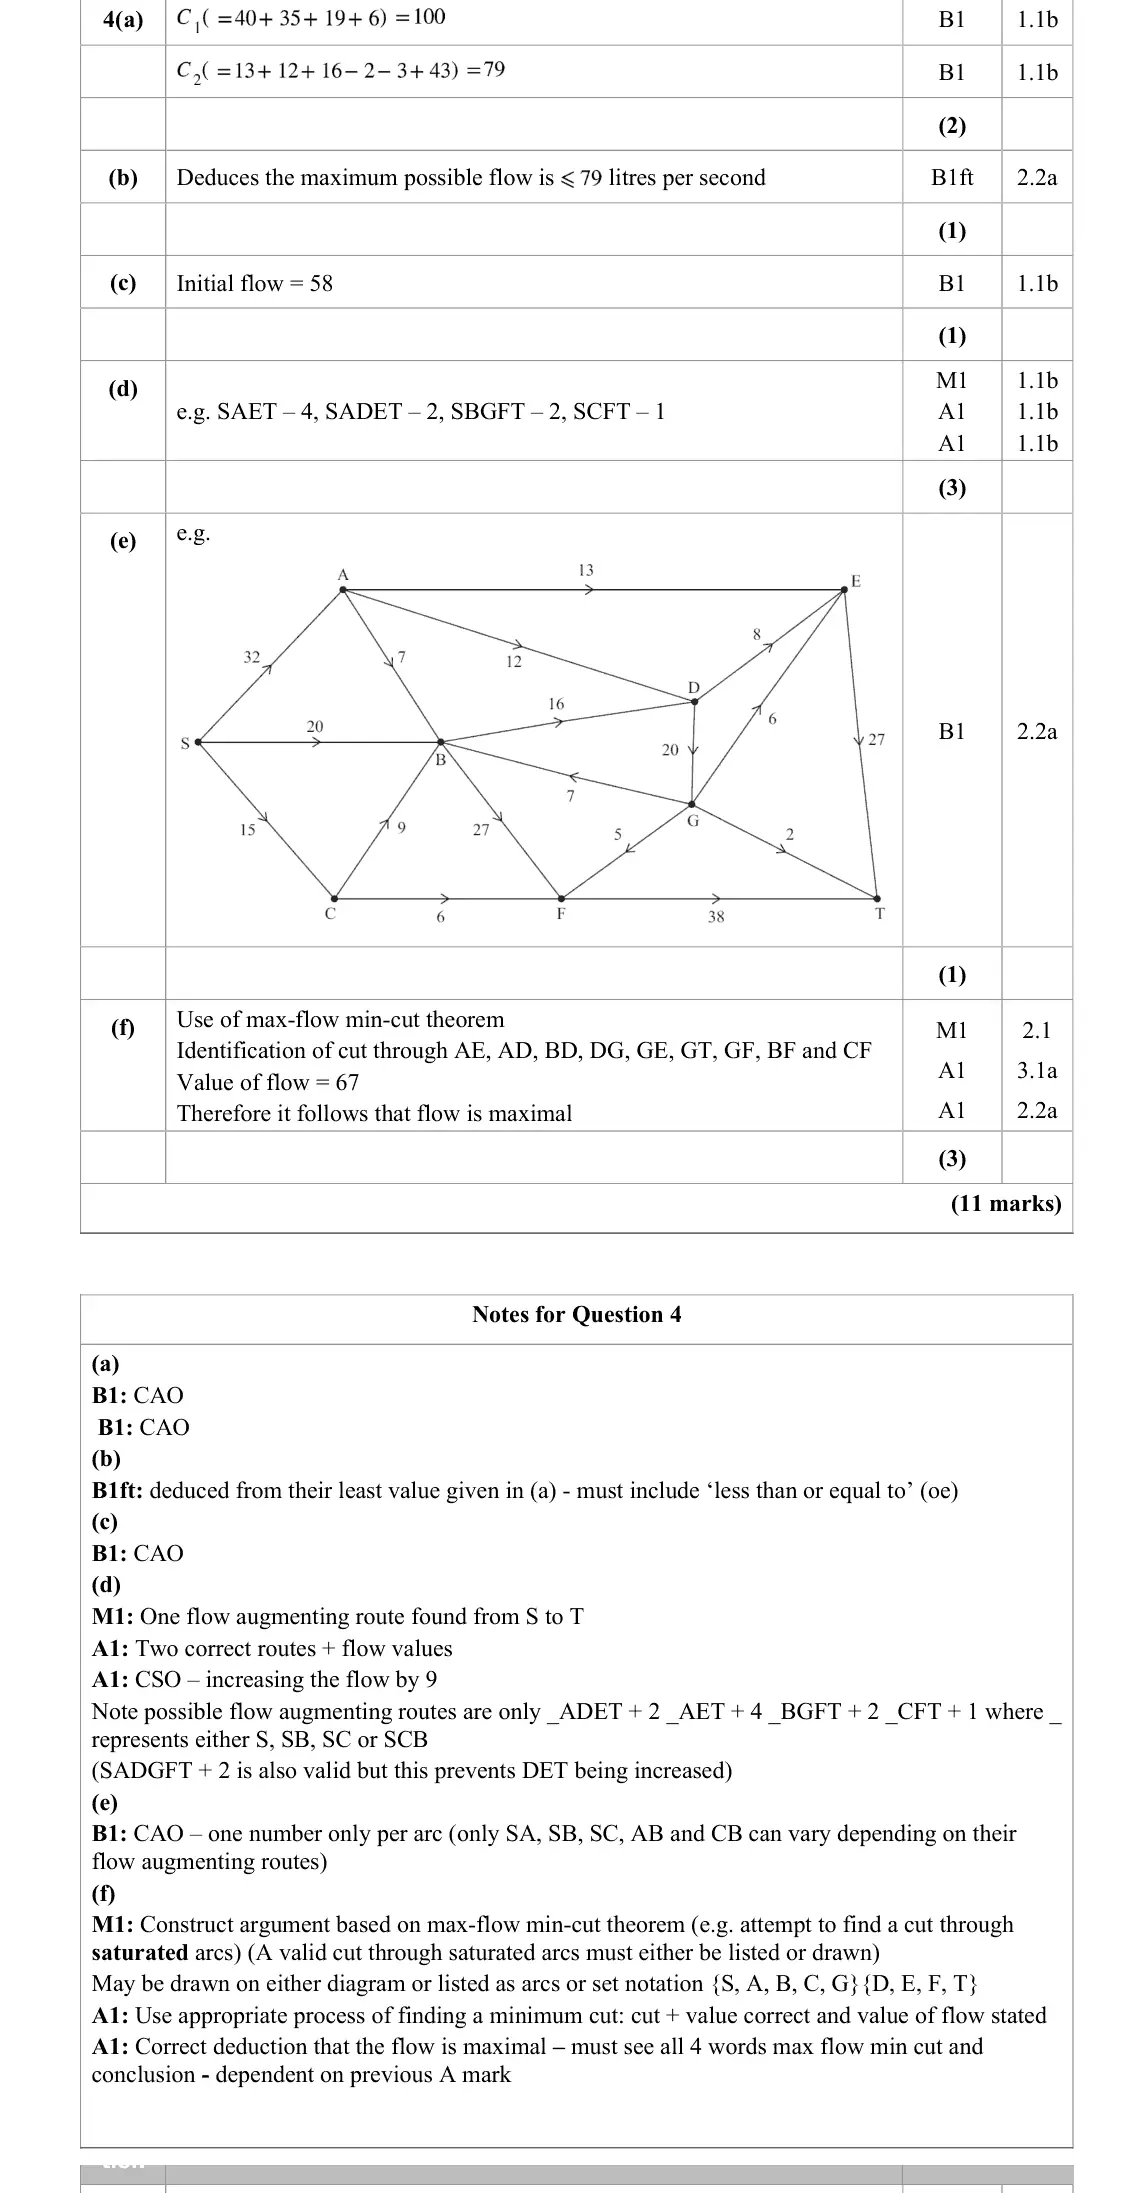
A significant number of candidates struggled to answer this question well. While a good number of candidates calculated the value of cut C1 correctly, many did not calculate C2 correctly. Most candidates related the maximum value of the flow to the smaller value of their cuts, but some incorrectly stated that it was equal to this, rather than less than or equal to the value. Some candidates were able to deduce the value of the initial flow, but a significant number failed to do so. Most candidates were able to find at least two correct flow augmenting routes, although relatively few found all four and the correct final flow of 67. Very few candidates drew a correct final flow diagram and relatively few even attempted to prove that their flow was maximal. Of those that did attempt this, only some were able to build a complete argument that this was true.
Key points from the mark scheme and examiner's report
Mark scheme (whole question; this part is marked with the orange bar)
Examiner's comment
A significant number of candidates struggled to answer this question well. While a good number of candidates calculated the value of cut C1 correctly, many did not calculate C2 correctly. Most candidates related the maximum value of the flow to the smaller value of their cuts, but some incorrectly stated that it was equal to this, rather than less than or equal to the value. Some candidates were able to deduce the value of the initial flow, but a significant number failed to do so. Most candidates were able to find at least two correct flow augmenting routes, although relatively few found all four and the correct final flow of 67. Very few candidates drew a correct final flow diagram and relatively few even attempted to prove that their flow was maximal. Of those that did attempt this, only some were able to build a complete argument that this was true.
Key points from the mark scheme and examiner's report
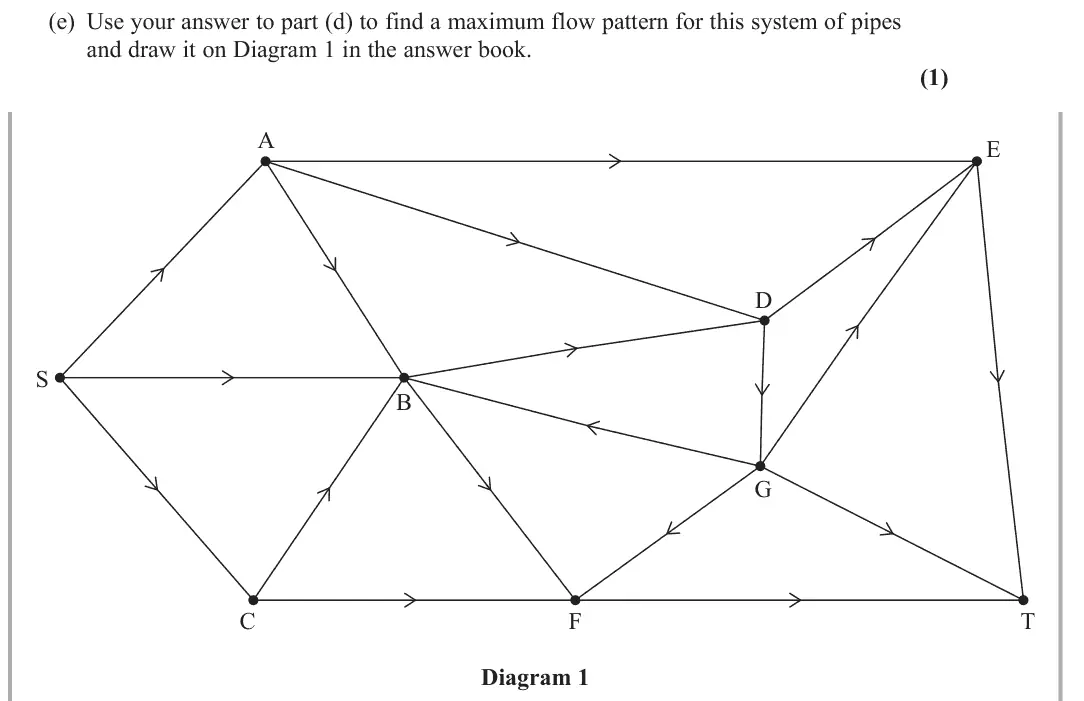
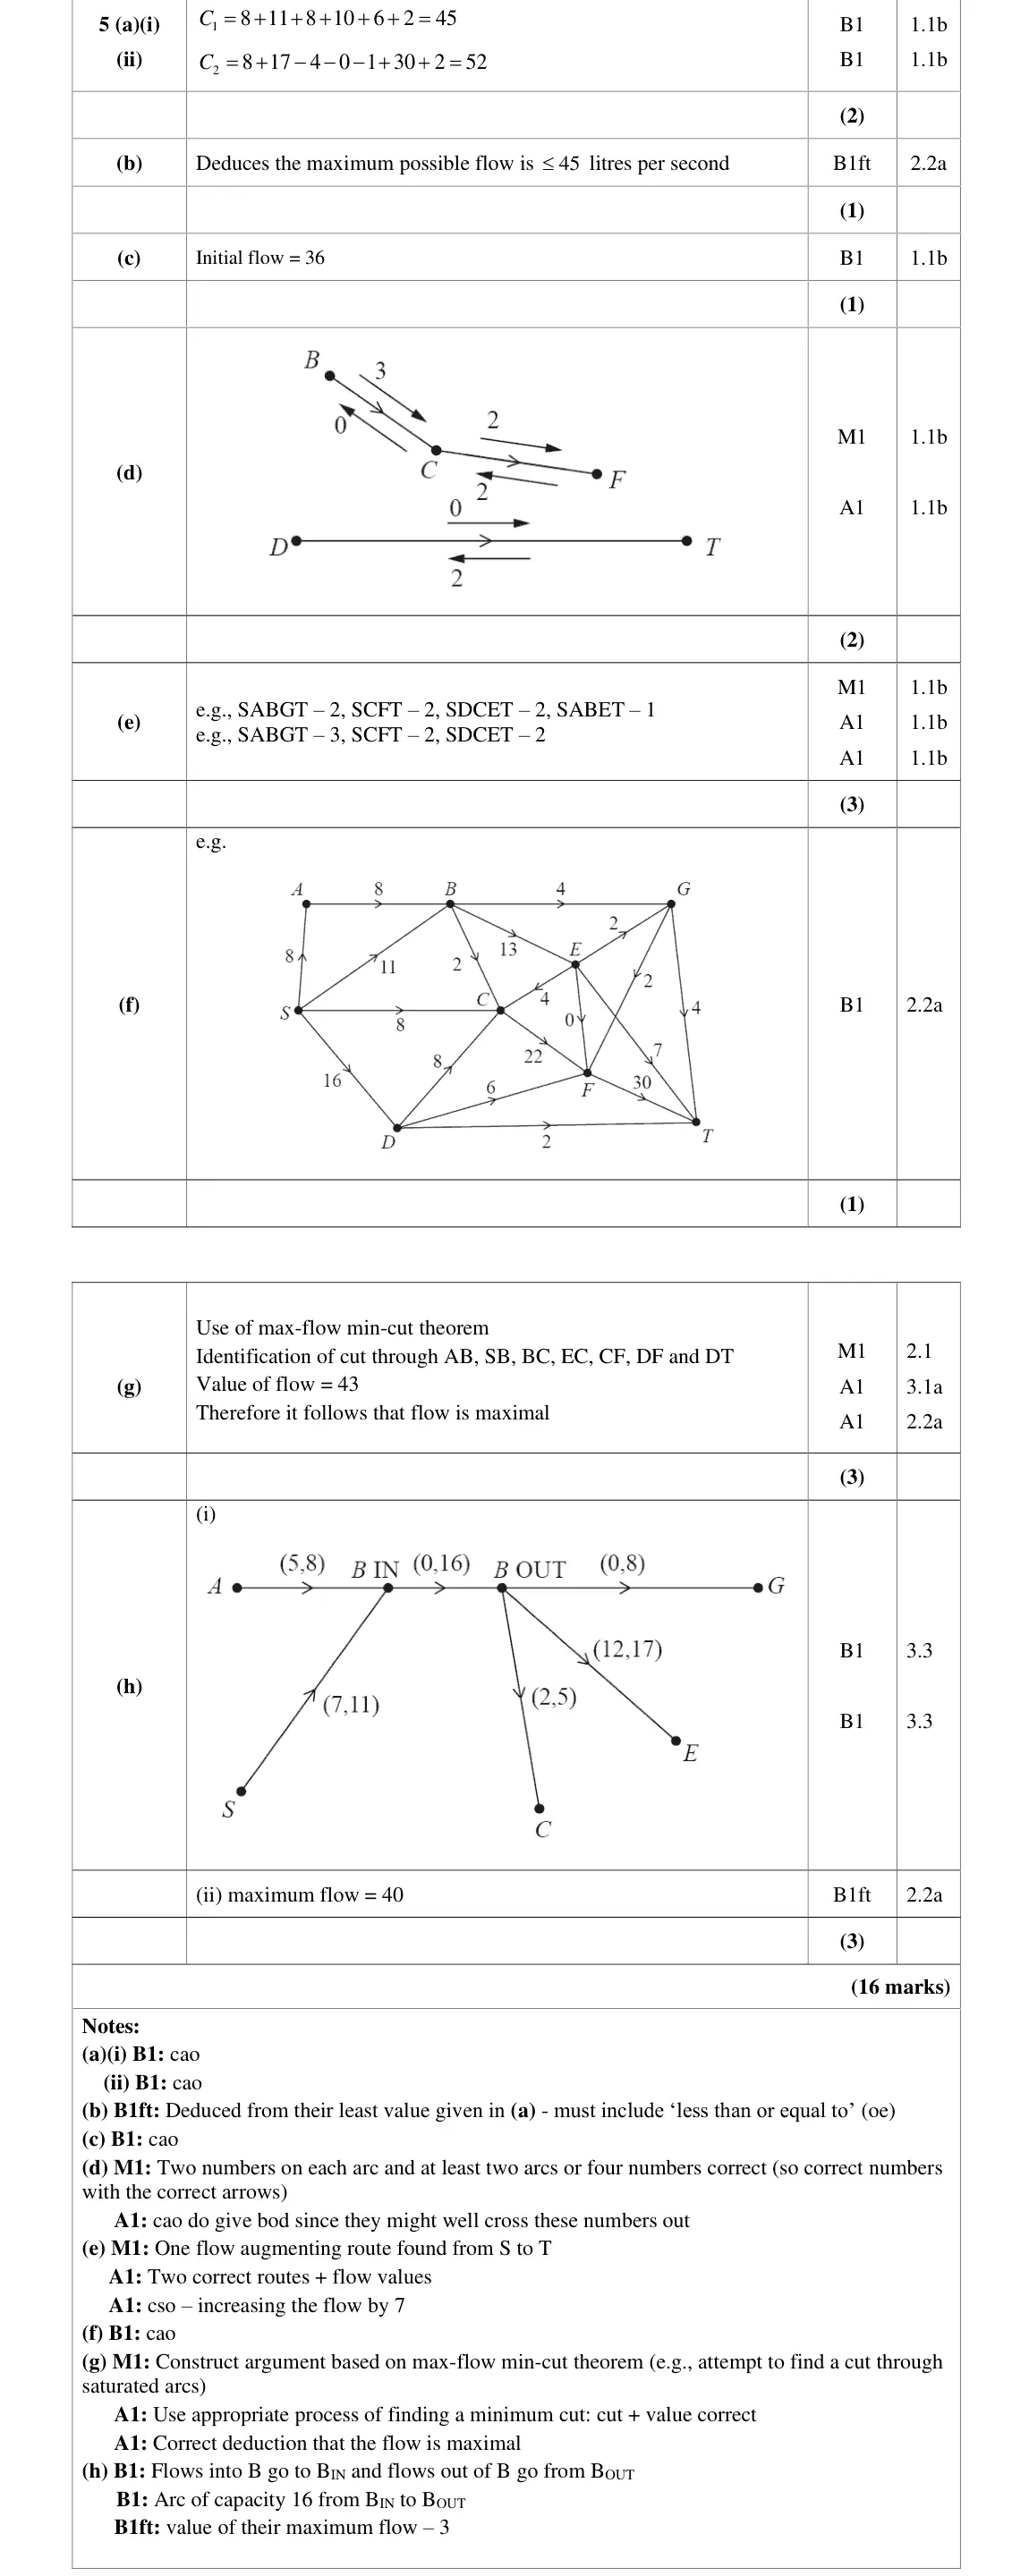
flow of 67, one number per arc, consistent at every vertex and within the (lower, upper) bounds
very few drew a correct diagram
June 2025 · Paper 4D (Decision 2) · Q4(f)3 marks
Mark scheme (whole question; this part is marked with the orange bar)
Examiner's comment
A significant number of candidates struggled to answer this question well. While a good number of candidates calculated the value of cut C1 correctly, many did not calculate C2 correctly. Most candidates related the maximum value of the flow to the smaller value of their cuts, but some incorrectly stated that it was equal to this, rather than less than or equal to the value. Some candidates were able to deduce the value of the initial flow, but a significant number failed to do so. Most candidates were able to find at least two correct flow augmenting routes, although relatively few found all four and the correct final flow of 67. Very few candidates drew a correct final flow diagram and relatively few even attempted to prove that their flow was maximal. Of those that did attempt this, only some were able to build a complete argument that this was true.
Key points from the mark scheme and examiner's report
max-flow min-cut theorem: cut through AE, AD, BD, DG, GE, GT, GF, BF, CF, i.e. {S, A, B, C, G} and {D, E, F, T}, capacity 67 = flow 67, so maximal
must use all four words max flow min cut
rarely attempted
Nov 2021 · Paper 4D (Decision 2) · Q5(a)2 marks
Mark scheme (whole question; this part is marked with the orange bar)
Key points from the mark scheme and examiner's report
Mark scheme (whole question; this part is marked with the orange bar)
Key points from the mark scheme and examiner's report
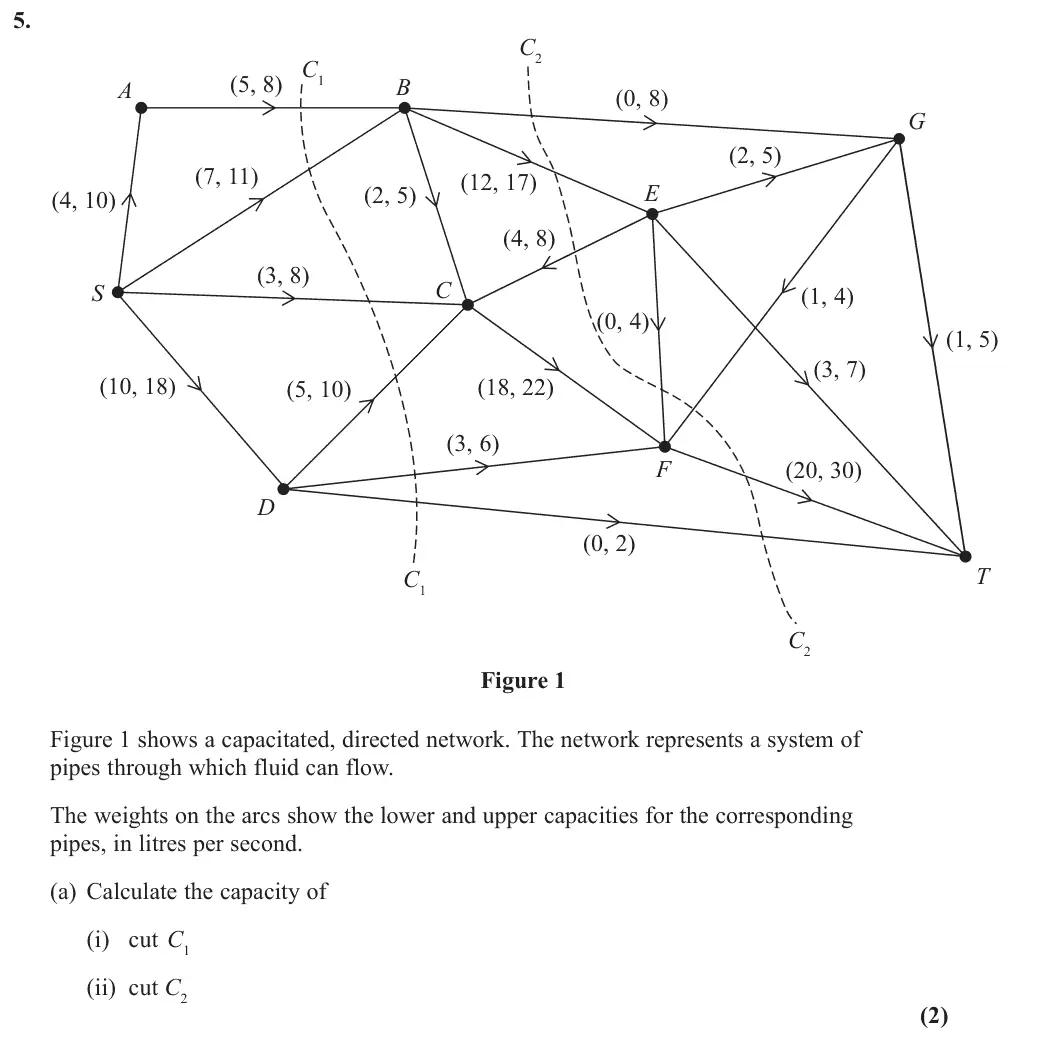
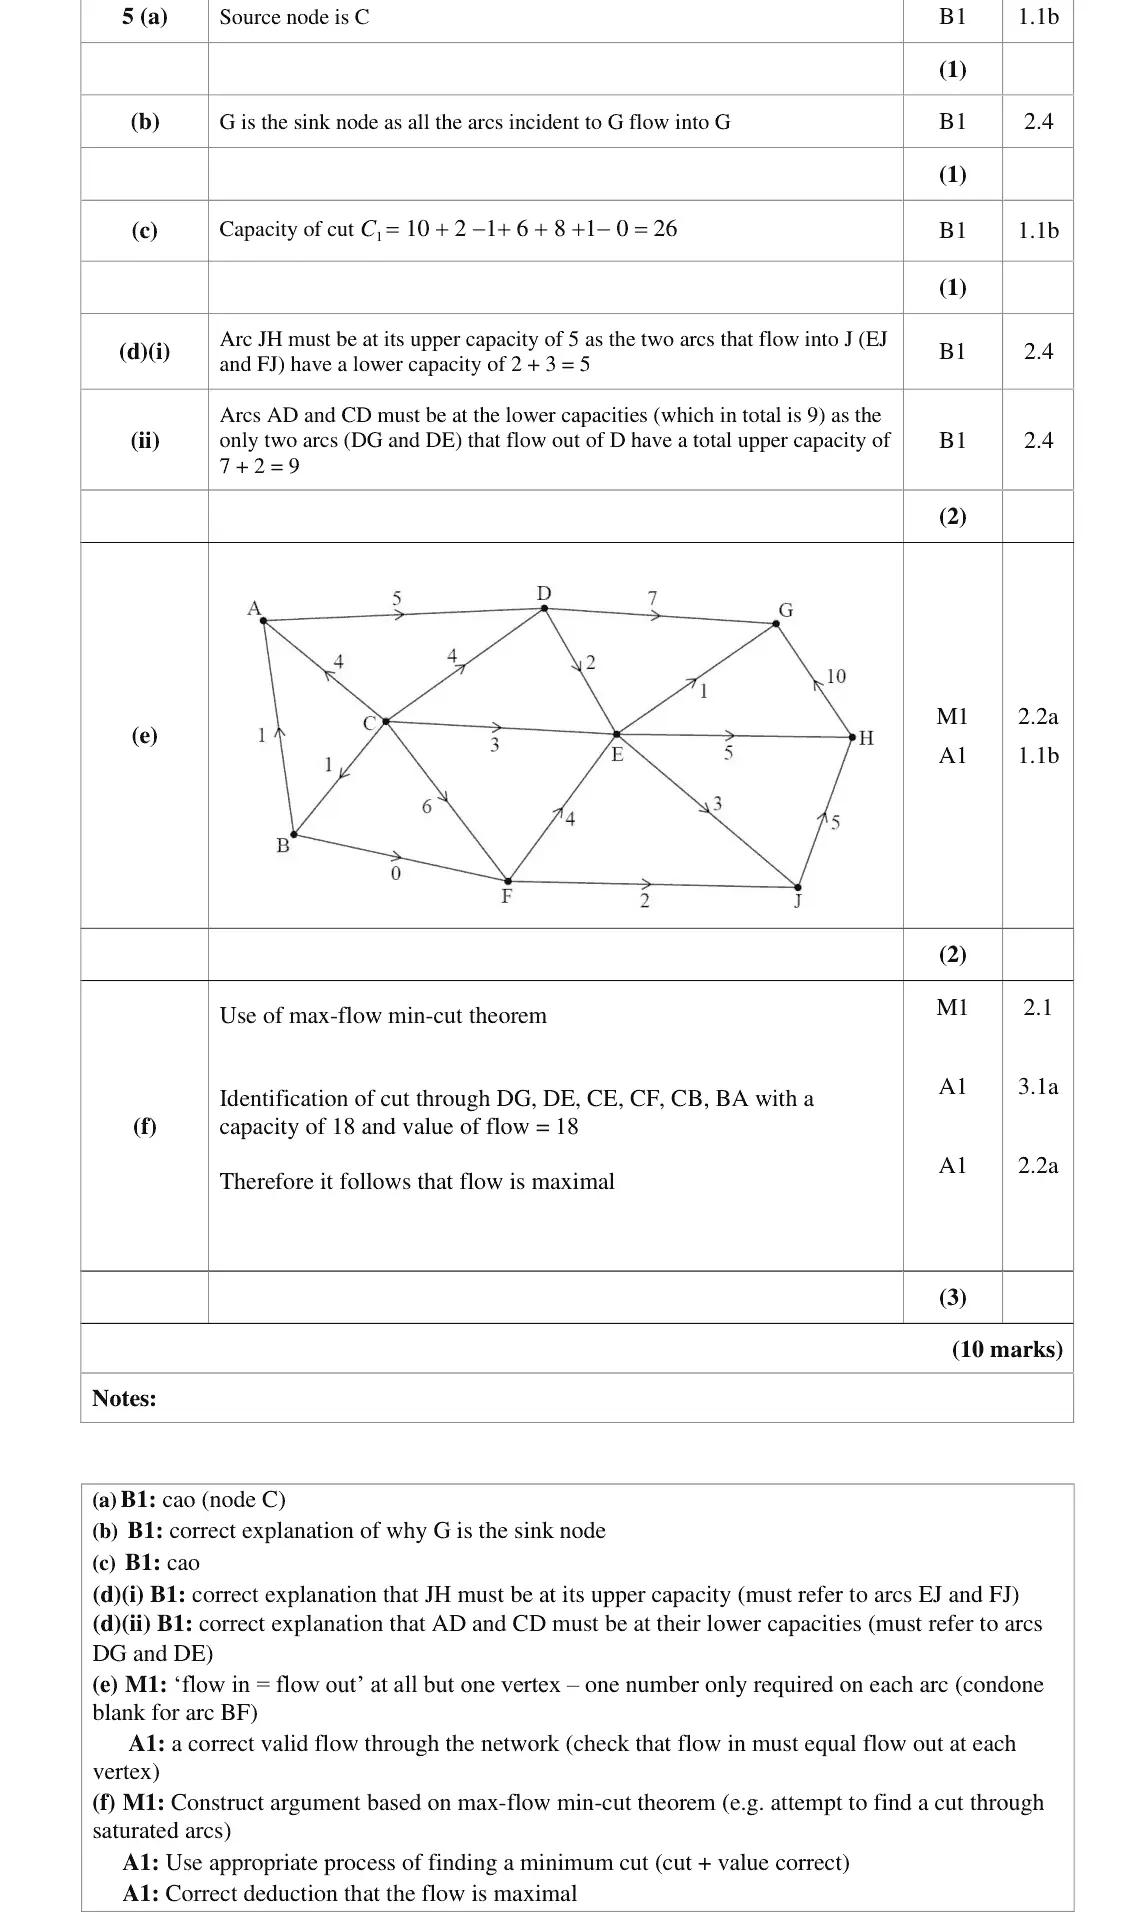
add upper capacities of arcs crossing from source side to sink side, subtract lower capacities of arcs crossing back: 10 + 2 − 1 + 6 + 8 + 1 − 0 = 26
Oct 2020 · Paper 4D (Decision 2) · Q5(d)2 marks
Mark scheme (whole question; this part is marked with the orange bar)
Key points from the mark scheme and examiner's report
(i) lower capacities into J (EJ, FJ) total 2 + 3 = 5 = upper capacity of JH
(ii) upper capacities out of D (DG, DE) total 7 + 2 = 9 = lower capacities of AD + CD
must name these arcs
Oct 2020 · Paper 4D (Decision 2) · Q5(e)2 marks
Mark scheme (whole question; this part is marked with the orange bar)
Key points from the mark scheme and examiner's report
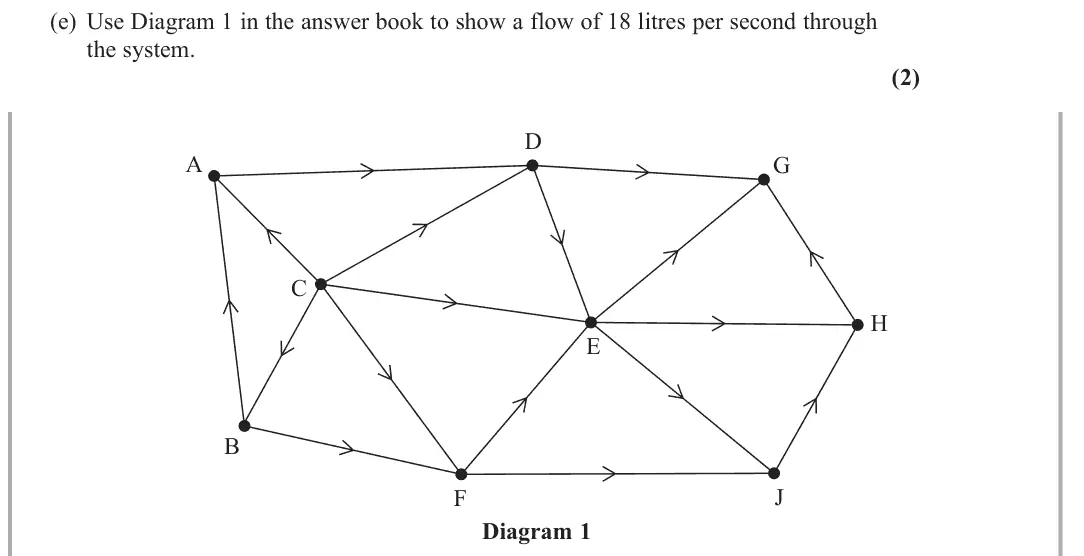
one number per arc, flow in = flow out at every vertex, all flows within the (lower, upper) bounds
Oct 2020 · Paper 4D (Decision 2) · Q5(f)3 marks
Mark scheme (whole question; this part is marked with the orange bar)
Key points from the mark scheme and examiner's report
max-flow min-cut theorem: cut through DG, DE, CE, CF, CB, BA has capacity 18 = flow, so maximal
June 2019 · Paper 4D (Decision 2) · Q6(a)2 marks
Mark scheme (whole question; this part is marked with the orange bar)
Examiner's comment
This question produced a mixture of responses. With a heavy problem solving and reasoning emphasis, it was found to be challenging by many candidates despite being a familiar area of the specification. Part (a) and (b) are very standard questions and as such were the most successful for candidates.
Key points from the mark scheme and examiner's report
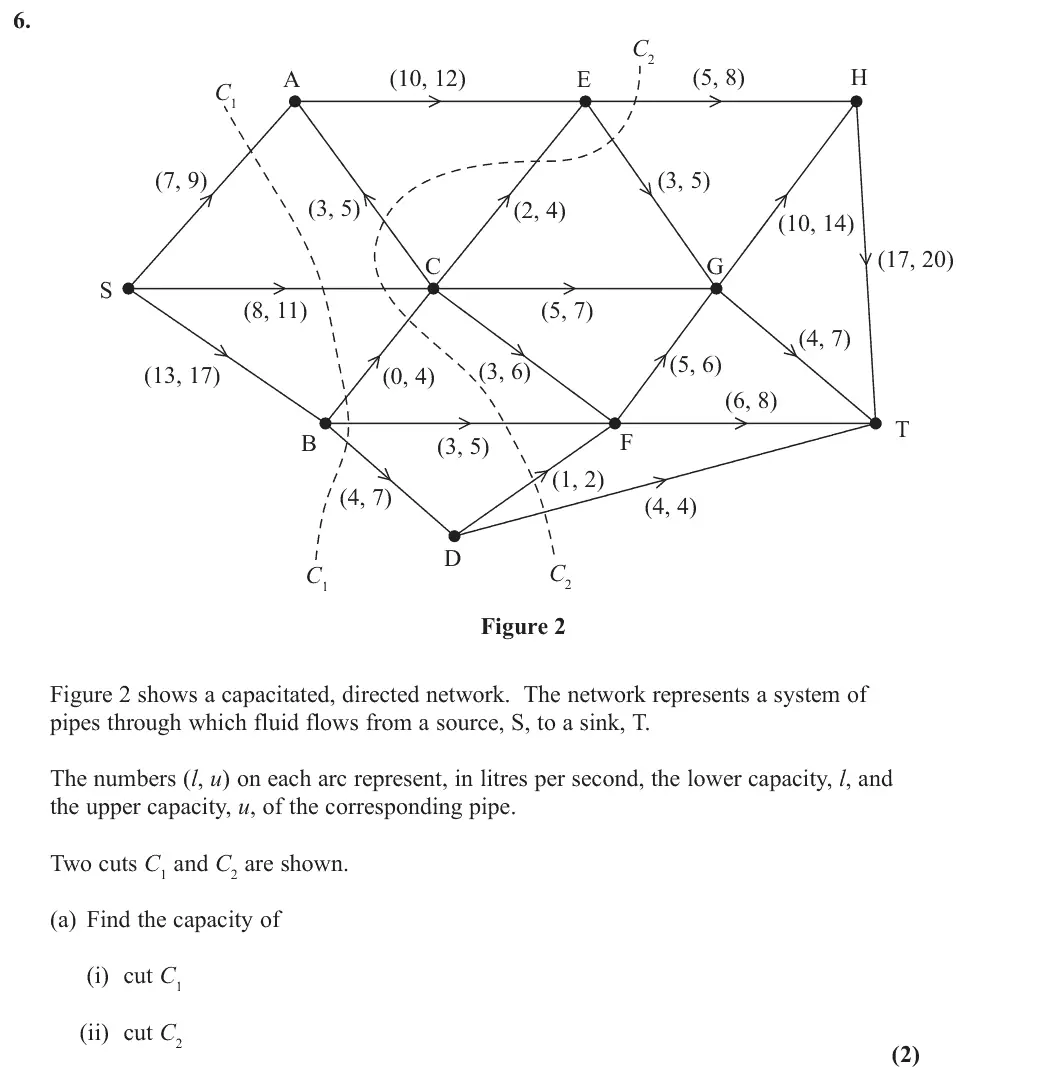
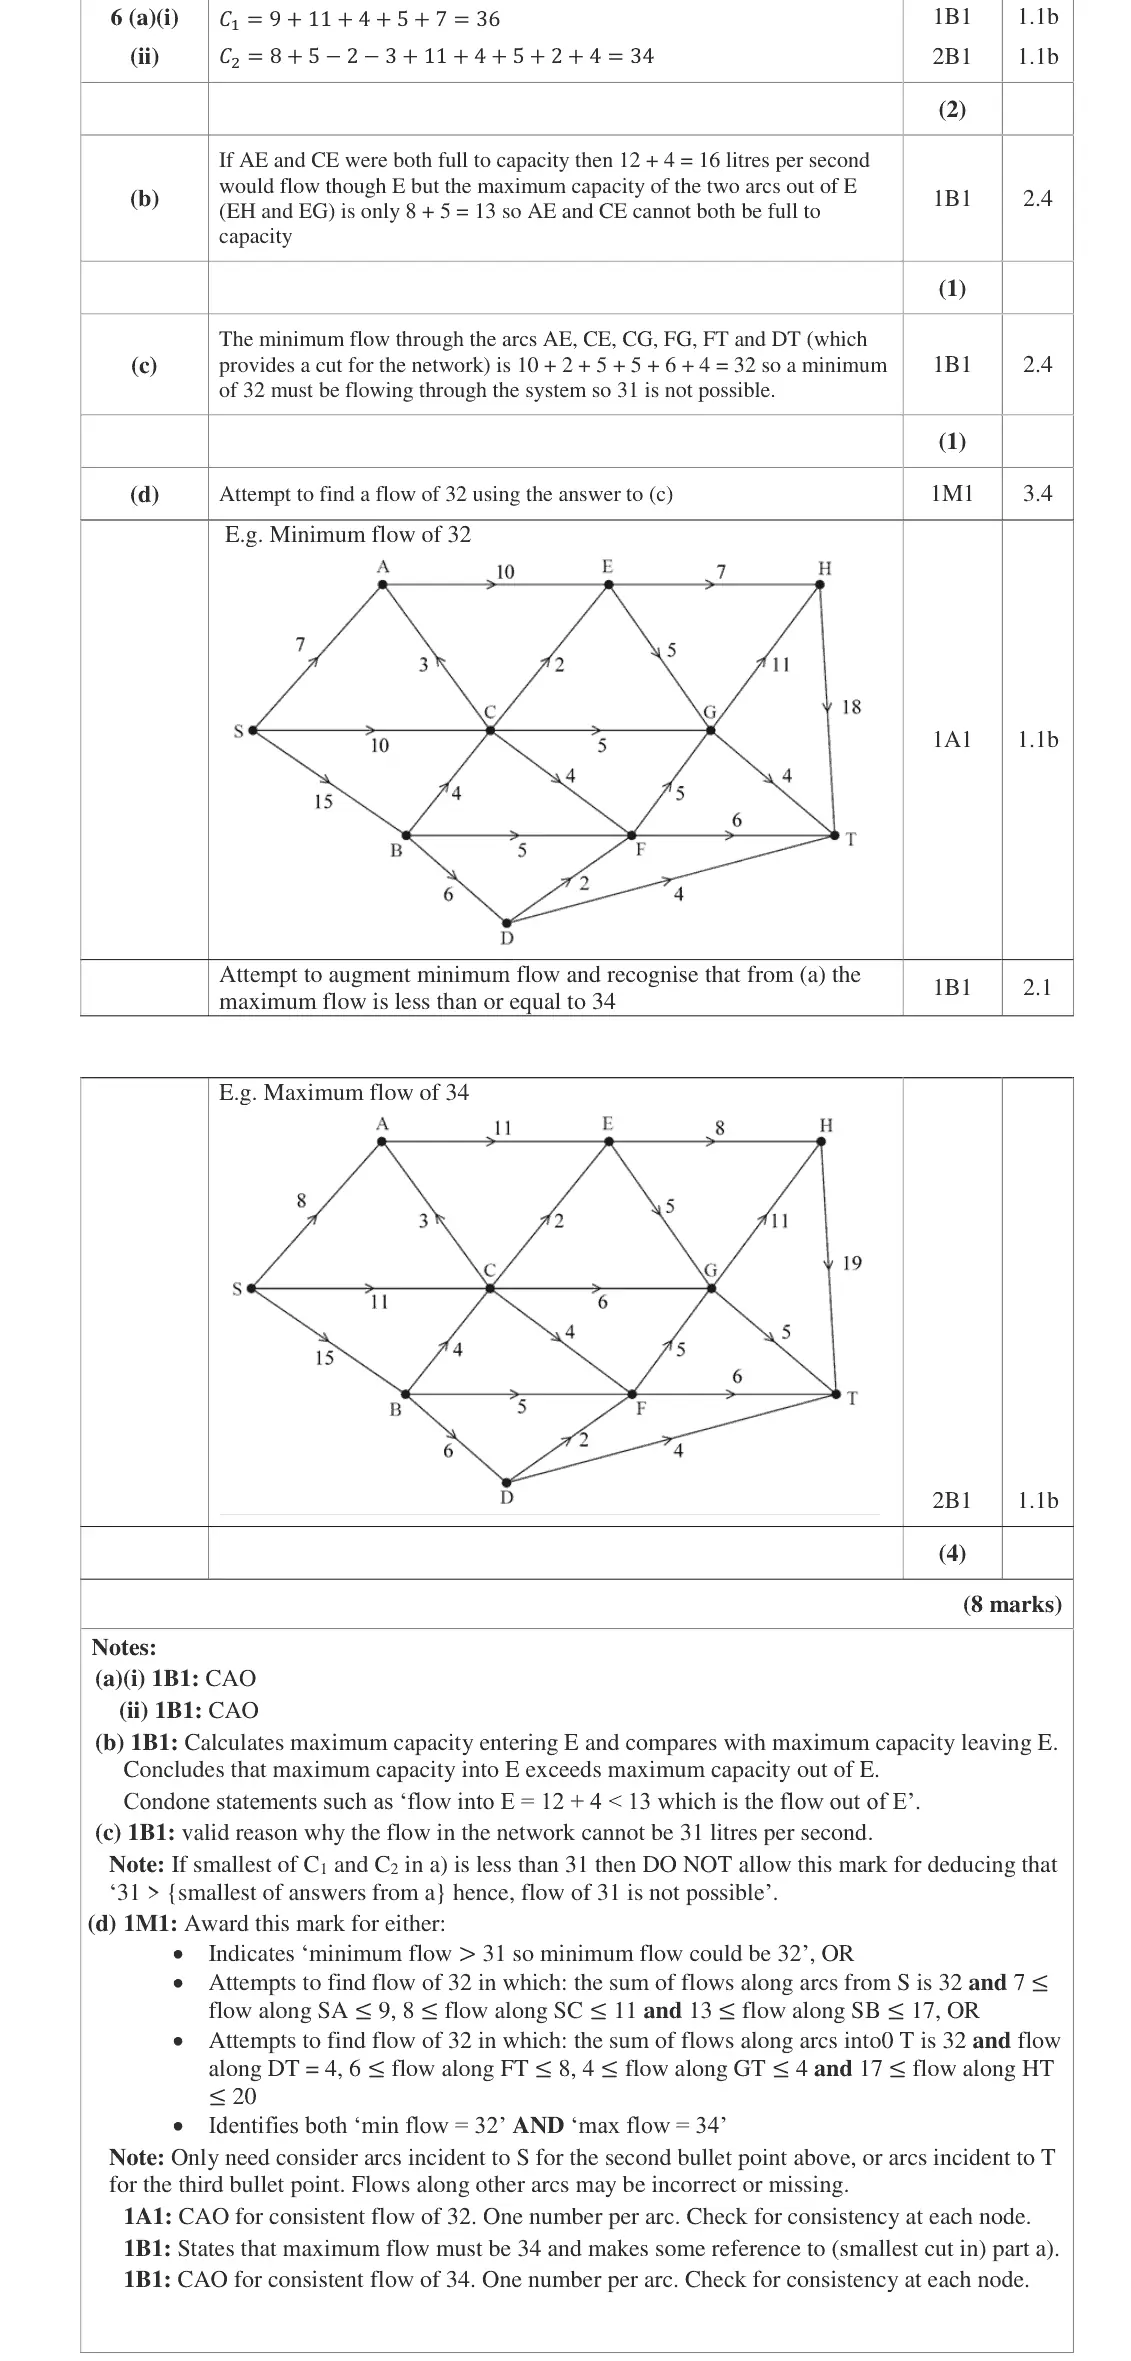
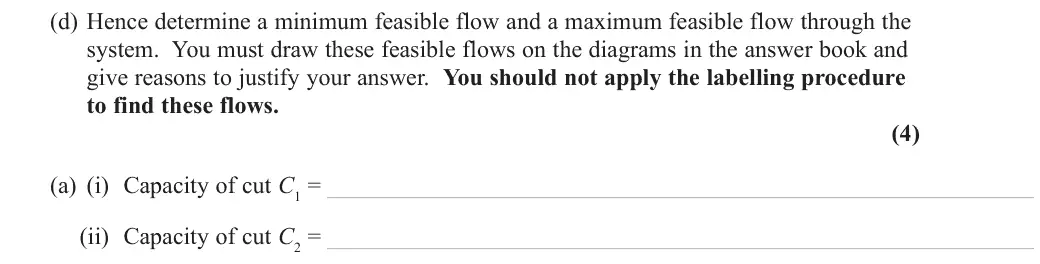
cut capacity = sum of upper capacities forward minus lower capacities of backward arcs: C1 = 36, C2 = 34
errors in (ii) were common
June 2019 · Paper 4D (Decision 2) · Q6(b)1 mark
Mark scheme (whole question; this part is marked with the orange bar)
Examiner's comment
This question produced a mixture of responses. With a heavy problem solving and reasoning emphasis, it was found to be challenging by many candidates despite being a familiar area of the specification. Part (a) and (b) are very standard questions and as such were the most successful for candidates. Nonetheless, the number of incorrect answers in (a) – particularly (a)(ii) was worrying at this level. Part (b) was almost always correct although some responses which focussed on only the maximum flow into E or the maximum flow out of E rather than comparing the two values were insufficient for the mark here.
Key points from the mark scheme and examiner's report
max into E is 12 + 4 = 16 but max out (EH + EG) is 8 + 5 = 13
must compare in and out, not just one
June 2019 · Paper 4D (Decision 2) · Q6(c)1 mark
Mark scheme (whole question; this part is marked with the orange bar)
Examiner's comment
This question produced a mixture of responses. With a heavy problem solving and reasoning emphasis, it was found to be challenging by many candidates despite being a familiar area of the specification. Part (c) was challenging and was often not attempted. Very few candidates correctly identified a cut of capacity 32 and deduced that a flow of 31 was not possible. Most candidates focussed instead on the flow into individual nodes or the flow at the source or sink and were unable to make progress.
Key points from the mark scheme and examiner's report
lower capacities across the cut AE, CE, CG, FG, FT, DT sum to 32 so at least 32 must flow
few found this, most looked at single nodes
June 2019 · Paper 4D (Decision 2) · Q6(d)4 marks
Mark scheme (whole question; this part is marked with the orange bar)
Examiner's comment
This question produced a mixture of responses. With a heavy problem solving and reasoning emphasis, it was found to be challenging by many candidates despite being a familiar area of the specification. Part (d) required a good understanding of flow in networks and required candidates to draw together their work in (a) and (c) to deduce the minimum and maximum flows. This was only very rarely achieved completely and indeed many candidates did not attempt this part of the question. However, a significant number of candidates that did were able to earn some marks for drawing consistent flows of 32 or 34 even if the justification for these flow values was missing. Unfortunately though, often the diagrams were left only partially complete or a number of errors were present such as multiple numbers on some (or all) of the arcs (even though, as in previous years, only a single number can be accepted on a flow diagram) and some candidates either left one arc blank or had an inconsistent flow pattern.
Key points from the mark scheme and examiner's report
minimum flow 32 by (c), maximum 34 since cut C2 = 34
draw consistent flows of 32 and 34 within lower and upper bounds, one number per arc
do not use labelling
often unattempted or diagrams incomplete
Find an Edexcel Further Maths tutor
Stuck on this? Book a trial lesson with our Further Maths tutor.