FS2.1.1 Least squares linear regression. The concept of residuals and…
Section
FS2.1 Linear Regression
Level
AS & A level
Statement
Least squares linear regression. The concept of residuals and minimising the sum of squares of residuals.
Guidance
Students should have an understanding of the process involved in linear regression. They should be able to calculate the regression coefficients for the equation y on x using standard formulae.
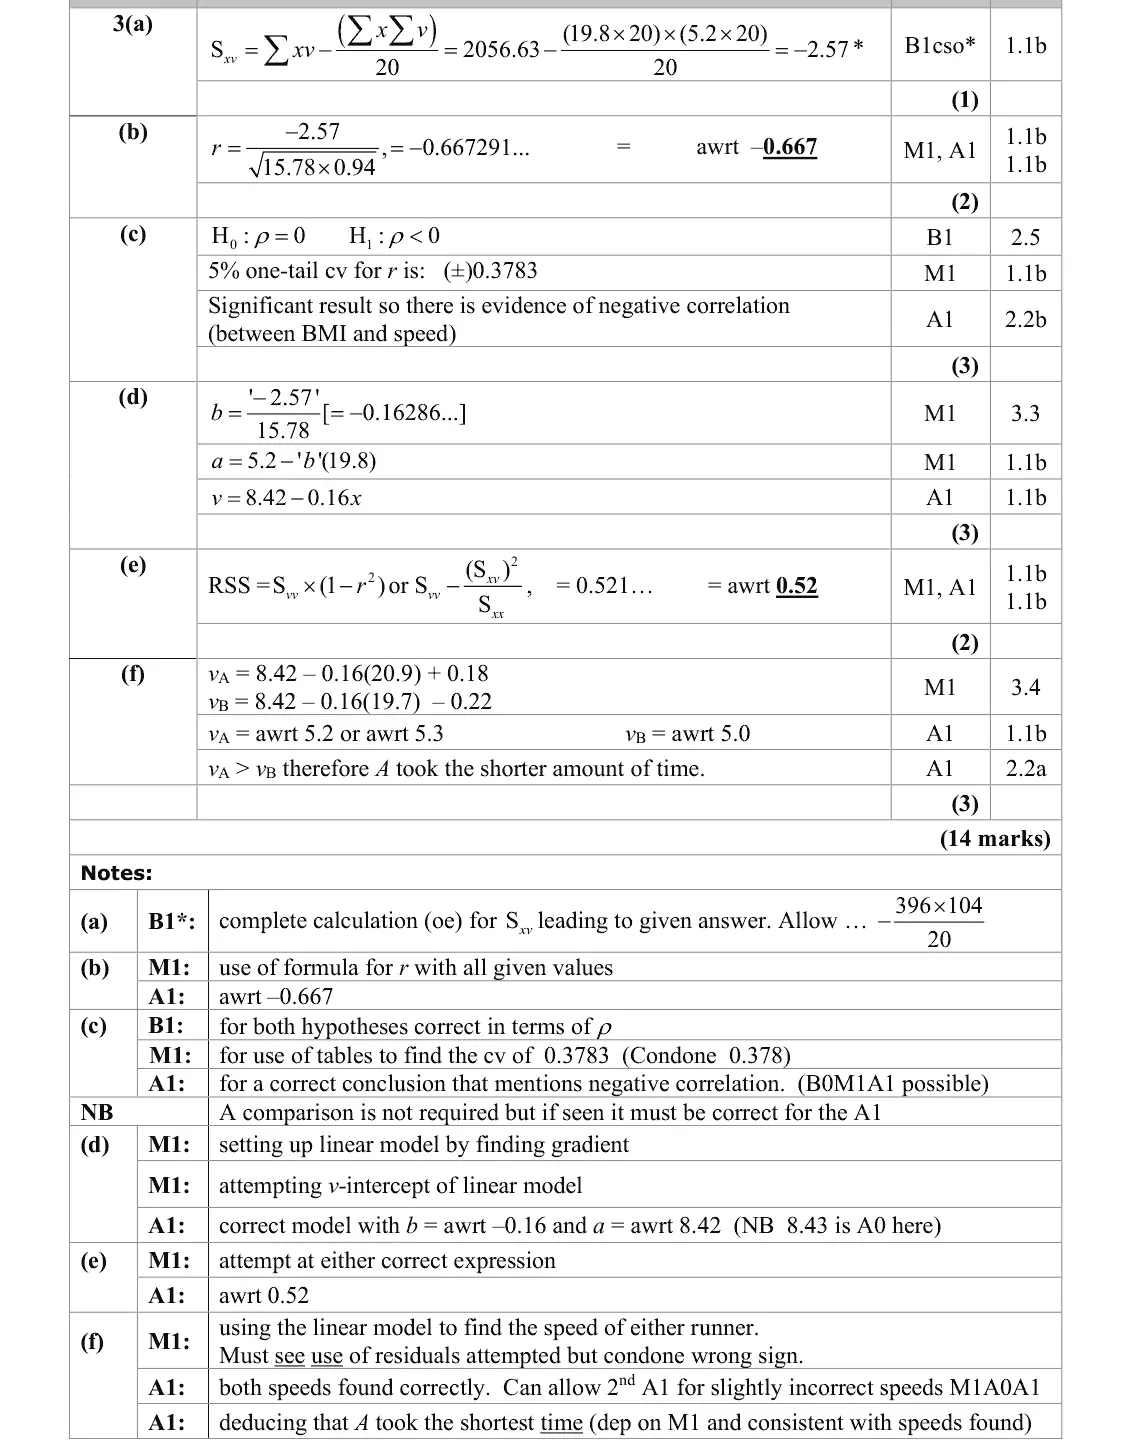
June 2025 · AS Paper 2 (Further Statistics 2) · Q3(d)3 marks
Mark scheme (whole question; this part is marked with the orange bar)
Examiner's comment
Part (d) was answered well but a few learners did not work with sufficient significant figures to find the value of a to 2 decimal places and a few cases of 8.43 here lost the accuracy mark.
Key points from the mark scheme and examiner's report
b = Sxv/Sxx = −0.163, a = v̄ − b x̄ = 8.42
v = 8.42 − 0.16x
keep enough figures (8.43 loses the mark)
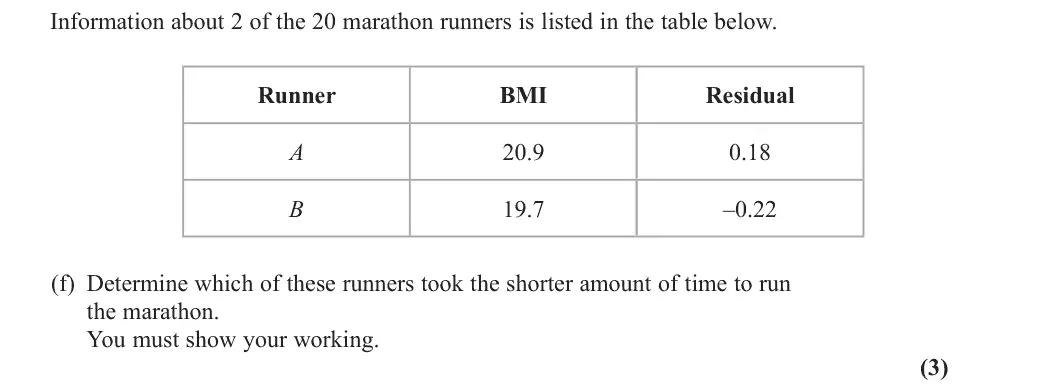
June 2025 · AS Paper 2 (Further Statistics 2) · Q3(f)3 marks
Mark scheme (whole question; this part is marked with the orange bar)
Examiner's comment
In part (f) some simply substituted the BMI values into their equation from part (e) and wrongly concluded the B had the greater average speed and so B was the quickest and took the shorter amount of time. Others realised that the residuals should play a part but had the wrong signs when appending these to their equation. A good number though found suitable values for the average speeds but seemed to forget that their values for vA and vB were speeds and not times and therefore picked the incorrect runner.
Key points from the mark scheme and examiner's report
actual speed = predicted + residual: vA = 5.2 or 5.3, vB = 5.0
A is faster so A took the shorter time
errors: ignoring residuals, wrong signs, or confusing speed with time
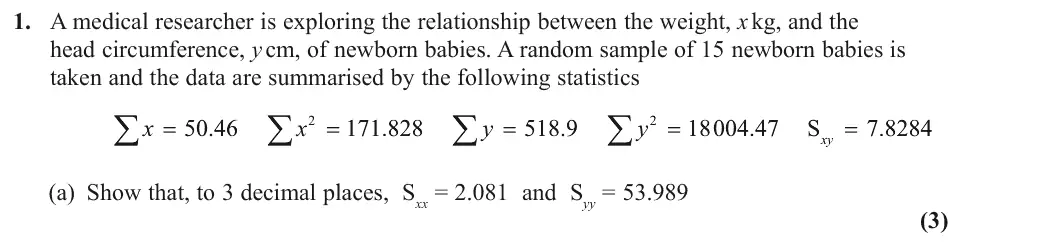
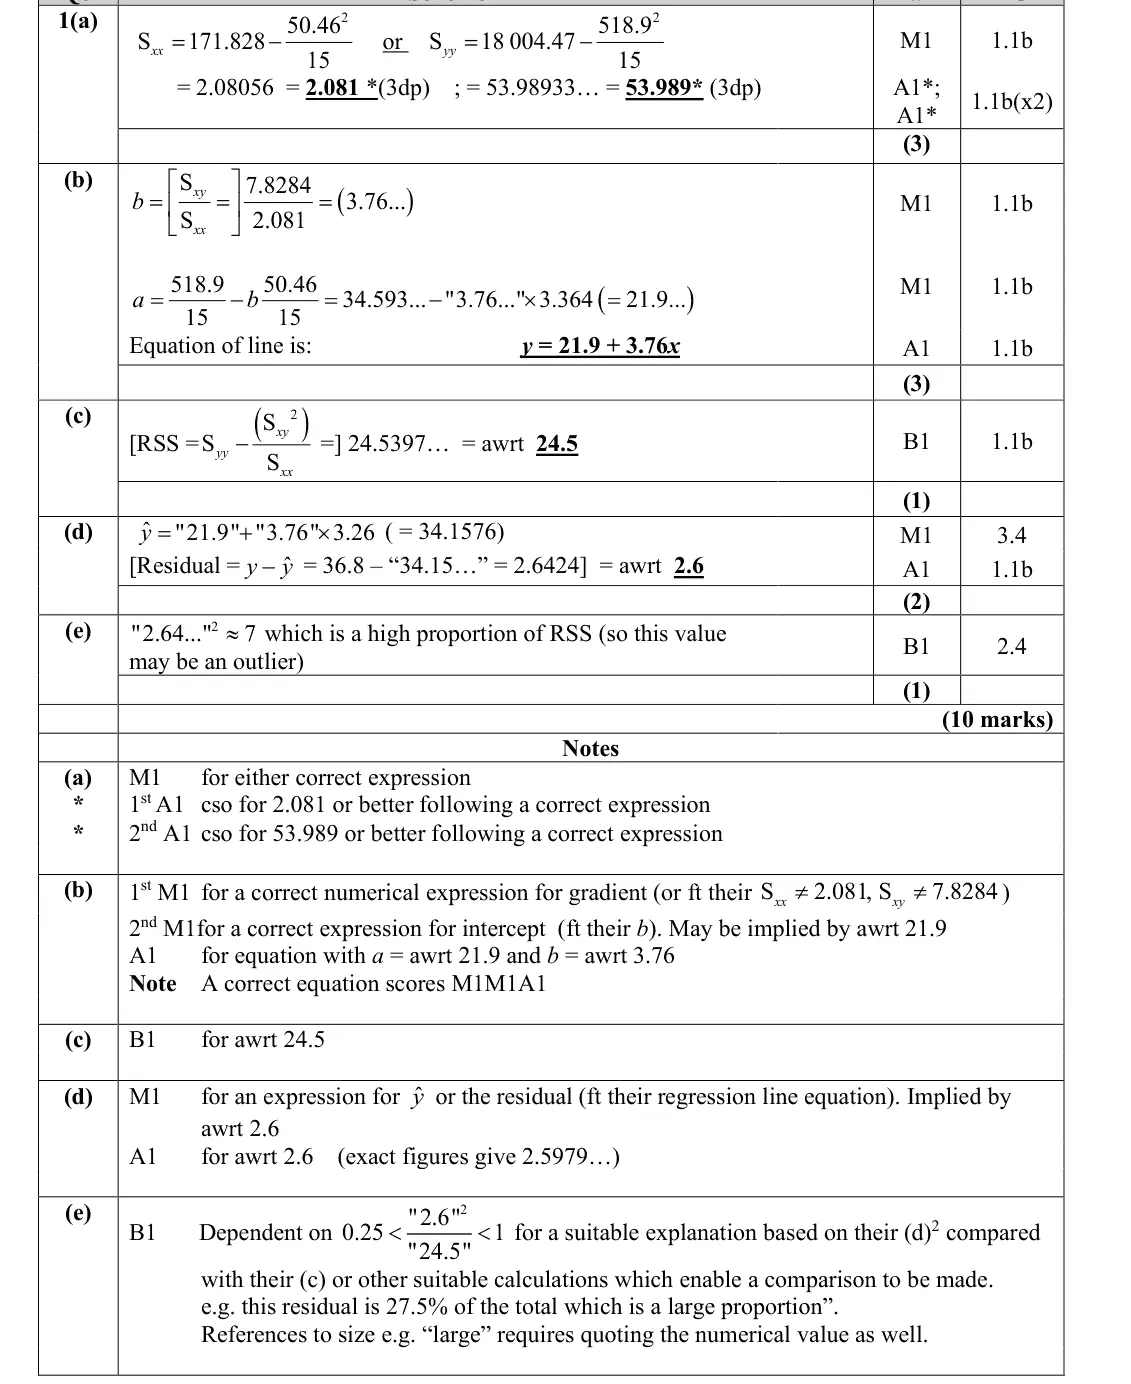
June 2025 · Paper 4B (Further Statistics 2) · Q1(a)3 marks
Mark scheme (whole question; this part is marked with the orange bar)
Examiner's comment
This opening question on the topic of linear regression was a good opening question for candidates with many scoring the majority of the marks. In part (a), most candidates were able to show the two required answers, although frustratingly some candidates miscopied the value from their calculator or they missed the squared off the calculation which cost them a mark.
Key points from the mark scheme and examiner's report
Sxx = 171.828 − 50.46²/15 = 2.08056 and Syy = 18004.47 − 518.9²/15 = 53.98933
show more than 3 d.p. before rounding
miscopying or dropping the square cost marks
June 2025 · Paper 4B (Further Statistics 2) · Q1(b)3 marks
Mark scheme (whole question; this part is marked with the orange bar)
Examiner's comment
This opening question on the topic of linear regression was a good opening question for candidates with many scoring the majority of the marks. Part (b) was usually correctly answer with candidates using the given values to find the equation of the regression line y on x. Occasionally, candidates who had made a slip in part (a) used their incorrect value (despite the correct values given in the question) which resulted in some inaccuracies in their final answer.
Key points from the mark scheme and examiner's report
b = Sxy/Sxx = 7.8284/2.081 = 3.76
a = ȳ − b x̄ = 21.9
y = 21.9 + 3.76x
June 2024 · AS Paper 2 (Further Statistics 2) · Q5(a)3 marks
Mark scheme (whole question; this part is marked with the orange bar)
Examiner's comment
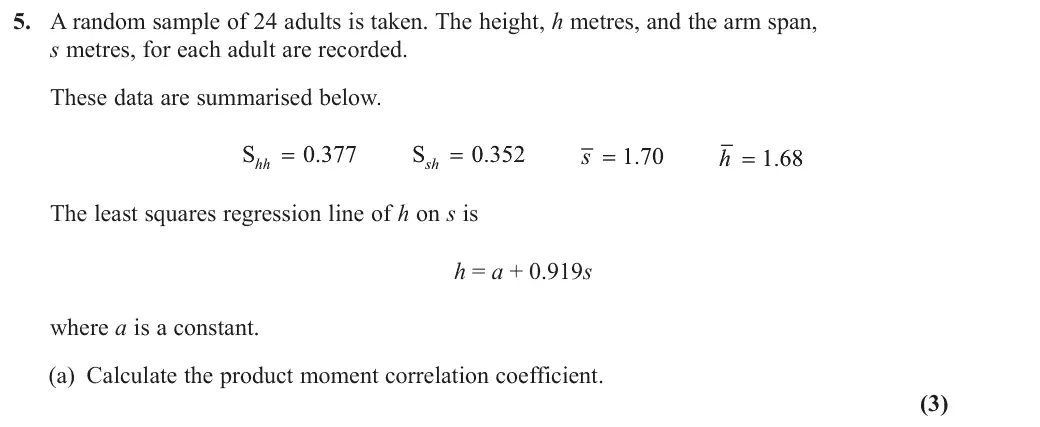
In part (a) most knew that they needed to find Sss and usually they realised this could be found using the gradient of the regression line. The correct value for r normally followed.
Key points from the mark scheme and examiner's report
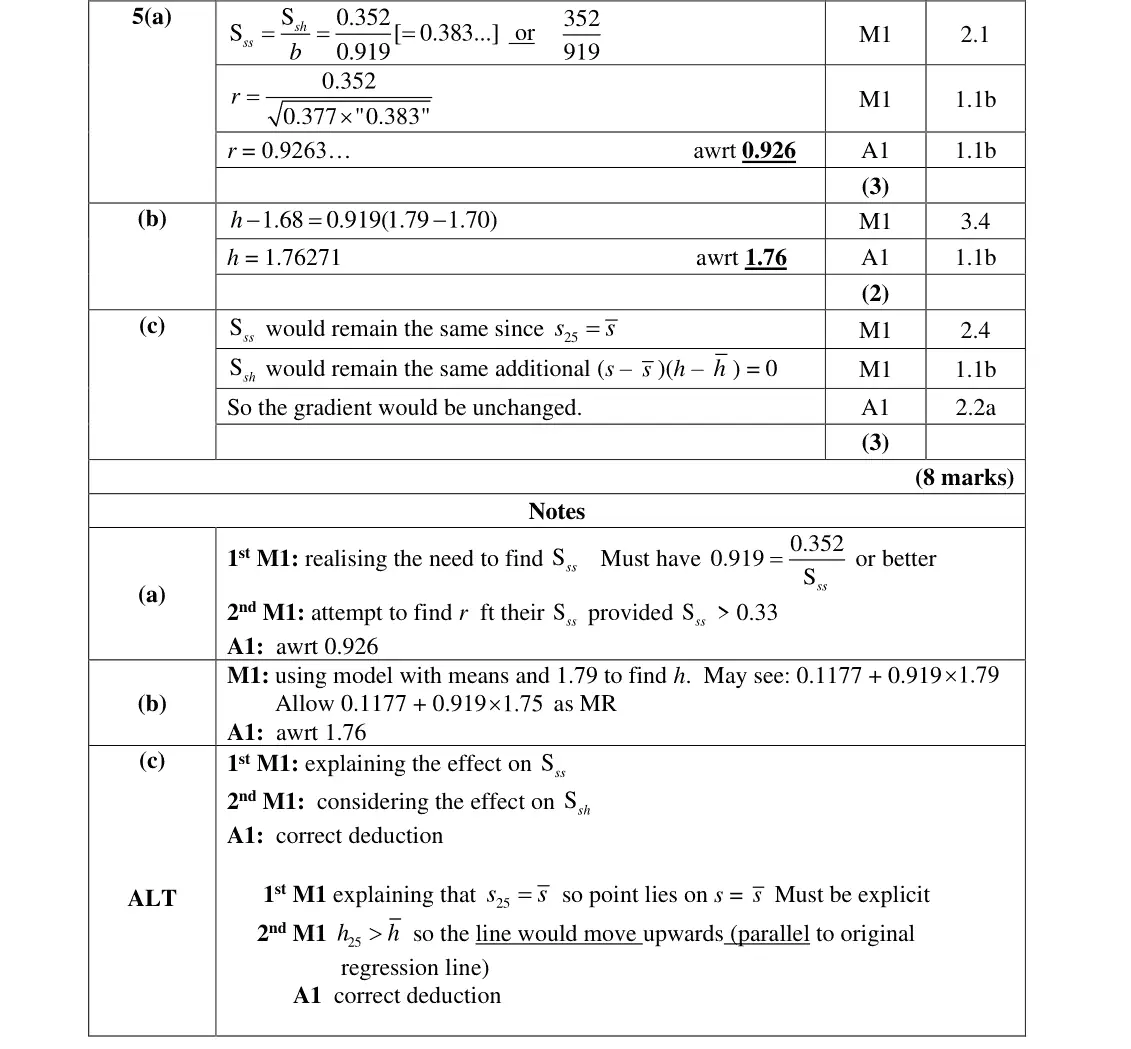
use the gradient b = Ssh/Sss to get Sss = 0.352/0.919 = 0.383
r = 0.352/√(0.377 × 0.383) = 0.926
June 2024 · AS Paper 2 (Further Statistics 2) · Q5(b)2 marks
Mark scheme (whole question; this part is marked with the orange bar)
Examiner's comment
Part (b) was answered very well with the vast majority finding a = 0.1177 and then the predicted arm span of 1.76 metres.
Key points from the mark scheme and examiner's report
the line passes through the means: h − 1.68 = 0.919(1.79 − 1.70), h = 1.76 m
June 2024 · AS Paper 2 (Further Statistics 2) · Q5(c)3 marks
Mark scheme (whole question; this part is marked with the orange bar)
Examiner's comment
Part (c) was not answered well. Those who attempted it usually found that Ewan’s height was greater than the regression line would have predicted, and they argued that this would mean that the line would be steeper. A correct deduction based on the formulae for Sss and Ssh was not seen. The key point is that since the arm span of Ewan is the same as the mean of the original 24 then the mean of all 25 x values will be the same. This means that both Sss and Ssh will not change when Ewan is added and so the gradient will not change either. Formal justifications of these observations were not expected though, of course, they can be proved algebraically using ( ) 2 Sss s s = - ∑ and noting that the 25th term of the series is of course zero. A similar argument can be made for ( )( ) ( ) Ssh s s h h s s h = - - = - ∑ ∑ and noting again that the 25th term of the series is zero.
Key points from the mark scheme and examiner's report
Ewan's arm span equals s̄ so s̄ is unchanged
his (s − s̄)(h − h̄) = 0 and (s − s̄)² = 0, so Sss and Ssh are unchanged and the gradient stays the same (the line just shifts up)
most wrongly said steeper
June 2024 · Paper 4B (Further Statistics 2) · Q1(a)4 marks
Mark scheme (whole question; this part is marked with the orange bar)
Examiner's comment
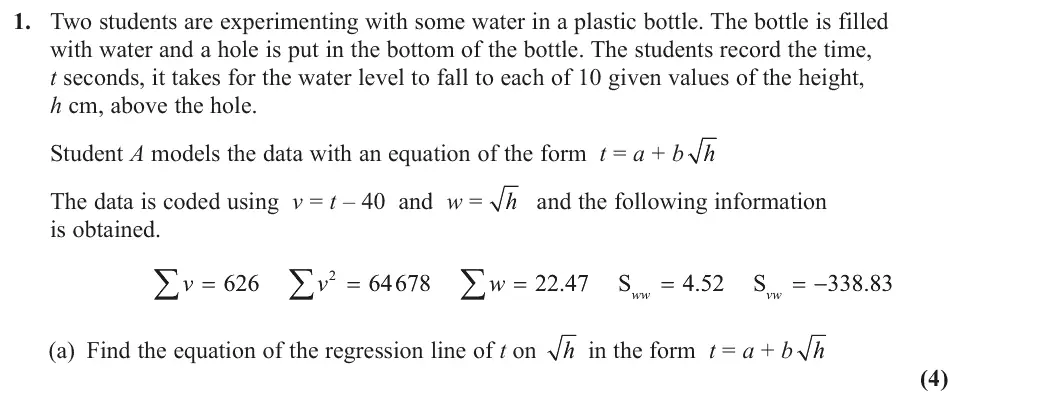
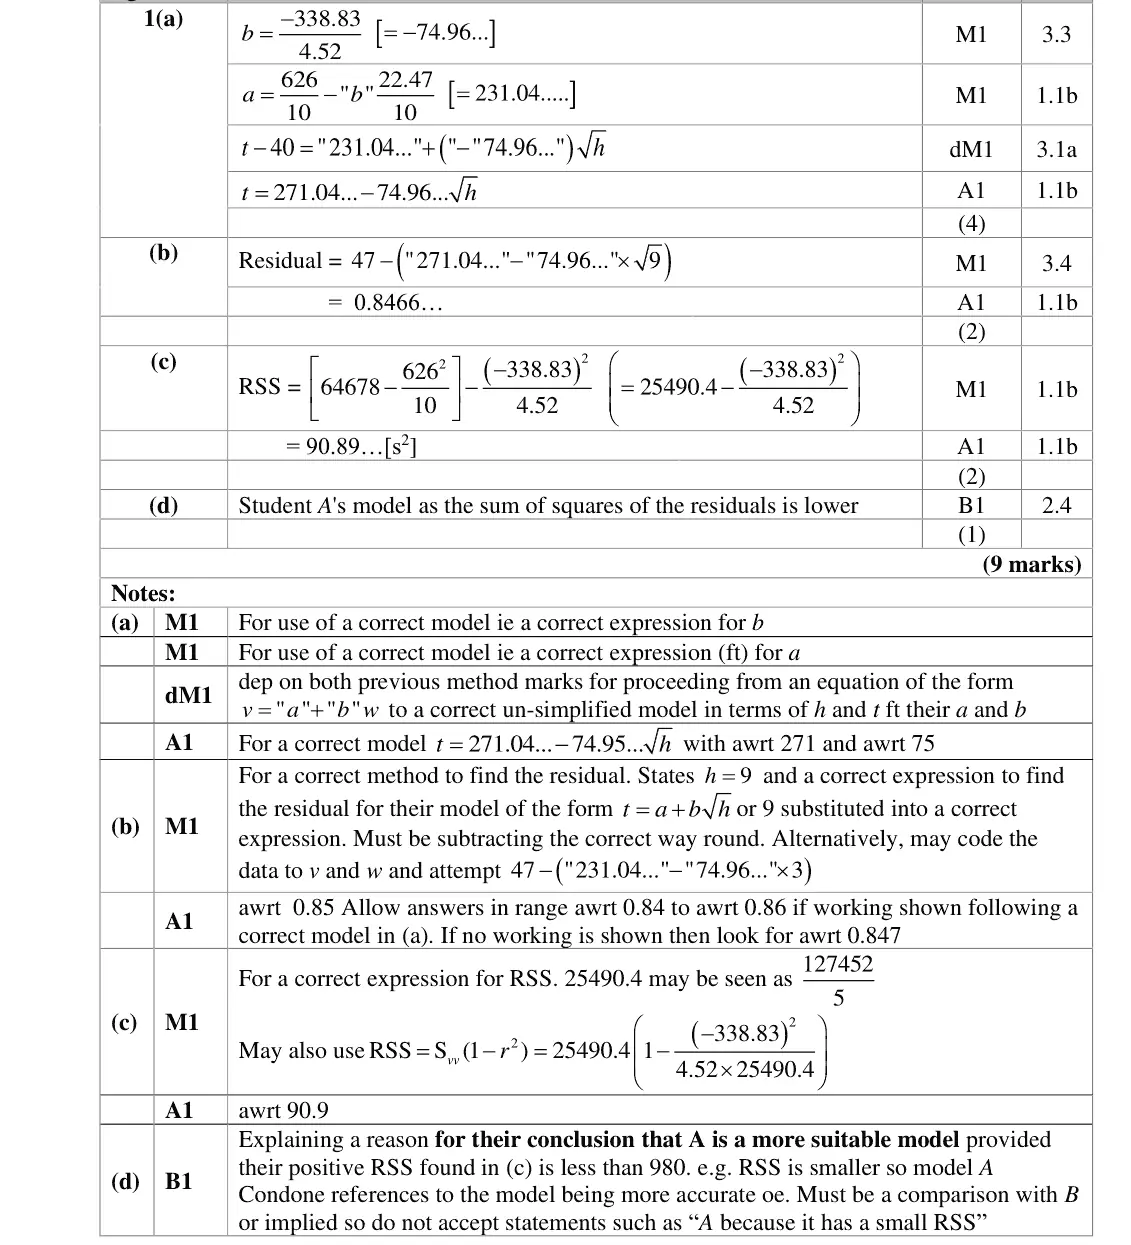
This opening question on the topic of linear regression brought more challenge than expected for some candidates. In part (a) candidates were required to find the regression line h on t having been given coded data in the form of two other variables, v and w. Whilst the majority of candidates made good progress on most of this question, with parts (a) and (c) the most commonly fully correct, there were some who got mixed up with the variables and attempted to find the line h on t. the coefficients obtained in part (a), and some compounded their error by failing to show full workings for finding the residual, and also lost the method mark. Some candidates showed their workings clearly but subtracted the wrong way round for the residual so gained no credit. Many of the candidates who were successful with (c) also went on to make, and adequately justify, the correct decision in (d).
Key points from the mark scheme and examiner's report
coded regression v on w: b = Svw/Sww = −74.96, a = v̄ − b w̄ = 231.04
decode v = t − 40, w = √h: t = 271.04 − 74.96√h
some found the line the wrong way round (h on t)
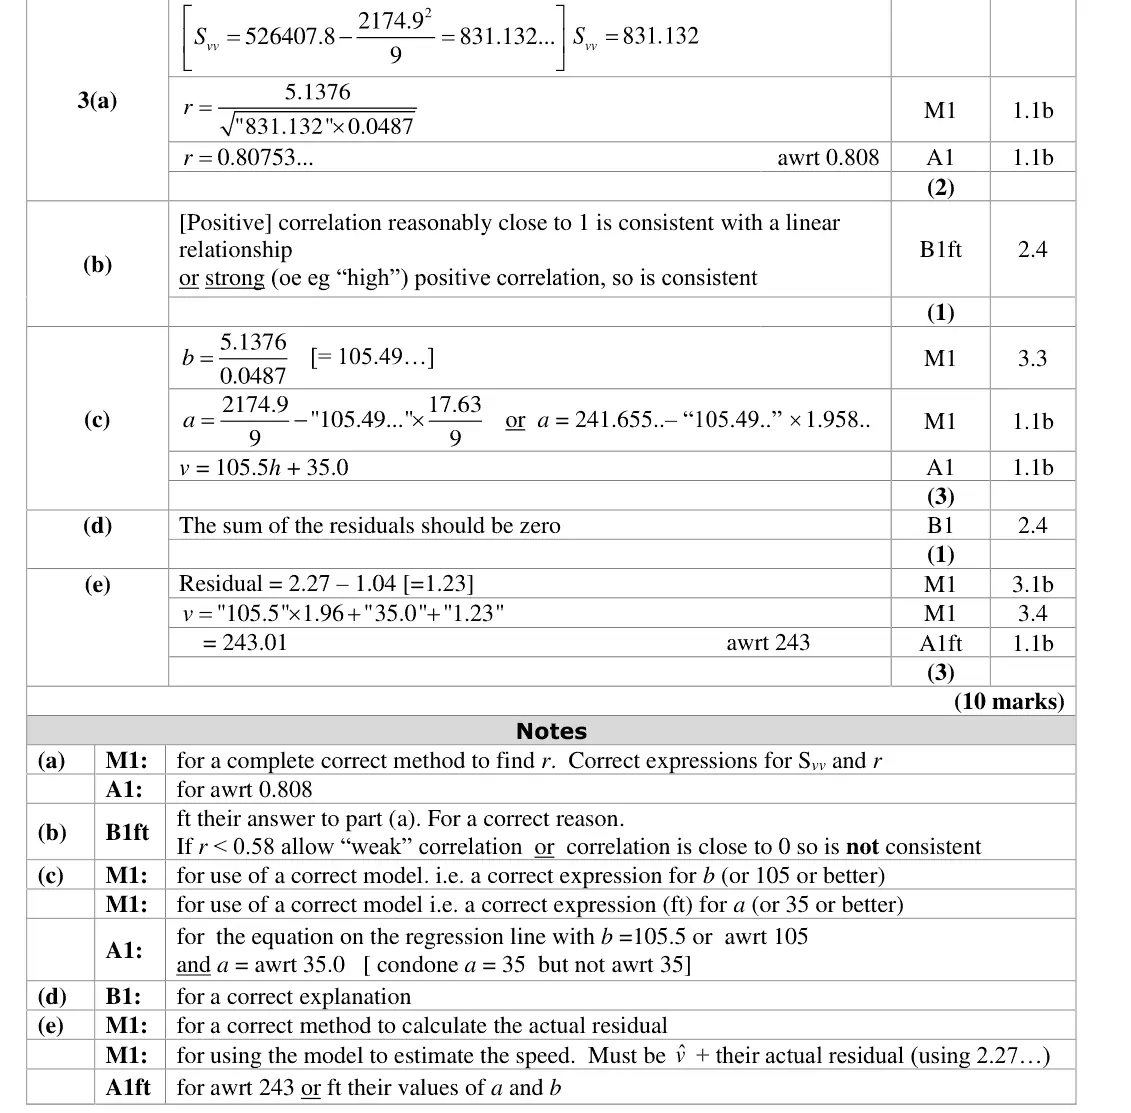
June 2023 · AS Paper 2 (Further Statistics 2) · Q3(c)3 marks
Mark scheme (whole question; this part is marked with the orange bar)
Examiner's comment
suitable evidence. The calculations in part (c) were usually correct with only a handful of students using S hv for the gradient. There was some confusion in part (d). Although
Key points from the mark scheme and examiner's report
b = Shv/Shh = 105.5
a = v̄ − b h̄ = 35.0
v = 105.5h + 35.0
some used Shv/Svv
June 2023 · AS Paper 2 (Further Statistics 2) · Q3(e)3 marks
Mark scheme (whole question; this part is marked with the orange bar)
Examiner's comment
⩽1. In part (e) most simply substituted 1.96 into their equation for the regression line and completely ignored the information about Pat’s misread of the residual. Those that did consider this and calculated the actual residual to be 1.23 usually went on to complete this part correctly.
Key points from the mark scheme and examiner's report
true residual = 2.27 − 1.04 = 1.23
v = 105.5(1.96) + 35.0 + 1.23 = 243 km/h
most ignored the residual information
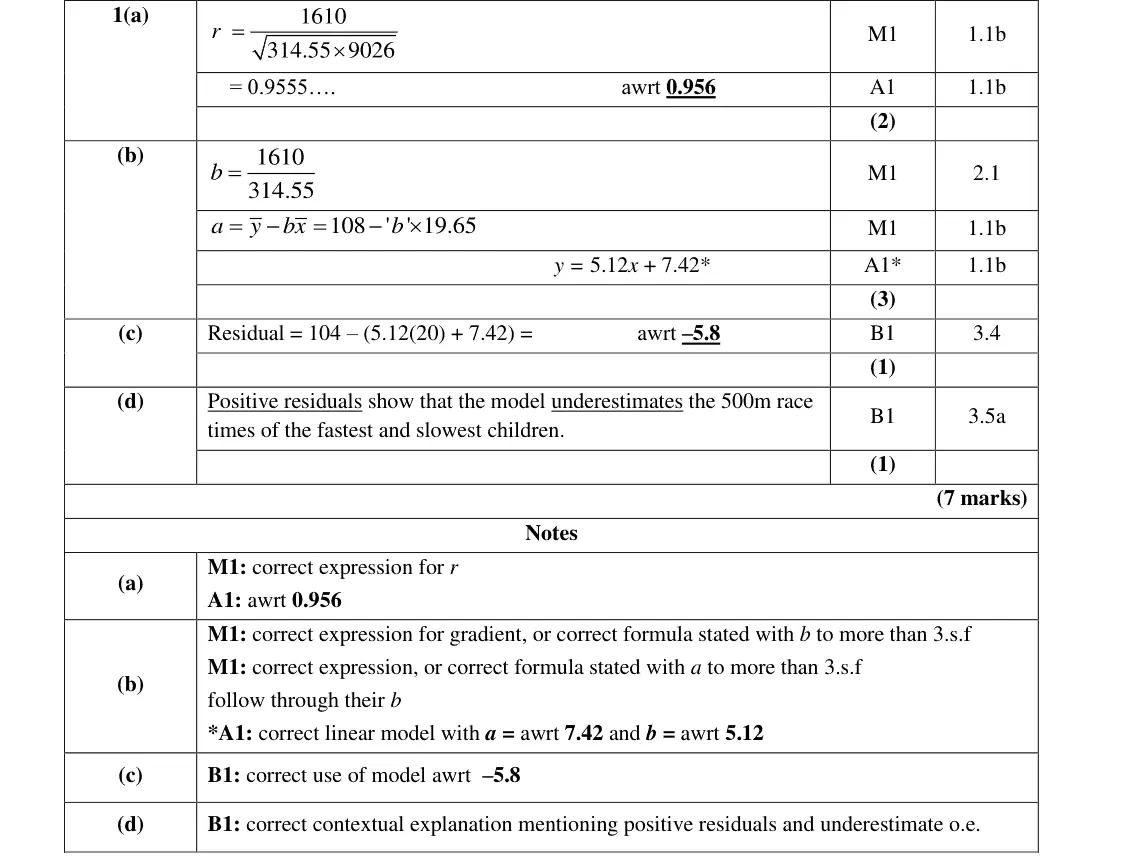
June 2023 · Paper 4B (Further Statistics 2) · Q1(b)3 marks
Mark scheme (whole question; this part is marked with the orange bar)
Examiner's comment
This was a generally welcoming first question as the first six marks were procedural and very straightforward, allowing candidates a gentle introduction to the paper. Parts (a) and (b) were almost always done correctly. Many candidates subtracted the real and estimated value backwards to obtain a positive residual in
Key points from the mark scheme and examiner's report
b = Sxy/Sxx = 1610/314.55, a = ȳ − b x̄ = 108 − b × 19.65
show values to more than 3 s.f. before rounding to y = 5.12x + 7.42
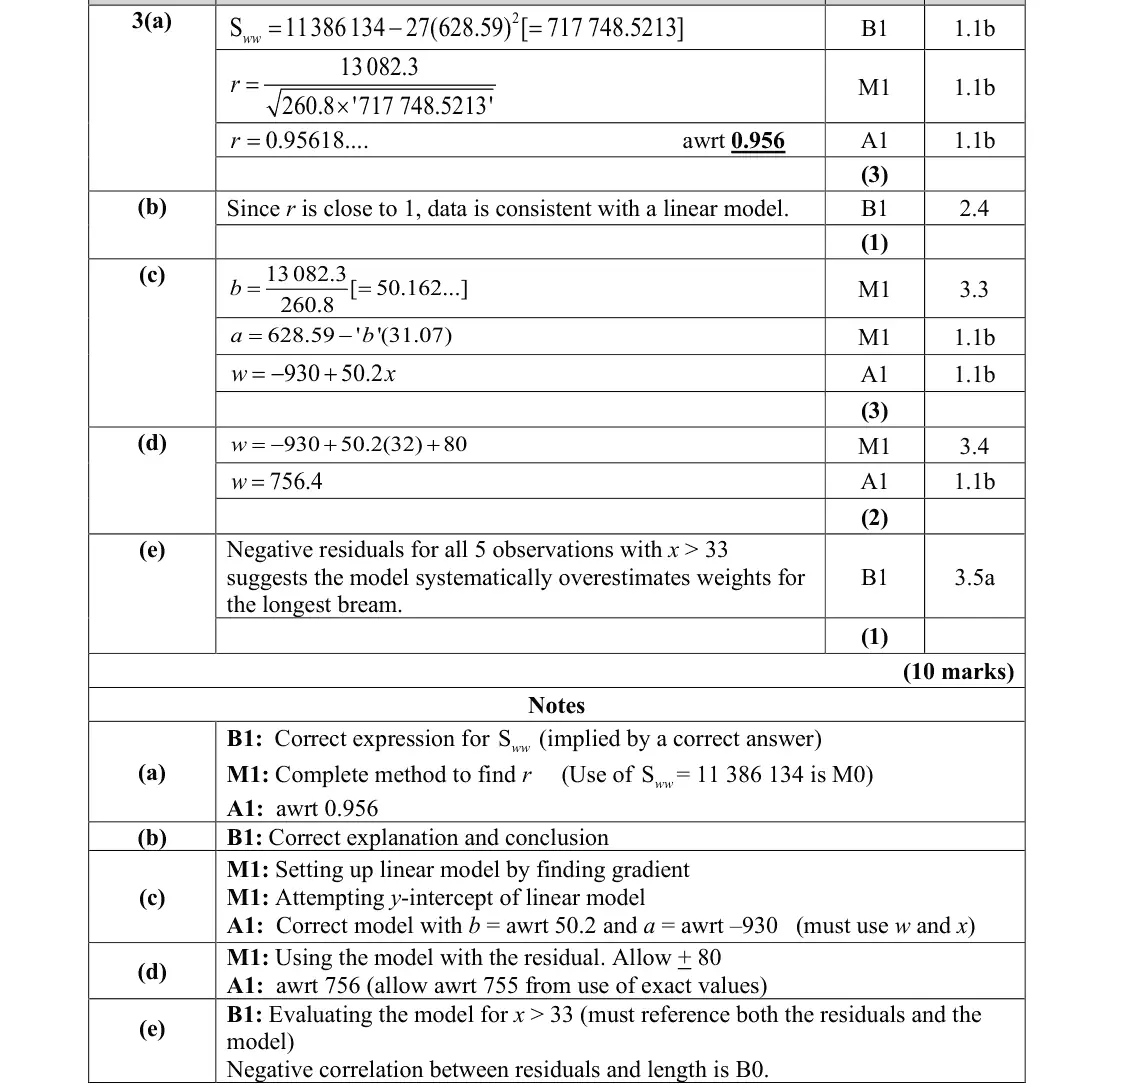
June 2022 · AS Paper 2 (Further Statistics 2) · Q3(c)3 marks
Mark scheme (whole question; this part is marked with the orange bar)
Examiner's comment
Nearly all candidates were able to gain some marks in part (c) with finding the equation of a regression line being a well-versed technique for many. Premature rounding caused issues for some, losing the final accuracy mark. On a few rare occasions, y was used instead of w in the regression equation.
Key points from the mark scheme and examiner's report
b = Sxw/Sxx = 50.2, a = w̄ − b x̄ = −930: w = −930 + 50.2x
avoid premature rounding
use w and x, not y
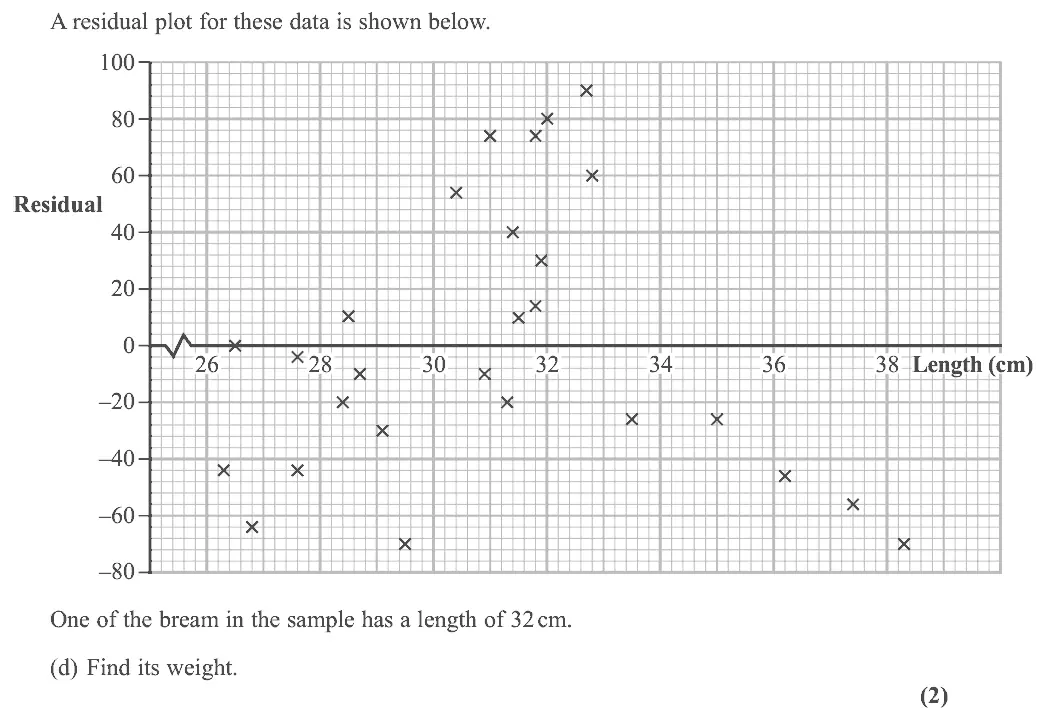
June 2022 · AS Paper 2 (Further Statistics 2) · Q3(d)2 marks
Mark scheme (whole question; this part is marked with the orange bar)
Examiner's comment
In part (d), most realised that they needed to substitute x = 32 into their regression equation, but fewer realised the needed to add 80 to find the weight of the bream.
Key points from the mark scheme and examiner's report
read the residual +80 at x = 32 and add it: w = −930 + 50.2(32) + 80 = 756
many forgot the residual
June 2022 · Paper 4B (Further Statistics 2) · Q1(a)1 mark
Mark scheme (whole question; this part is marked with the orange bar)
Examiner's comment
This question proved to be an accessible start for virtually all candidates. Nearly all made a good start to the paper in part (a) by being able to calculate the output of the linear regression equation. Part (b) was generally well attempted with the majority of candidates giving a correct
Key points from the mark scheme and examiner's report
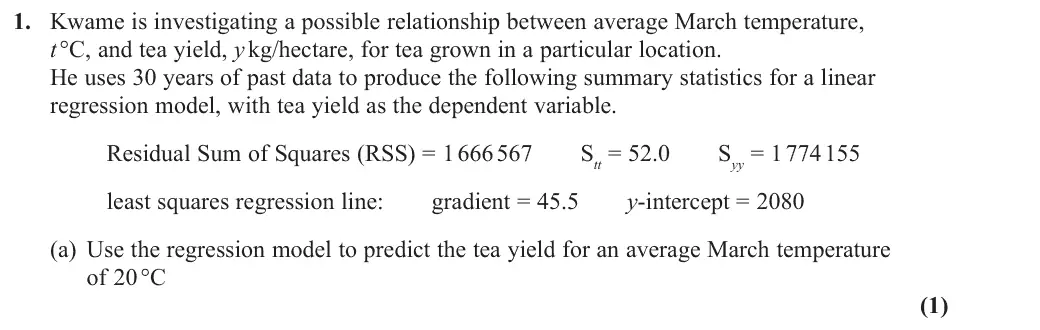
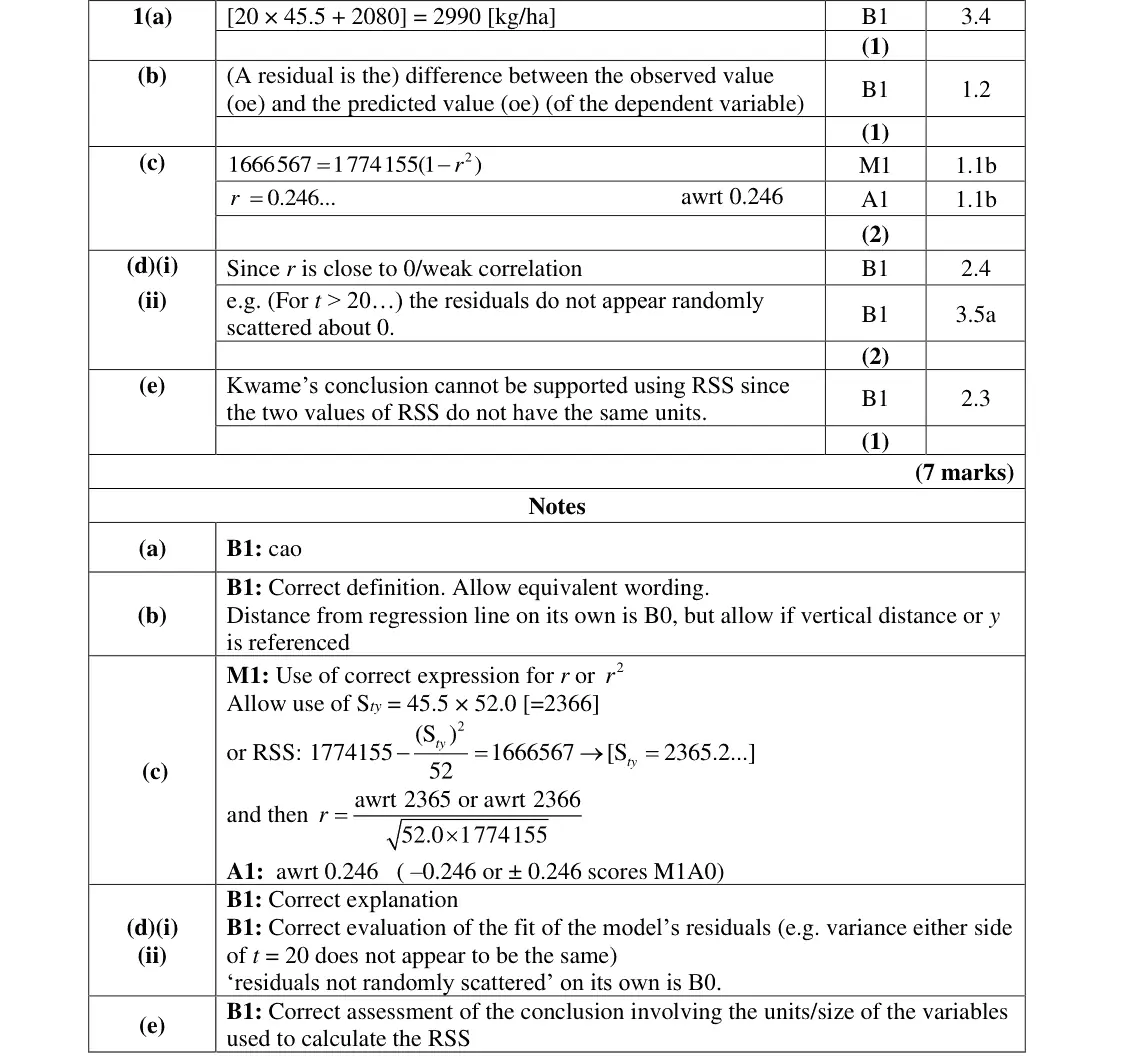
y = 2080 + 45.5 × 20 = 2990 kg/ha
Nov 2021 · Paper 4B (Further Statistics 2) · Q4(b)4 marks
Mark scheme (whole question; this part is marked with the orange bar)
Key points from the mark scheme and examiner's report
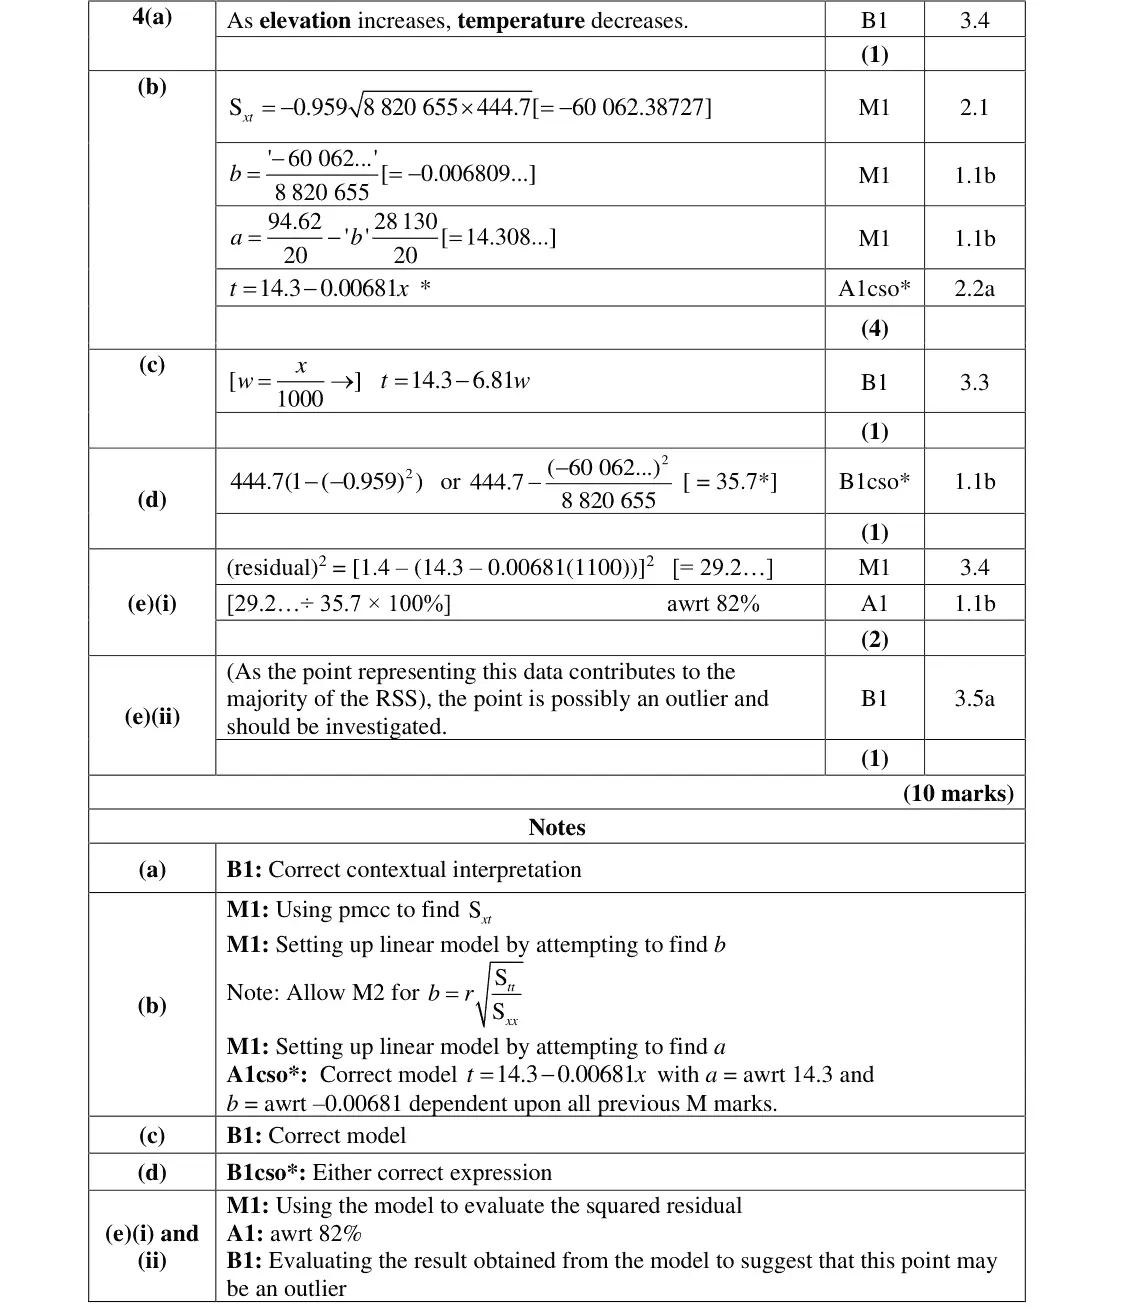
Sxt = r√(Sxx Stt) = −60062
b = Sxt/Sxx = −0.006809, a = t̄ − b x̄ = 14.308
printed answer t = 14.3 − 0.00681x so all steps shown
Nov 2021 · Paper 4B (Further Statistics 2) · Q4(c)1 mark
Mark scheme (whole question; this part is marked with the orange bar)
Key points from the mark scheme and examiner's report
x = 1000w so t = 14.3 − 6.81w (coding)
Oct 2020 · AS Paper 2 (Further Statistics 2) · Q4(a)1 mark
Mark scheme (whole question; this part is marked with the orange bar)
Key points from the mark scheme and examiner's report
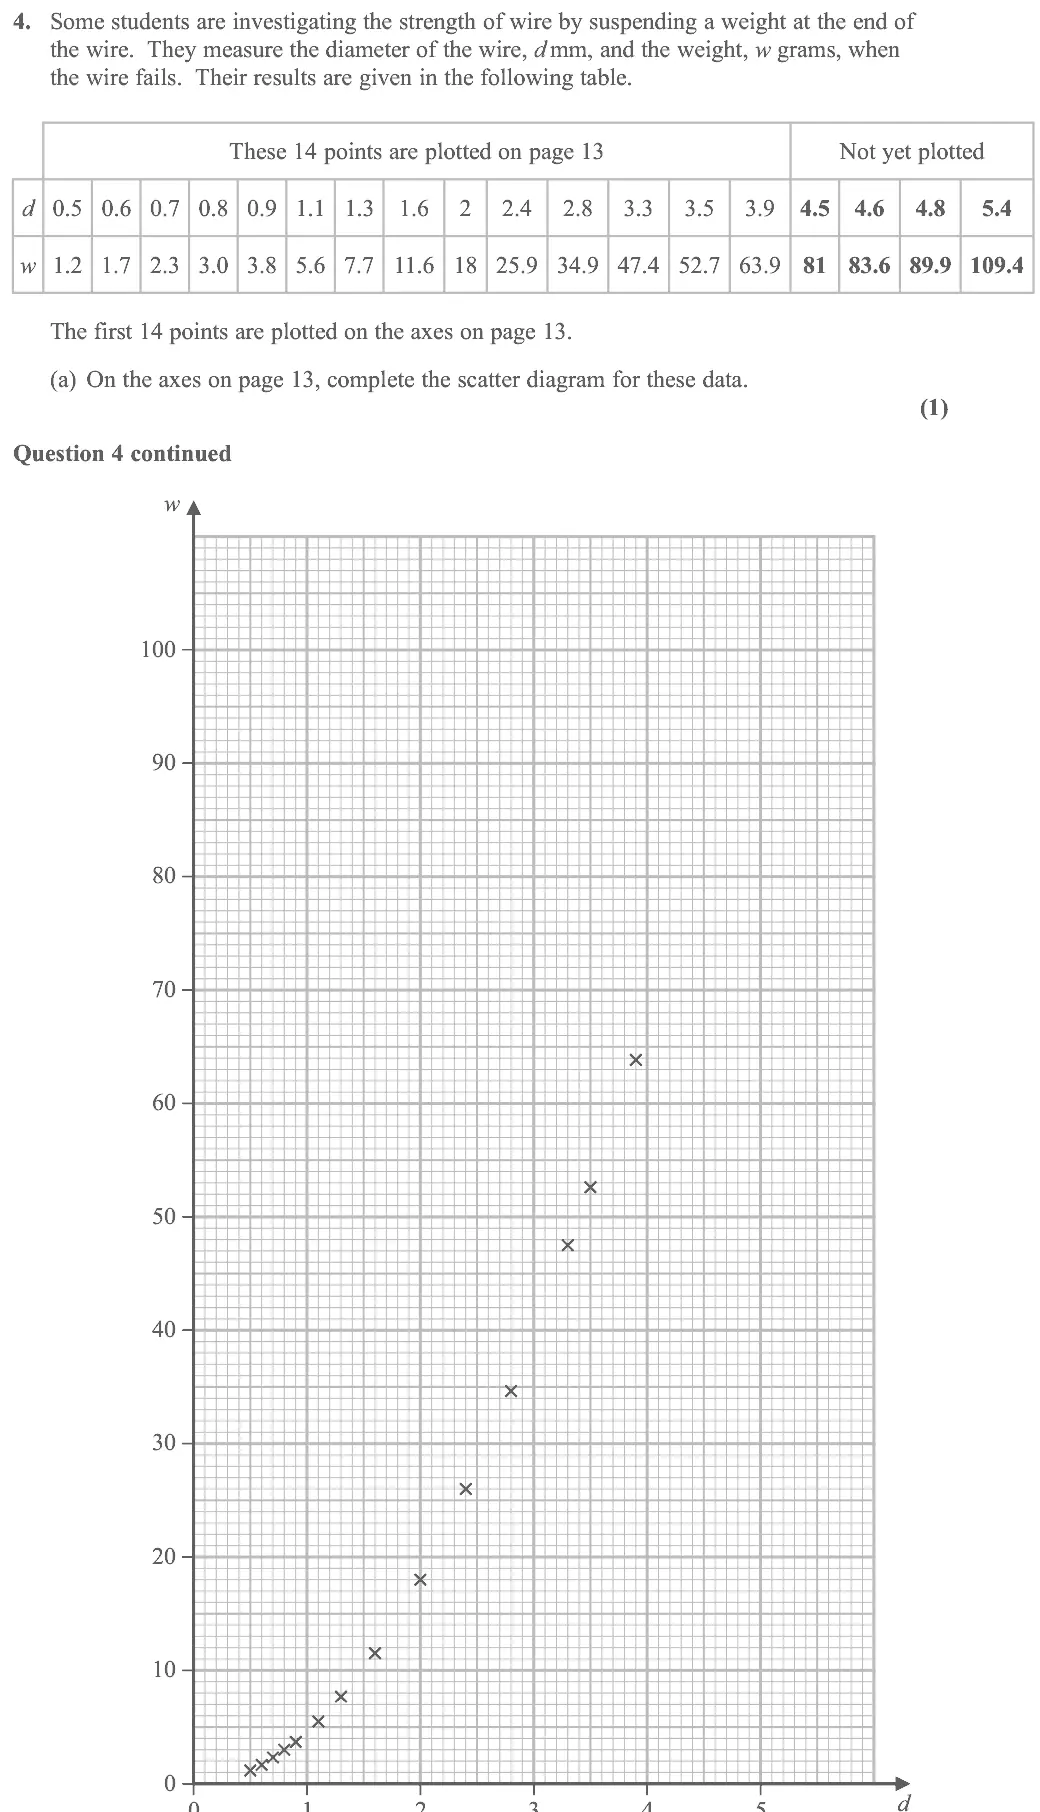
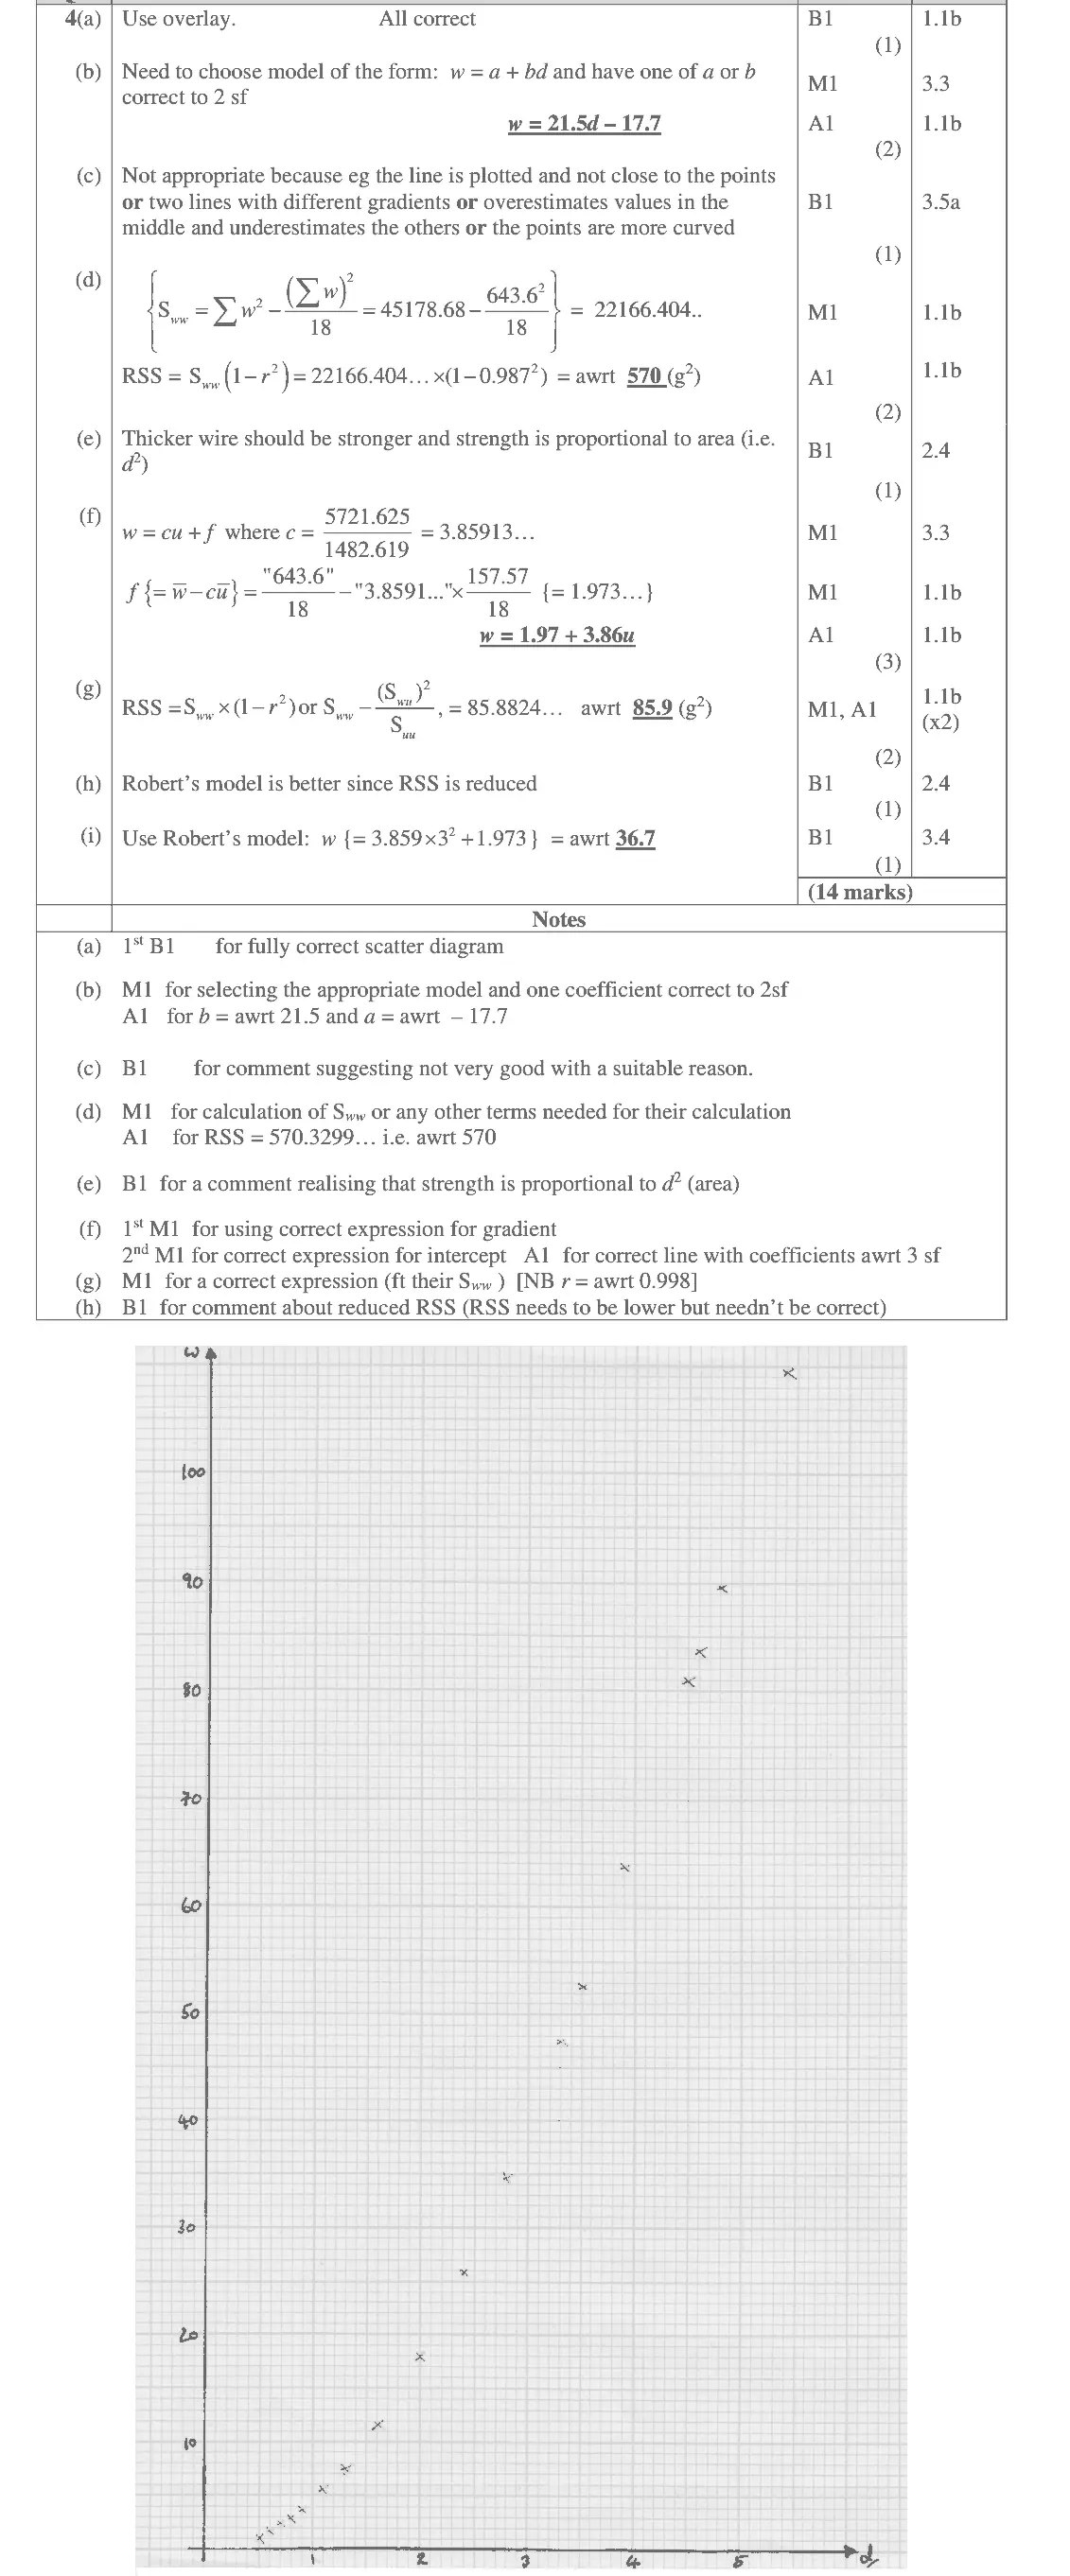
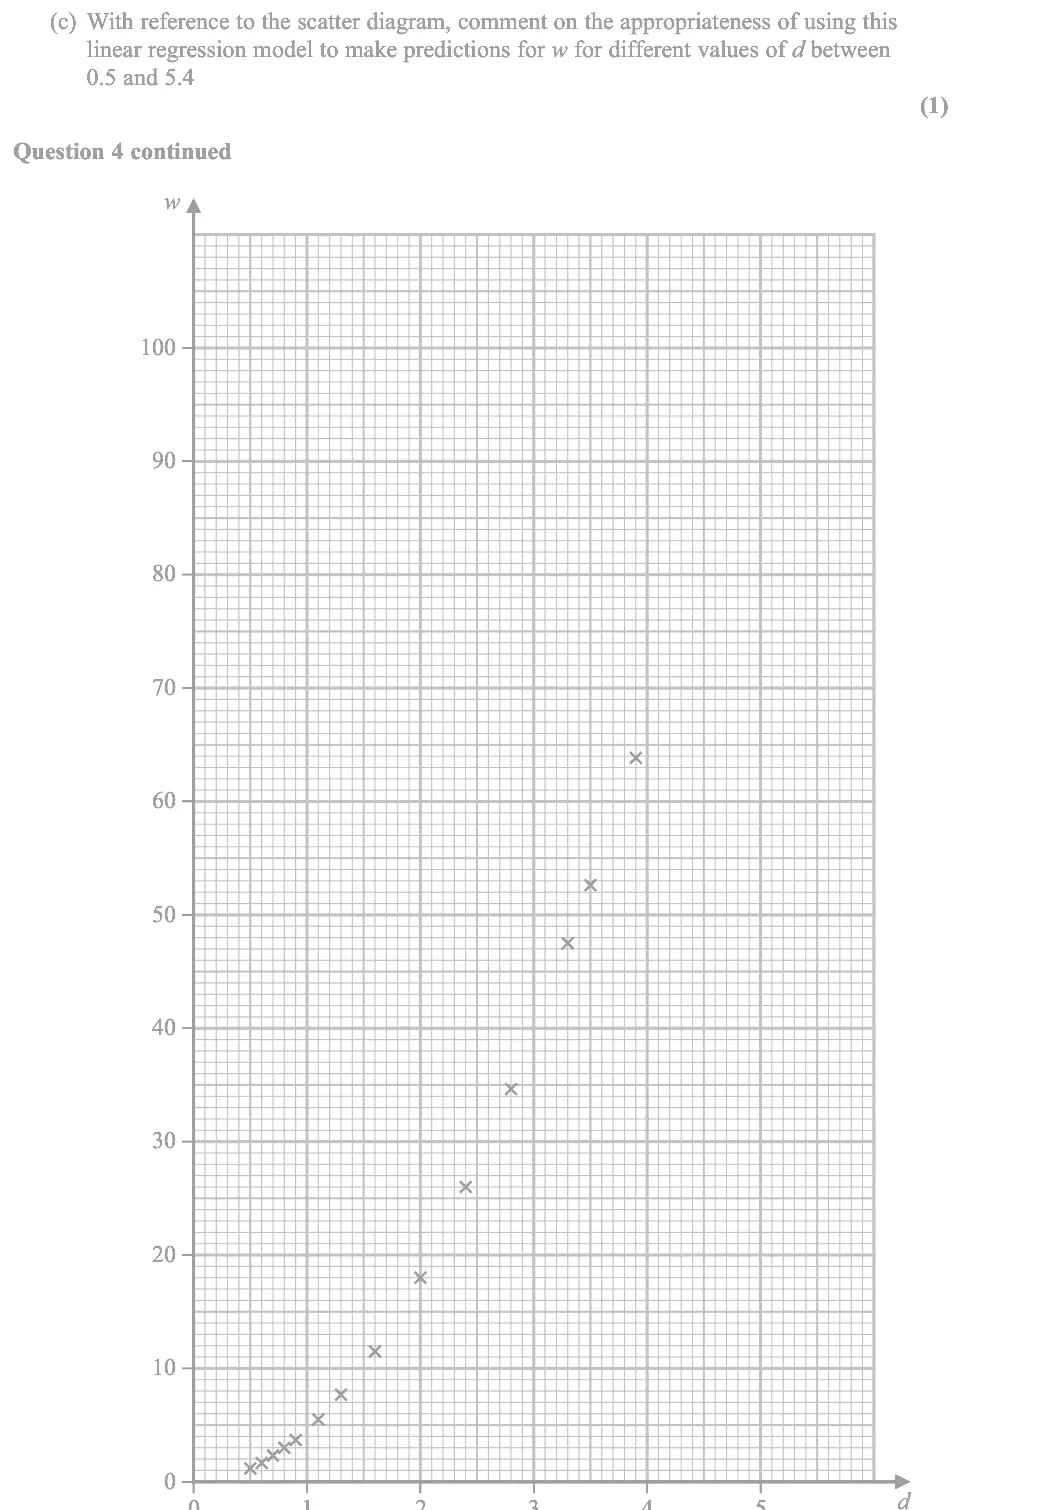
plot the four remaining points (4.5, 81), (4.6, 83.6), (4.8, 89.9), (5.4, 109.4) on the given axes
Oct 2020 · AS Paper 2 (Further Statistics 2) · Q4(b)2 marks
Mark scheme (whole question; this part is marked with the orange bar)
Key points from the mark scheme and examiner's report
calculator regression: w = 21.5d − 17.7
Oct 2020 · AS Paper 2 (Further Statistics 2) · Q4(c)1 mark
Mark scheme (whole question; this part is marked with the orange bar)
Key points from the mark scheme and examiner's report
not appropriate: points follow a curve, so the line overestimates in the middle and underestimates at the ends
Oct 2020 · AS Paper 2 (Further Statistics 2) · Q4(f)3 marks
Mark scheme (whole question; this part is marked with the orange bar)
Key points from the mark scheme and examiner's report
gradient Swu/Suu = 3.859
intercept w̄ − c ū = 1.97
w = 1.97 + 3.86u
Oct 2020 · AS Paper 2 (Further Statistics 2) · Q4(i)1 mark
Mark scheme (whole question; this part is marked with the orange bar)
Key points from the mark scheme and examiner's report
use Robert's model with u = 3² = 9: w = 3.859(9) + 1.973 = 36.7 g
do not use d = 3 directly
June 2019 · AS Paper 2 (Further Statistics 2) · Q3(c)3 marks
Mark scheme (whole question; this part is marked with the orange bar)
Examiner's comment
The nearly all candidates were able to gain some marks in part (c) with those using the method given in the mark scheme gaining full marks. The most commonly used alternative method was to go back to the original summary data to find the value of b and then use a particular value for s to try and find the value of a. This was a rather long winded and generally unsuccessful.
Key points from the mark scheme and examiner's report
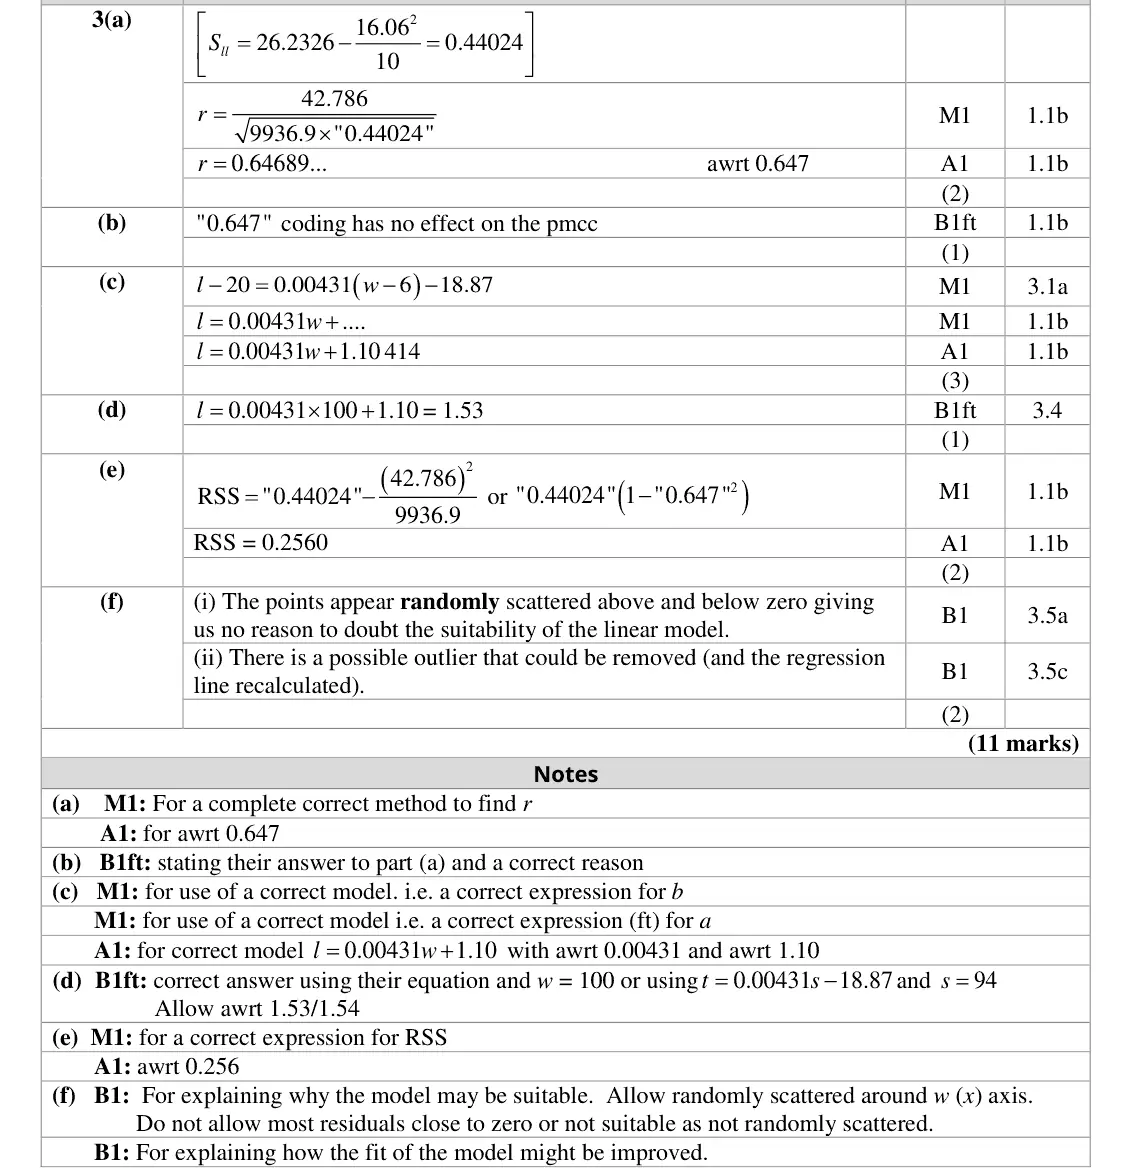
substitute s = w − 6, t = l − 20 into Dora's line: l = 0.00431w + 1.10
recalculating from the summary data was long and usually unsuccessful
June 2019 · AS Paper 2 (Further Statistics 2) · Q3(d)1 mark
Mark scheme (whole question; this part is marked with the orange bar)
Examiner's comment
Part (a) of question three proved to be the most accessible part of the paper with the majority of candidates gaining full marks. In part (b) whilst most candidates realised that the product moment correlation coefficient would be the same as part (a) a minority of candidates either forgot or were unable to give a suitable reason. The nearly all candidates were able to gain some marks in part (c) with those using the method given in the mark scheme gaining full marks. The most commonly used alternative method was to go back to the original summary data to find the value of b and then use a particular value for s to try and find the value of a. This was a rather long winded and generally unsuccessful. Part (e) was well answered with the majority of candidates gaining both marks. Part (f) discriminated the most able candidates with a correct answer to both parts rarely being seen. Those candidates who made an attempt at answering were generally able to gain a mark in part(ii). The most common error in part (i) was to state that “all the points are close to zero” which may be true but does not necessarily mean a linear regression model is suitable. They need to be randomly scattered. The candidates who gained no marks in this part had left it unanswered. candidates should remember that leaving a part unanswered will definitely gain zero marks but if an attempt is made there is always a chance of scoring some marks.
Key points from the mark scheme and examiner's report
l = 0.00431(100) + 1.10 = 1.53 tonnes per hectare
June 2019 · Paper 4B (Further Statistics 2) · Q2(c)3 marks
Mark scheme (whole question; this part is marked with the orange bar)
Examiner's comment
This question was well answered with the majority of candidates gaining the marks in the first four parts.
Key points from the mark scheme and examiner's report
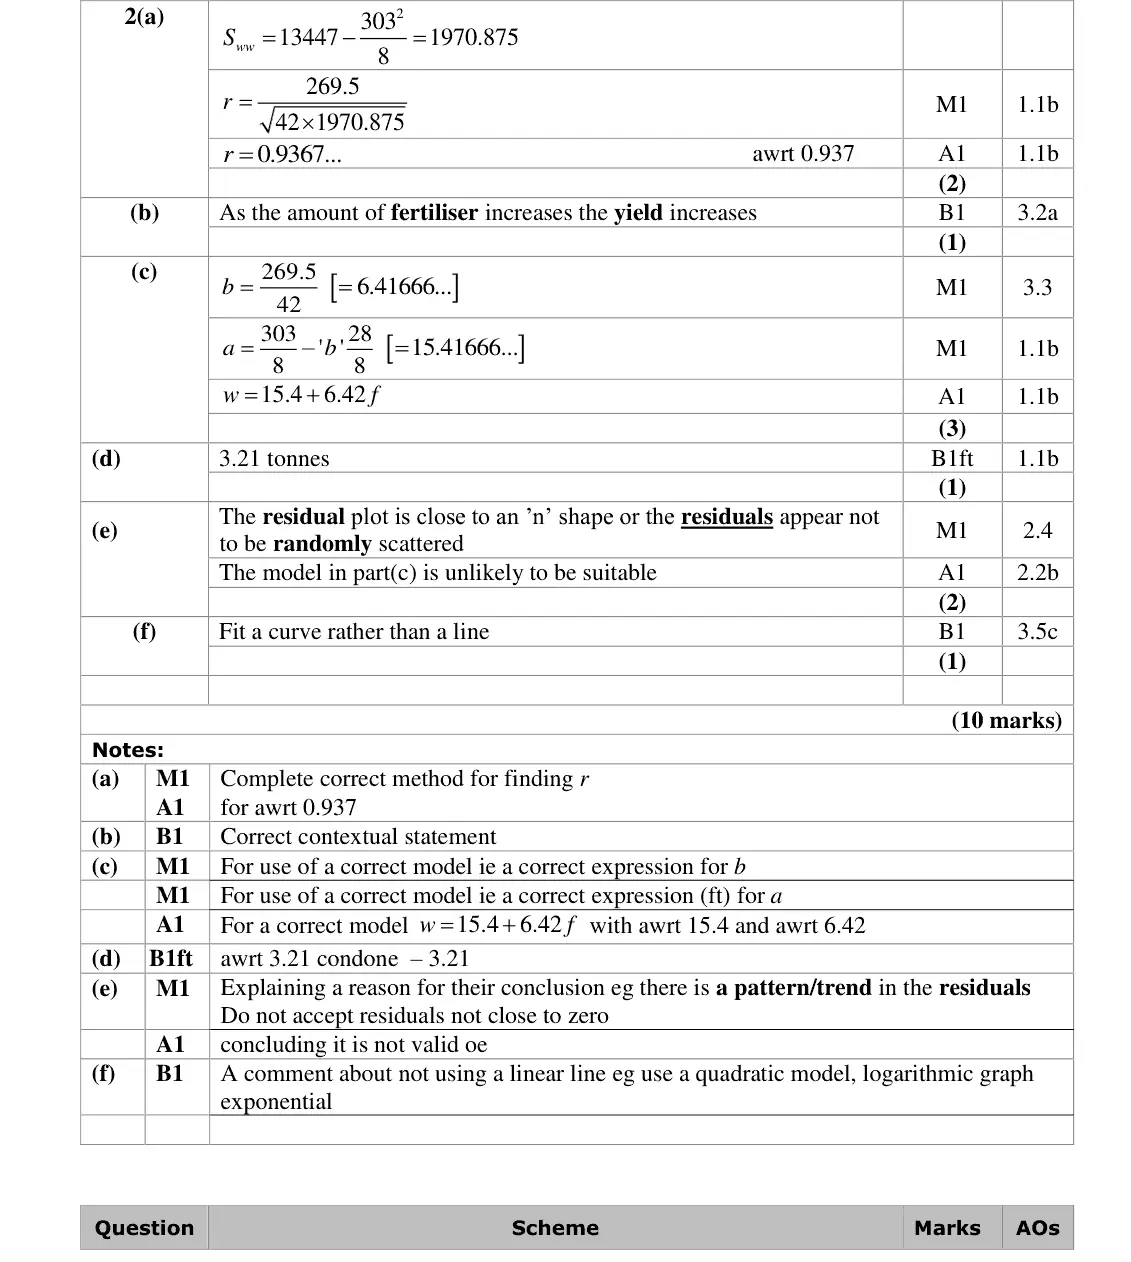
b = Sfw/Sff = 6.4167, a = w̄ − b f̄ = 15.42
w = 15.4 + 6.42f
June 2019 · Paper 4B (Further Statistics 2) · Q2(d)1 mark
Mark scheme (whole question; this part is marked with the orange bar)
Examiner's comment
This question was well answered with the majority of candidates gaining the marks in the first four parts.
Key points from the mark scheme and examiner's report
0.5 × b = 3.21 tonnes
June 2018 · AS Paper 2 (Further Statistics 2) · Q1(b)3 marks
Mark scheme (whole question; this part is marked with the orange bar)
Examiner's comment
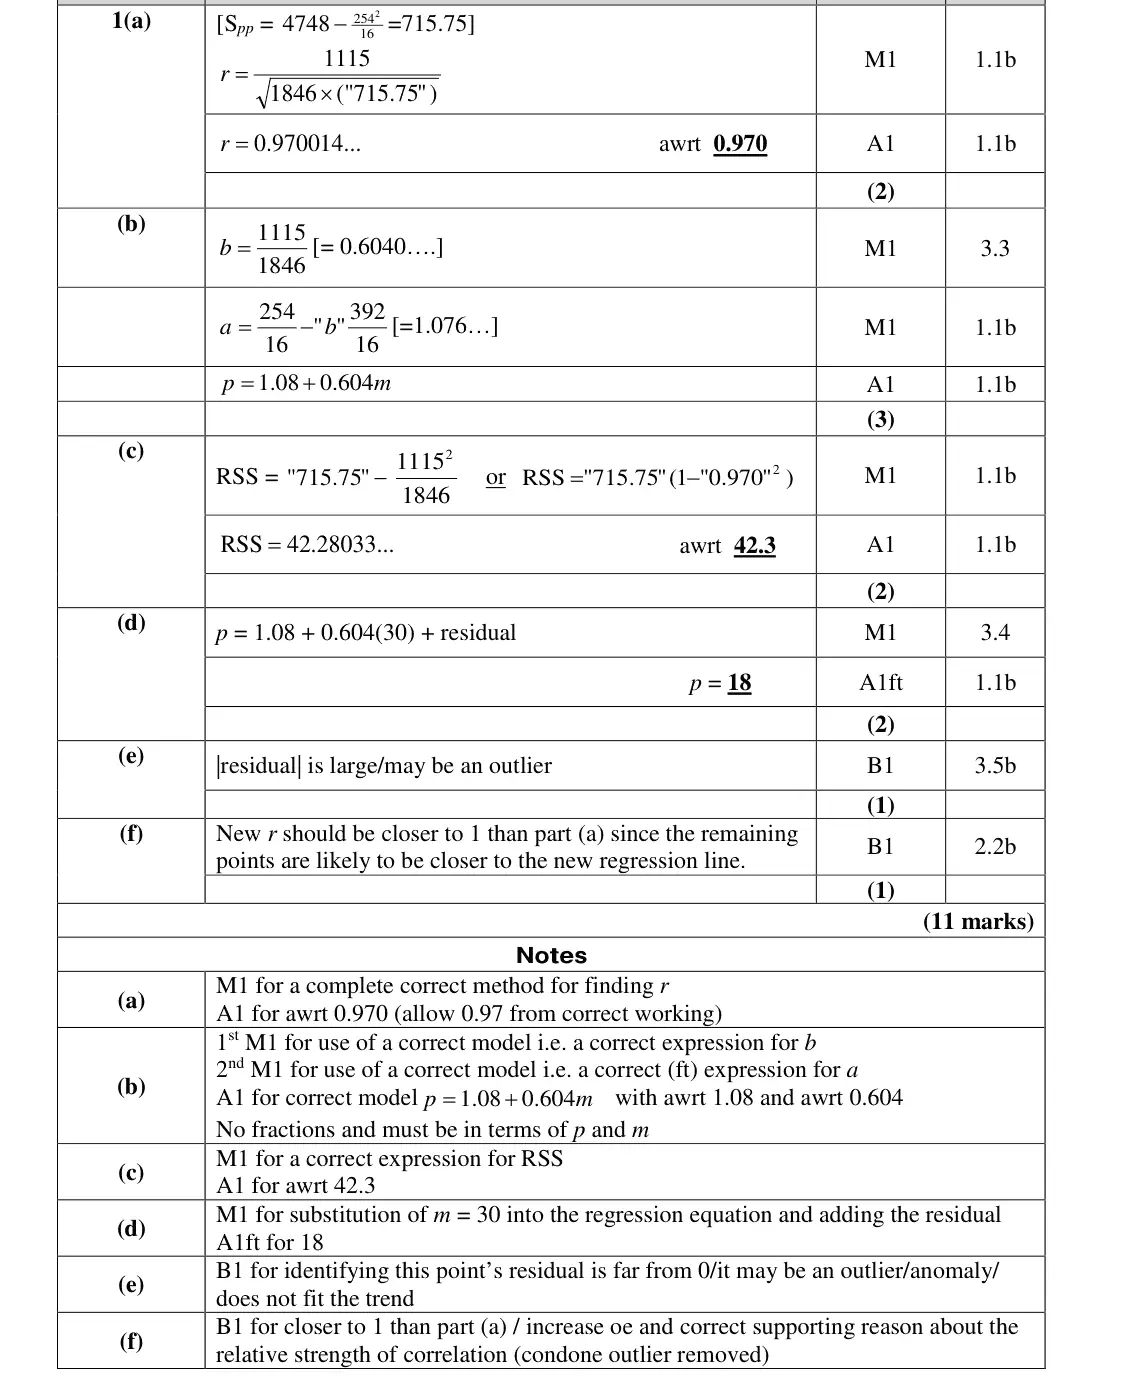
Part (b) was also well attempted with the majority of students being able to work out the correct gradient and intercept for the linear regression model. Here there were greater slips in accuracy for those students not using the accurate value of b when calculating a. Also, some students failed to give their regression equation in terms of the correct variables, p and m. The calculation of the residual sum of squared (RSS) was also standard and most students scored full marks in part (c).
Key points from the mark scheme and examiner's report
b = Smp/Smm = 0.604, a = p̄ − b m̄ = 1.08
p = 1.08 + 0.604m
use the unrounded b for a
must be in terms of p and m, no fractions
June 2018 · AS Paper 2 (Further Statistics 2) · Q1(d)2 marks
Mark scheme (whole question; this part is marked with the orange bar)
Examiner's comment
Part (d) proved to be one of the most challenging parts of the entire paper as students did not realise that they could use the information on the residual plot to determine the exact physics score of the individual who scored 30 marks on the maths test. Most students simply opted to estimate it by using their linear regression equation, neglecting to add on the residual. Generally students were able to give a suitable reason in part (e) as to why the point with the
Key points from the mark scheme and examiner's report
read the residual (−1) off Figure 1 and ADD it to the predicted value: p = 1.08 + 0.604(30) + residual = 18
most just used the regression line and ignored the residual
one of the hardest parts
Find an Edexcel Further Maths tutor
Stuck on this? Book a trial lesson with our Further Maths tutor.