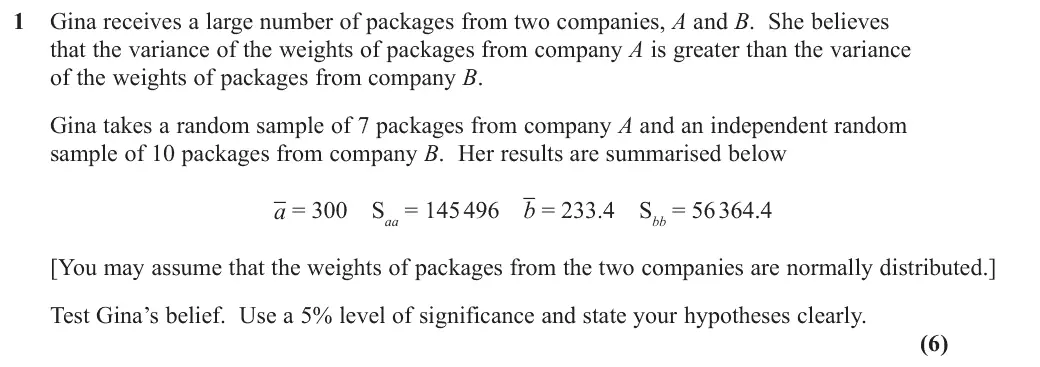
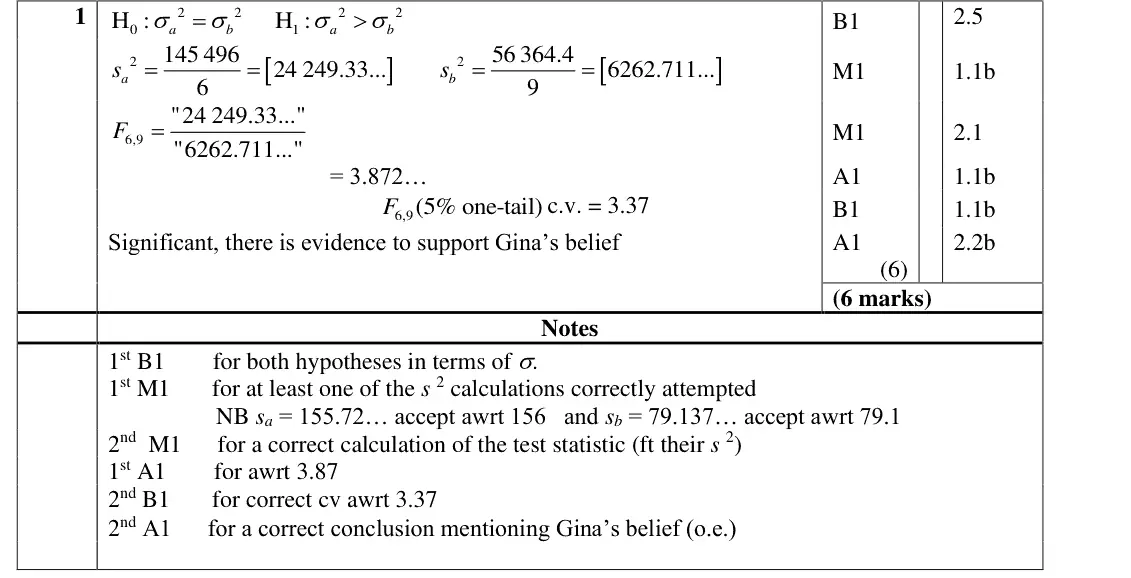
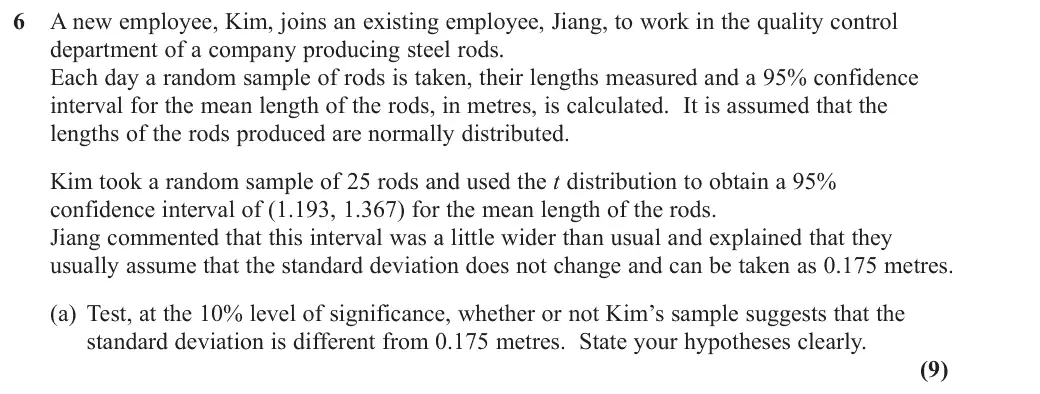
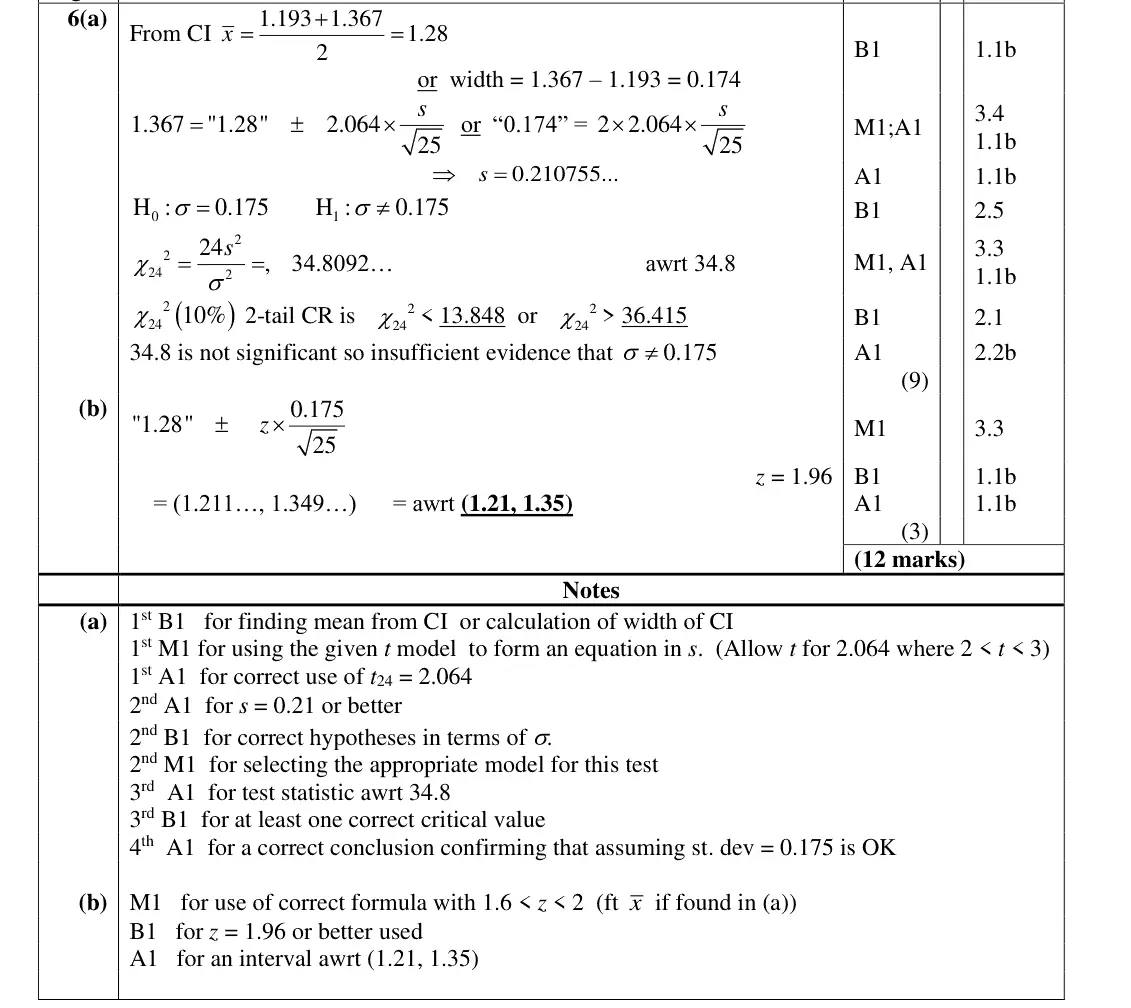
(n − 1)S²/σ² ~ χ² and the F ratio, with both tables, are given.
Since 2018
19 question parts, 79 marks
Notes, worked examples and practice for this topic are being written by our tutors. The past-paper questions below are ready now: work each one on paper, then open the mark scheme and the examiner's comment.
Tap a question to zoom it. Mark scheme and examiner's comment open under each question.
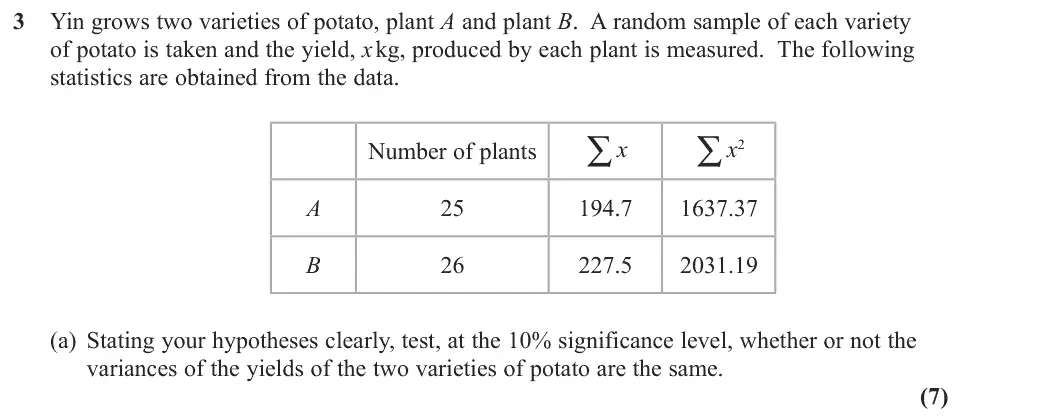
June 2025 · Paper 4B (Further Statistics 2) · Q3(a)4 marks
Mark scheme (whole question; this part is marked with the orange bar)
Examiner's comment
This question required candidates to conduct a test to see whether two variances were the same. Candidates found this question more challenging, so it was rare for full marks to be achieved, usually part (b) being where marks were not scored. In part (a), candidates were usually successful in setting up correct null and alternative hypotheses. The notation for the variance (or standard deviation) was sometimes difficult to decipher, but use of s or s2 was very rare. Candidates then usually attempted to find the correct test statistic, although the main error was in forgetting to use the sample variances instead of the standard deviations. The critical value was usually correct, and candidates usually made a correct comparison between the test statistic and the critical value.
Key points from the mark scheme and examiner's report
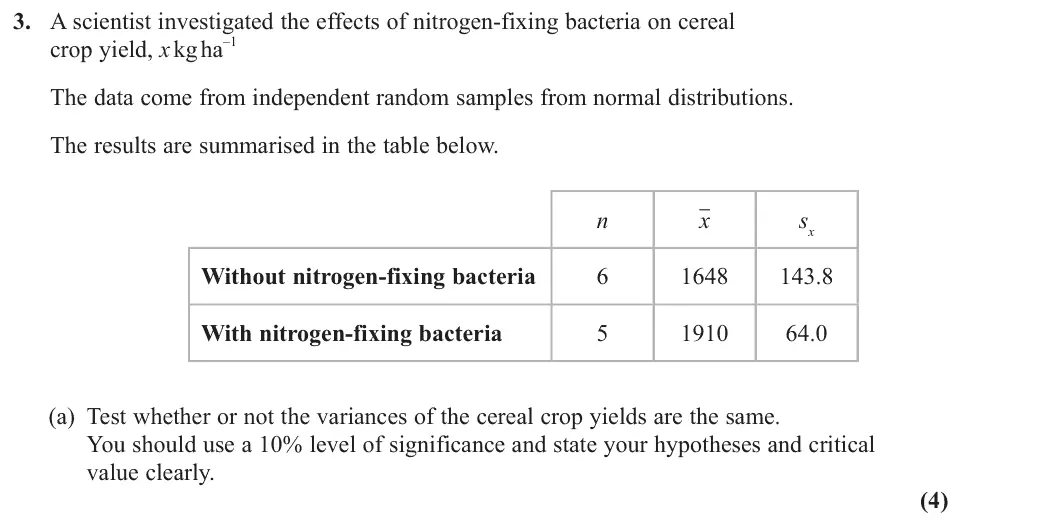
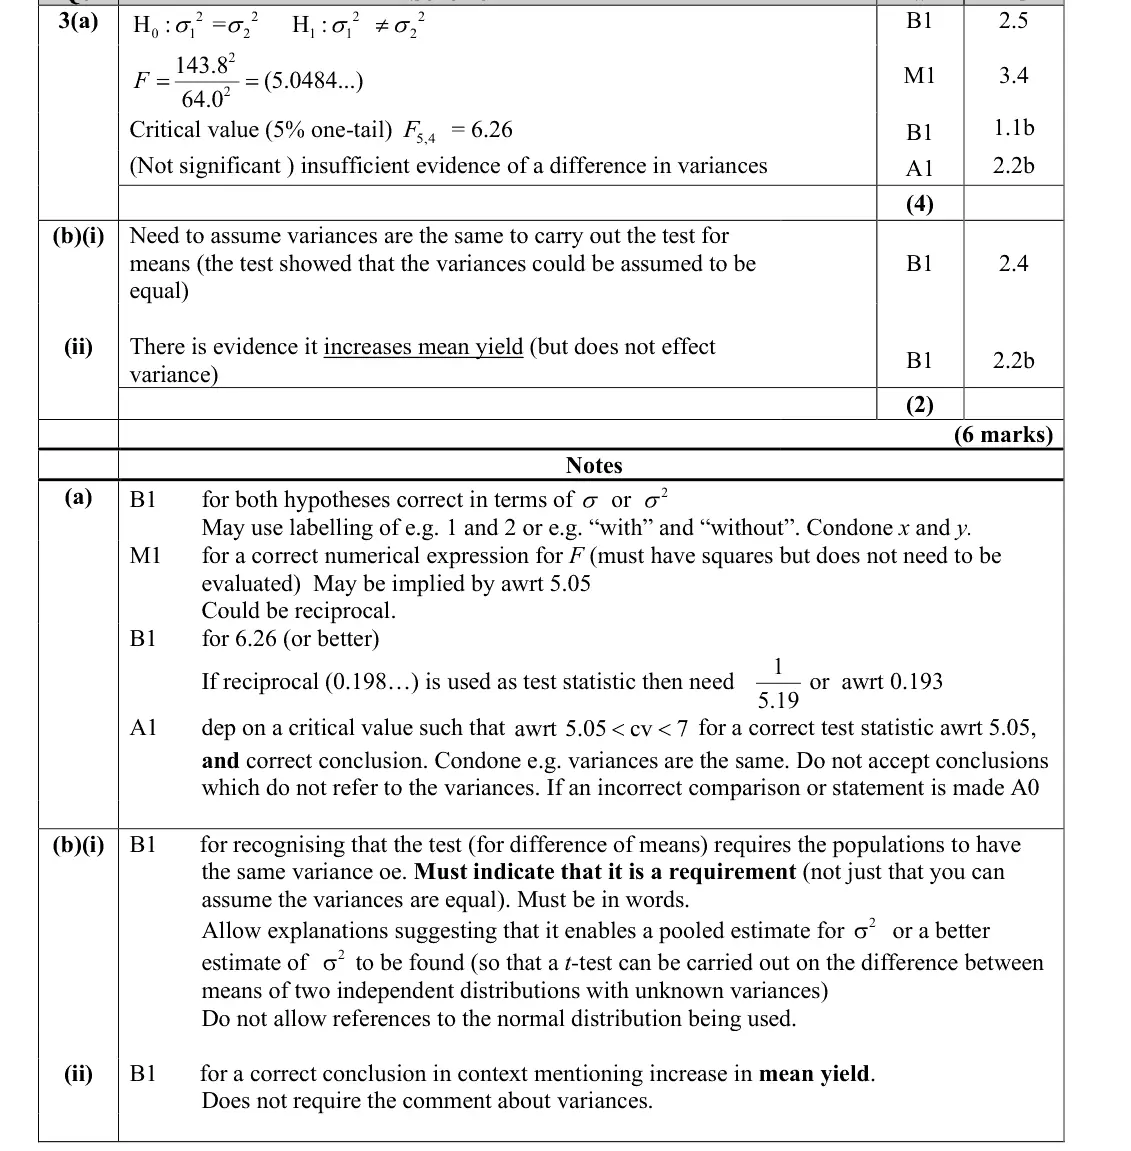
H₀: σ₁² = σ₂², H₁: σ₁² ≠ σ₂²
F = 143.8²/64.0² = 5.05 (square the standard deviations) < F(5,4) upper 5% value 6.26
insufficient evidence variances differ
June 2025 · Paper 4B (Further Statistics 2) · Q3(b)2 marks
Mark scheme (whole question; this part is marked with the orange bar)
Examiner's comment
This question required candidates to conduct a test to see whether two variances were the same. Candidates found this question more challenging, so it was rare for full marks to be achieved, usually part (b) being where marks were not scored. Part (b) was rarely fully correct. Candidates often did not fully answer (b)(i) which required an explanation regarding the importance of the conclusion to the test in (a) with respect to the test carried out on the difference between two means. Just stating you can find a pooled estimate for the population variance was not sufficient without explaining that the variances were equal was a required assumption to carry out the t-test. Some candidates also did not correctly interpret the significance of the p-value, whilst others did not correctly mention the effect on the mean yield (instead of just ‘yield’).
Key points from the mark scheme and examiner's report
(i) the pooled two-sample t-test REQUIRES equal population variances, which (a) supports
just 'can pool' is not enough
(ii) p = 0.002 is very small: evidence the bacteria increase MEAN yield
June 2025 · Paper 4B (Further Statistics 2) · Q4(a)1 mark
Mark scheme (whole question; this part is marked with the orange bar)
Examiner's comment
This question was more demanding and required candidates to carry out a hypothesis test on the variance, as well as constructing a confidence interval. Candidates found this question more demanding, but they were still able to score a high number of the available marks. In part (a), candidates were able to typically find the correct proportion using a normal distribution. It was usually only incorrect rounding which was the only error here.
Key points from the mark scheme and examiner's report
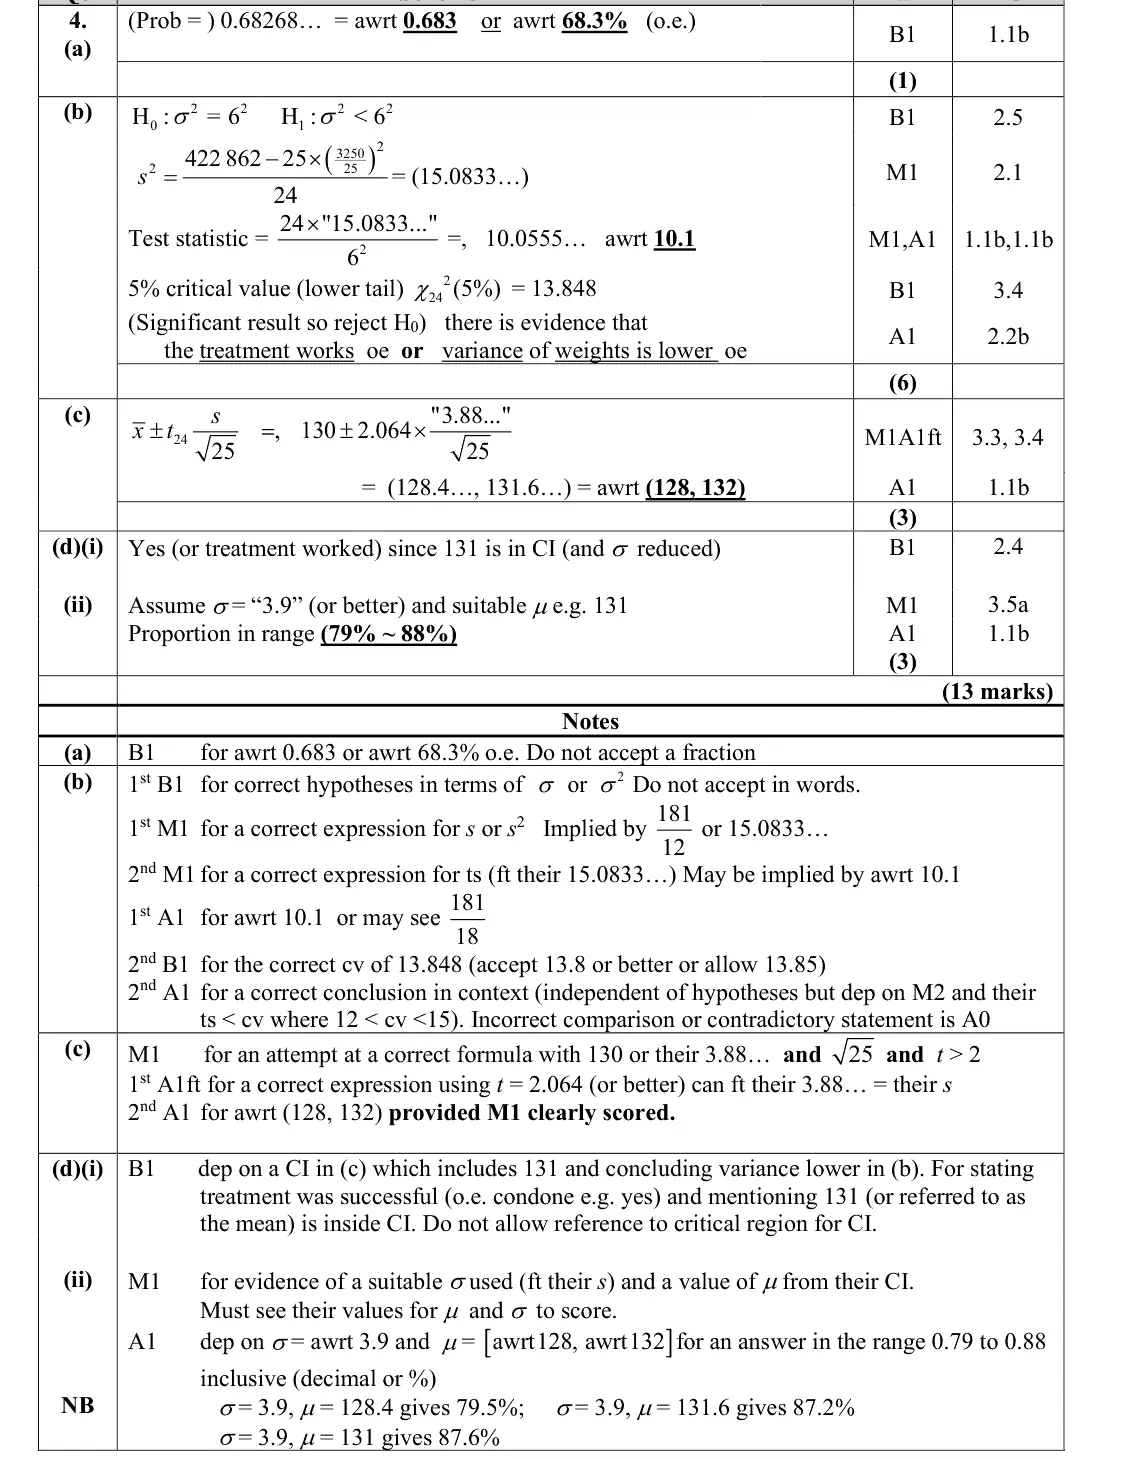
normal probability P(125 < X < 137) = 0.683 (A-level Maths skill
sets up the comparison in (d))
June 2025 · Paper 4B (Further Statistics 2) · Q4(b)6 marks
Mark scheme (whole question; this part is marked with the orange bar)
Examiner's comment
This question was more demanding and required candidates to carry out a hypothesis test on the variance, as well as constructing a confidence interval. Candidates found this question more demanding, but they were still able to score a high number of the available marks. In part (b), candidates were usually successful in setting the correct null and alternative hypotheses. It was unfortunate that sigma and 6 looked very similar in some responses, although this was condoned (rather than it being regarded as test for the difference between two variances). Candidates usually found a correct unbiased estimate for the variance, although some used an incorrect formula, or divided by n instead of 1 n -. The critical value found was sometimes found for the wrong tail (instead of the lower required tail). Some candidates also not realising that the test statistic was lower than the critical value in this case meant that there was sufficient evidence that the variance of the weights was lower. Giving a correct conclusion in context also resulted in a mark lost with the word ‘weight’ omitted in some cases.
Key points from the mark scheme and examiner's report
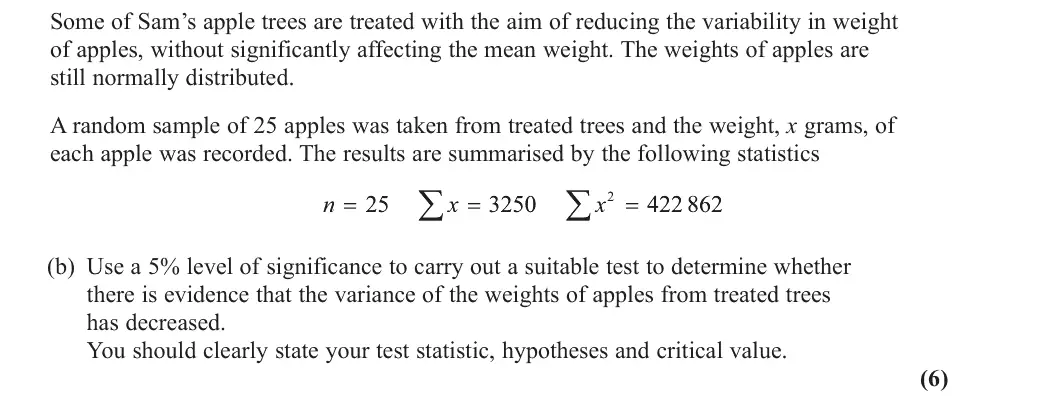
H₀: σ² = 36, H₁: σ² < 36
s² = (422862 − 25 × 130²)/24 = 15.08 (divide by n − 1)
24s²/36 = 10.06 < lower 5% χ²₂₄ value 13.848, so evidence the variance of weights has decreased
wrong tail was common
June 2025 · Paper 4B (Further Statistics 2) · Q4(d)3 marks
Mark scheme (whole question; this part is marked with the orange bar)
Examiner's comment
This question was more demanding and required candidates to carry out a hypothesis test on the variance, as well as constructing a confidence interval. Candidates found this question more demanding, but they were still able to score a high number of the available marks. Part (d)(i) was not often fully answered with candidates not using the data to support their conclusion fully. Candidates needed to state that 131 was in the confidence interval, however, it was often omitted from their explanations. In part (d)(ii), it was pleasing to see so many candidates who recognised the need to use their unbiased estimate for the variance as well as a suitable value for the mean (often 130 was chosen here). Many candidates scored both marks, although not stating the two parameters they had chosen resulted in no method shown and no marks awarded.
Key points from the mark scheme and examiner's report
(i) yes: variance reduced in (b) and 131 lies inside the CI so mean unchanged (131 must be mentioned)
(ii) use σ ≈ 3.9 and μ ≈ 131 (or 130): P(125 < X < 137) ≈ 79%–88%
state the parameters used
June 2024 · Paper 4B (Further Statistics 2) · Q3(b)3 marks
Mark scheme (whole question; this part is marked with the orange bar)
Examiner's comment
(b), many candidates erroneously found a lower limit for the variance, selected an incorrect value from the chi-squared distribution or made errors manipulating their equation or inequality S 2 when proceeding to Some candidates forgot to square the standard deviation that was ... given in the question. A few found a confidence interval instead of a critical region. struggled as their incorrectly found critical region in part (b) resulted in them having to make inconsistent conclusions.
Key points from the mark scheme and examiner's report
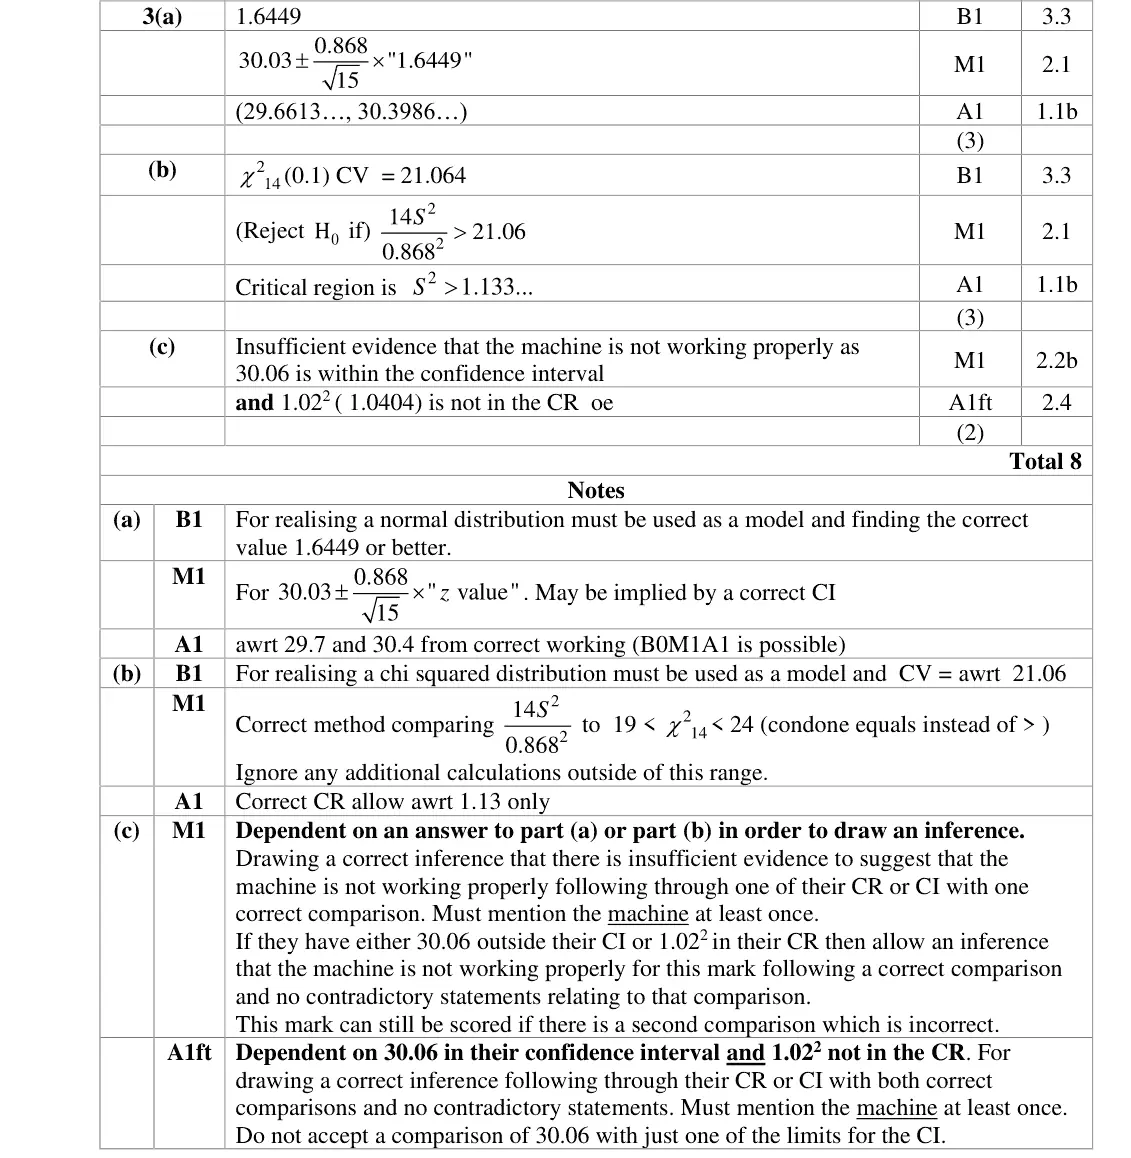
upper tail χ²₁₄ 10% value 21.064
14S²/0.868² > 21.064 gives critical region S² > 1.133
errors: lower tail, wrong χ² value, not squaring 0.868, finding a CI instead
June 2024 · Paper 4B (Further Statistics 2) · Q3(c)2 marks
Mark scheme (whole question; this part is marked with the orange bar)
Examiner's comment
approach compared a standard deviation to a variance in (c) so did not score full marks. Part (c) caused a number of issues for many candidates. Quite often candidates failed to either square the standard deviation to compare with the critical region, or they did not square the variance from (b) to make a correct comparison. Some explanations lacked clarity in the inference that was being made or lacked any contextual interpretation. Other candidates struggled as their incorrectly found critical region in part (b) resulted in them having to make
Key points from the mark scheme and examiner's report
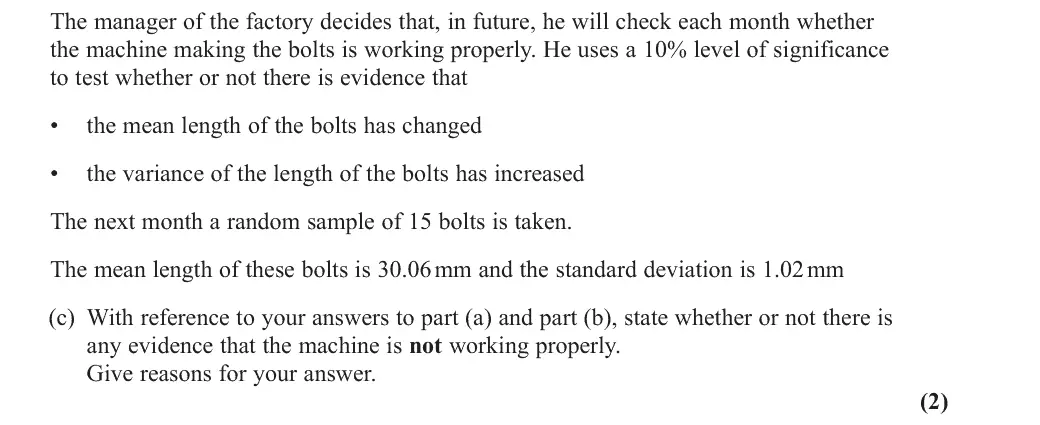
30.06 lies in the CI and 1.02² = 1.0404 is not in the CR, so no evidence the machine is not working properly
must square the s.d. before comparing
mention the machine
June 2023 · Paper 4B (Further Statistics 2) · Q3(a)4 marks
Mark scheme (whole question; this part is marked with the orange bar)
Examiner's comment
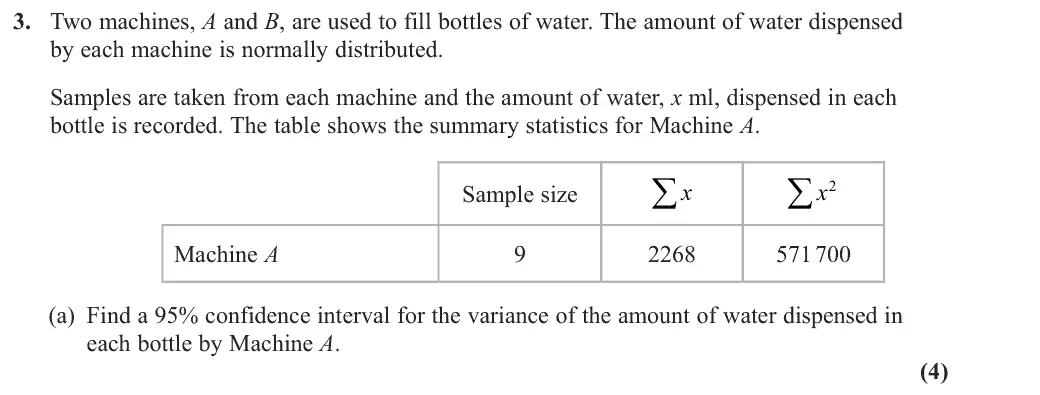
chi-squared distribution and gained at most 1 mark out of 4 in part (a). The vast majority did use the correct distribution and went on to gain all the marks in (a). Almost all candidates were able to gain the mark for a correct sample variance regardless of which distribution they used. Almost all candidates stated correct hypotheses in (b). Most were familiar with the process of
Key points from the mark scheme and examiner's report
June 2023 · Paper 4B (Further Statistics 2) · Q3(b)4 marks
Mark scheme (whole question; this part is marked with the orange bar)
Examiner's comment
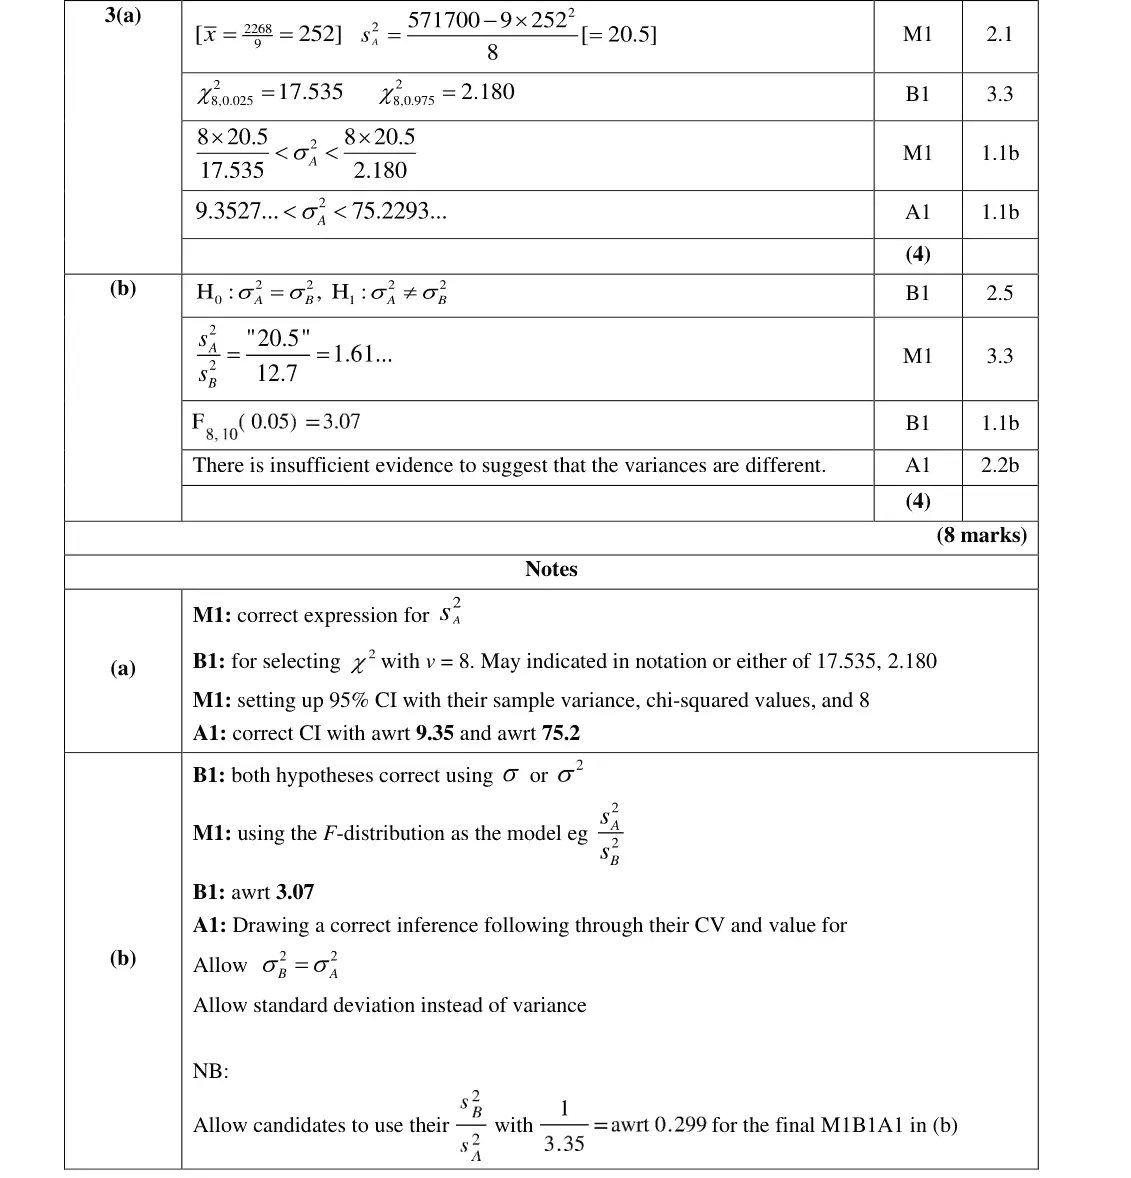
Almost all candidates stated correct hypotheses in (b). Most were familiar with the process of hypothesis testing for the variance, and as such gained all the marks here. A few candidates tested the lower tail; however, while this is an acceptable approach, candidates testing the upper tail appeared more likely to be able to execute their chosen method correctly.
Key points from the mark scheme and examiner's report
H₀: σA² = σB², H₁: σA² ≠ σB²
F = 20.5/12.7 = 1.61 < F(8,10) upper 5% value 3.07, insufficient evidence variances differ
testing the upper tail is easier
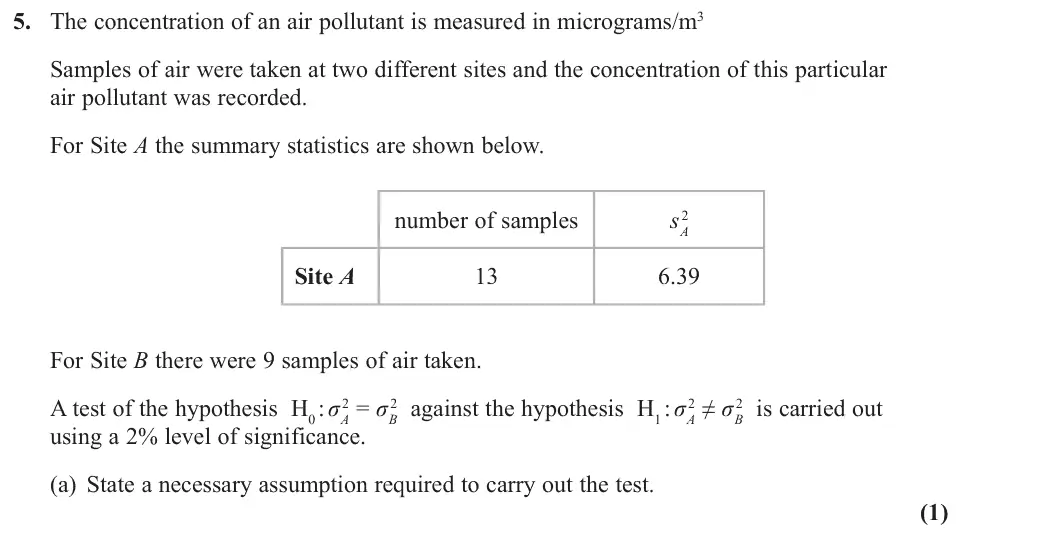
June 2022 · Paper 4B (Further Statistics 2) · Q5(a)1 mark
Mark scheme (whole question; this part is marked with the orange bar)
Examiner's comment
In general, candidates did not engage with the context of the question in part (a) and many lost the mark for answers which were too vague. Candidates should be made aware that just saying “it must be normally distributed” will not gain the mark.
Key points from the mark scheme and examiner's report
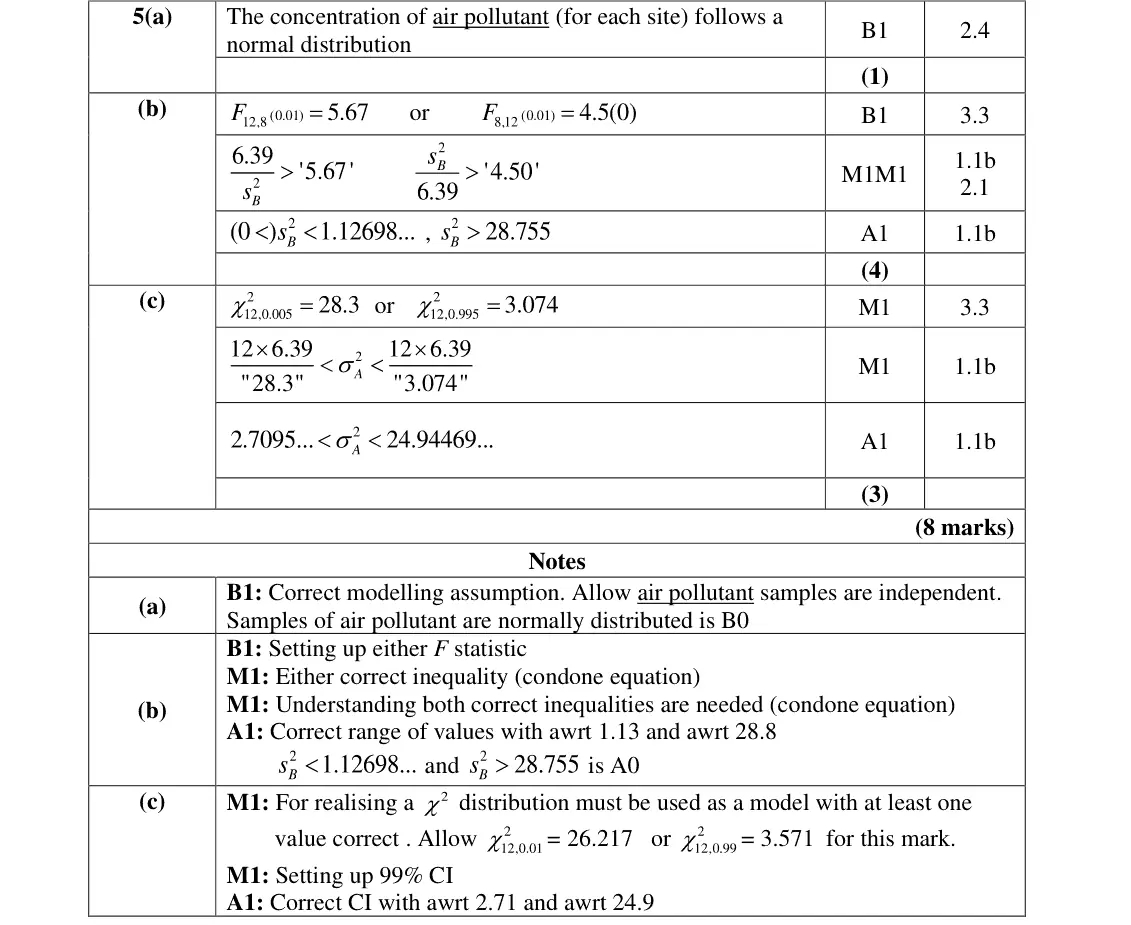
the concentrations of air pollutant at each site are normally distributed (or samples independent)
'samples are normally distributed' or vague answers score 0
June 2022 · Paper 4B (Further Statistics 2) · Q5(b)4 marks
Mark scheme (whole question; this part is marked with the orange bar)
Examiner's comment
Part (b) was generally well attempted. One common error was to only find one tail of the critical region. Another common error was to write the word ‘and’ in between their two sets essentially stating it was the intersection of the two regions.
Key points from the mark scheme and examiner's report
two-tailed 2%: F(12,8) 1% value 5.67 and F(8,12) 1% value 4.50
6.39/sB² > 5.67 or sB²/6.39 > 4.50: sB² < 1.127 or sB² > 28.755 (union, not 'and')
finding only one tail was common
June 2022 · Paper 4B (Further Statistics 2) · Q5(c)3 marks
Mark scheme (whole question; this part is marked with the orange bar)
Examiner's comment
Part (c) had a greater success rate and many fully correct responses were seen.
Key points from the mark scheme and examiner's report
24s²/0.175² = 34.8, not in CR (χ²₂₄ < 13.848 or > 36.415), so no evidence σ has changed
June 2019 · Paper 4B (Further Statistics 2) · Q3(a)7 marks
Mark scheme (whole question; this part is marked with the orange bar)
Examiner's comment
This question was well answered with the majority of candidates gaining the marks in part (a). The main error that occurred was writing the hypotheses in terms of the wrong parameter.
Key points from the mark scheme and examiner's report
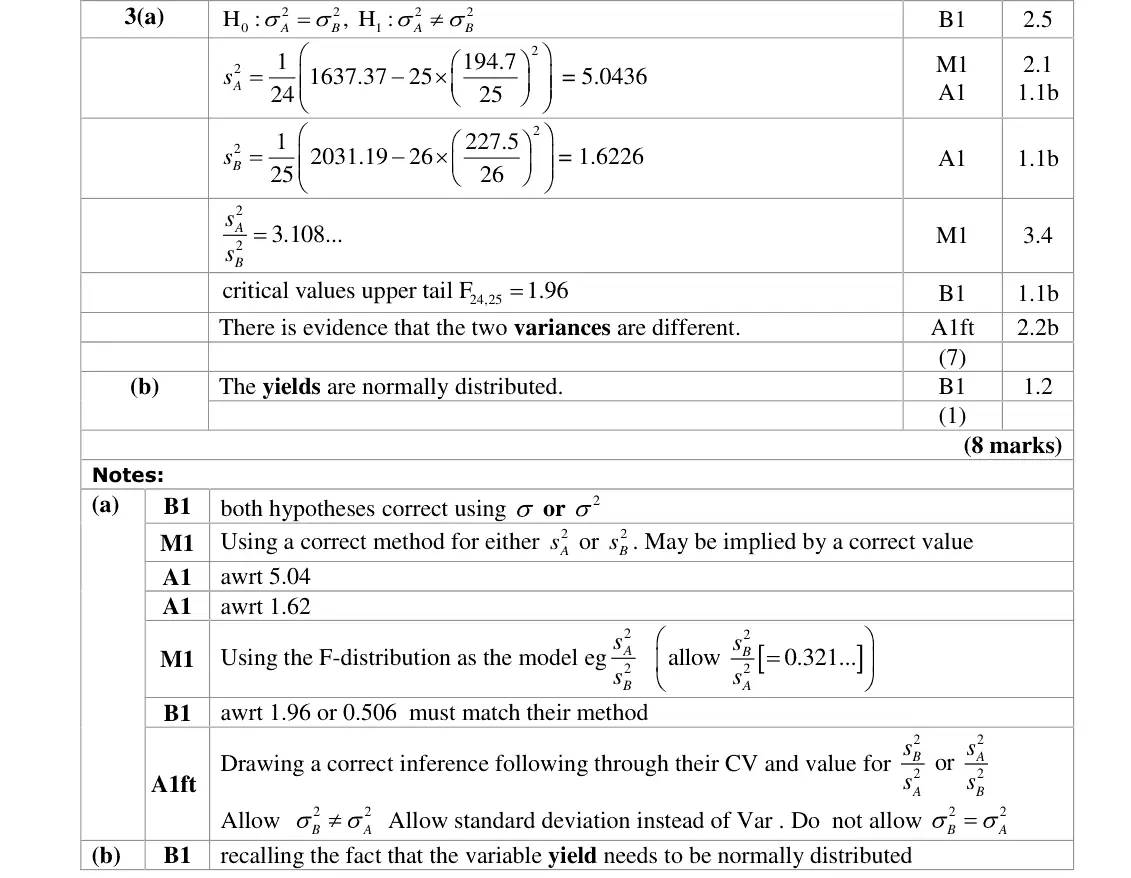
H₀: σA² = σB², H₁: σA² ≠ σB² (two-tailed)
sA² = 5.04, sB² = 1.62
F = 3.108 > F(24,25) upper 5% value 1.96, so variances differ
common error: hypotheses in terms of the wrong parameter
June 2019 · Paper 4B (Further Statistics 2) · Q3(b)1 mark
Mark scheme (whole question; this part is marked with the orange bar)
Examiner's comment
Part (b) was not quite so well answered. Many candidates knew that something had to be normally distributed but few realised that it was the yield that was assumed to be normally distributed. candidates should be made aware that just saying “it must be normally distributed” will not gain the mark.
Key points from the mark scheme and examiner's report
the yields (of each variety) are normally distributed
just "it is normally distributed" scores 0
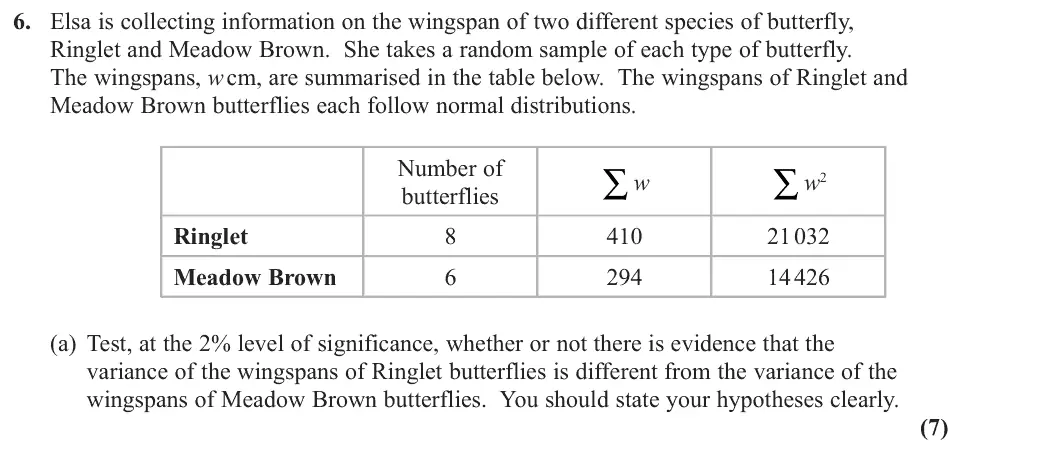
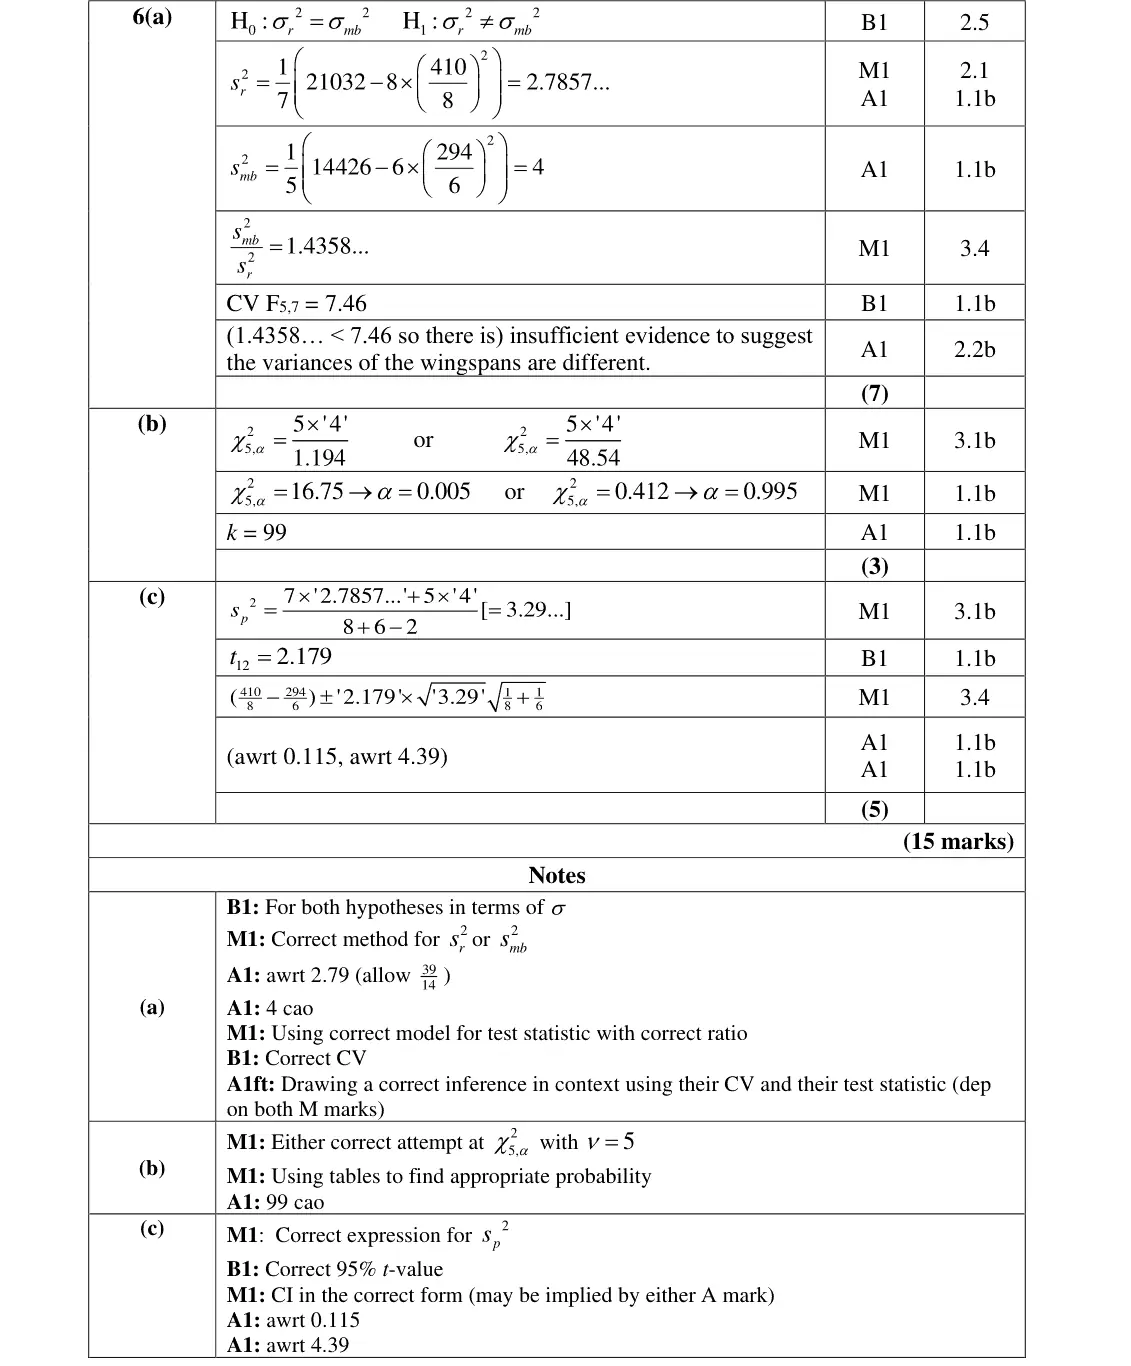
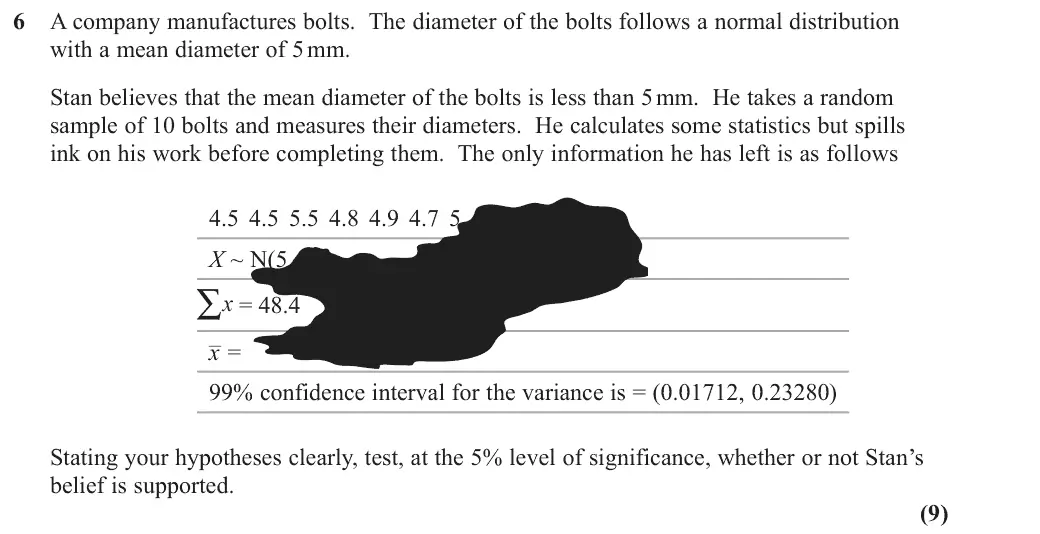
June 2019 · Paper 4B (Further Statistics 2) · Q69 marks
Mark scheme (whole question; this part is marked with the orange bar)
Examiner's comment
This question proved to be challenging for some. Candidates generally knew the test they needed to use but struggled to find a value for the unbiased estimator of sigma . The main loss of marks for those who realised that they had been given the confidence interval for the variance was to either not show the 2 value they had used or not show a method at all followed by a value for s that was inaccurate. The most common error was to think that the confidence interval was in fact for the mean rather than the variance. The marks they could then achieve depended on whether they had found s or sigma
Key points from the mark scheme and examiner's report
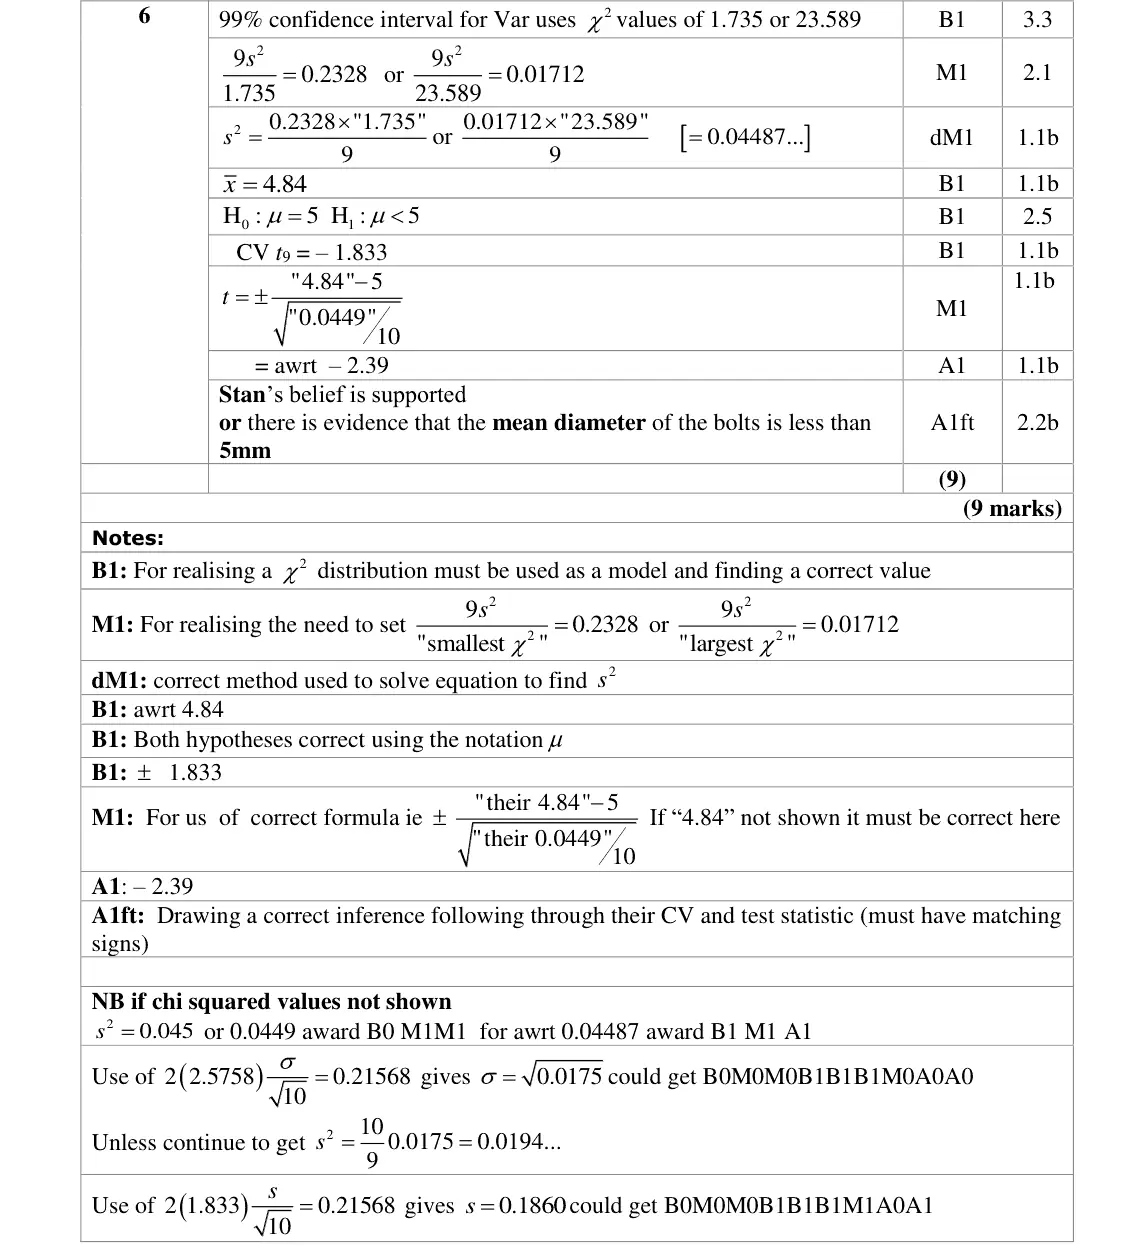
the given 99% interval is for the VARIANCE: 9s²/1.735 = 0.2328 so s² = 0.0449
x̄ = 4.84
H₀: μ = 5, H₁: μ < 5
t = −2.39 < −1.833 (t₉), Stan's belief supported
commonest error treating the interval as one for the mean
show the χ² values used
Find an Edexcel Further Maths tutor
Stuck on this? Book a trial lesson with our Further Maths tutor.