FS2.6.2 Hypothesis test that two independent random samples are from…

Section
FS2.6 Other Hypothesis Tests and confidence intervals
Level
A level only
Statement
Hypothesis test that two independent random samples are from Normal populations with equal variances.
Guidance
Use of S₁²/S₂² ~ F(n₁ − 1, n₂ − 1) under H₀. Candidates may use tables of the F-distribution or their calculators to find critical values or p-values.
Since 2018
9 parts, 36 marks · topic pages: Variance tests: chi-squared and F-distribution, The t-distribution: t-tests and paired t-tests

Back to the checklist

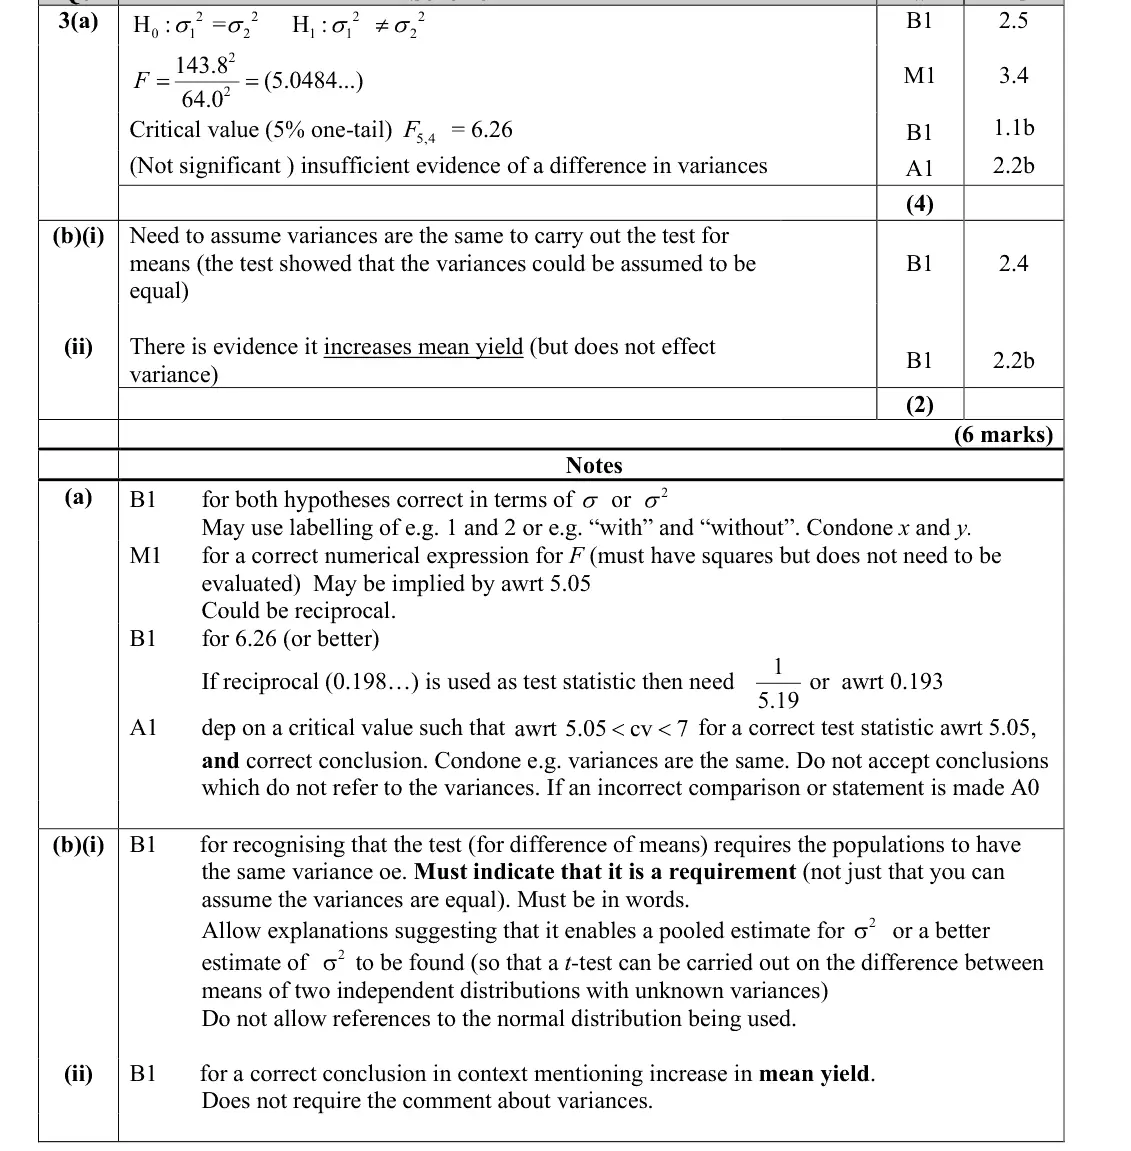
June 2025 · Paper 4B (Further Statistics 2) · Q3(a) 4 marks
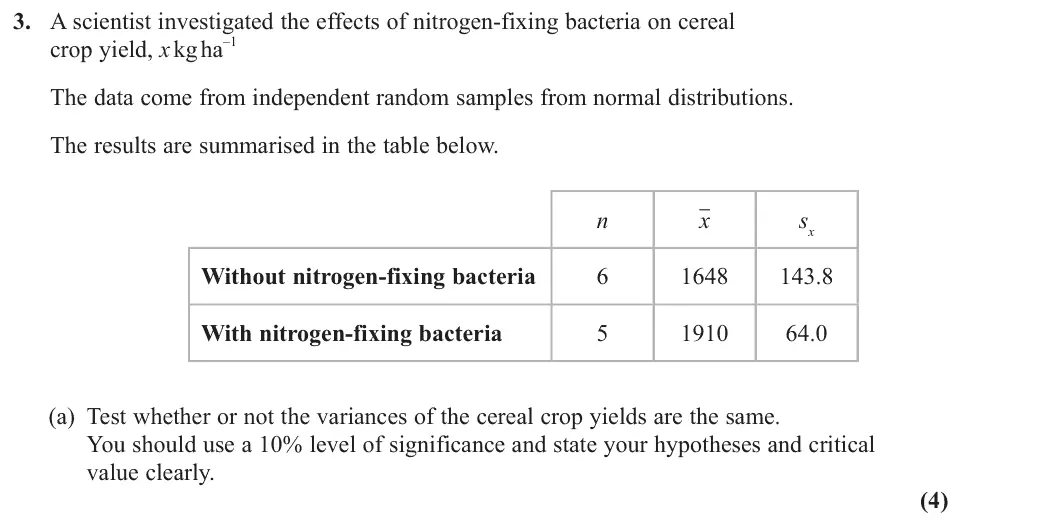
3. A scientist investigated the effects of nitrogen-fixing bacteria on cereal crop yield, x kg ha –1 The data come from independent random samples from normal distributions. The results are summarised in the table below. n x sx Without nitrogen-fixing bacteria 1648 143.8 With nitrogen-fixing bacteria 1910 64.0 (a) Test whether or not the variances of the cereal crop yields are the same. You should use a 10% level of significance and state your hypotheses and critical value clearly. (4)
June 2025 · Paper 4B (Further Statistics 2) · Q3(b) 2 marks
A suitable test to determine whether there is an increase in mean cereal crop yield has a p-value of 0.002 (b) (i) Explain the importance of the conclusion of the test in part (a) to this test. (ii) Comment on the effectiveness of nitrogen-fixing bacteria on cereal crop yields. (2)
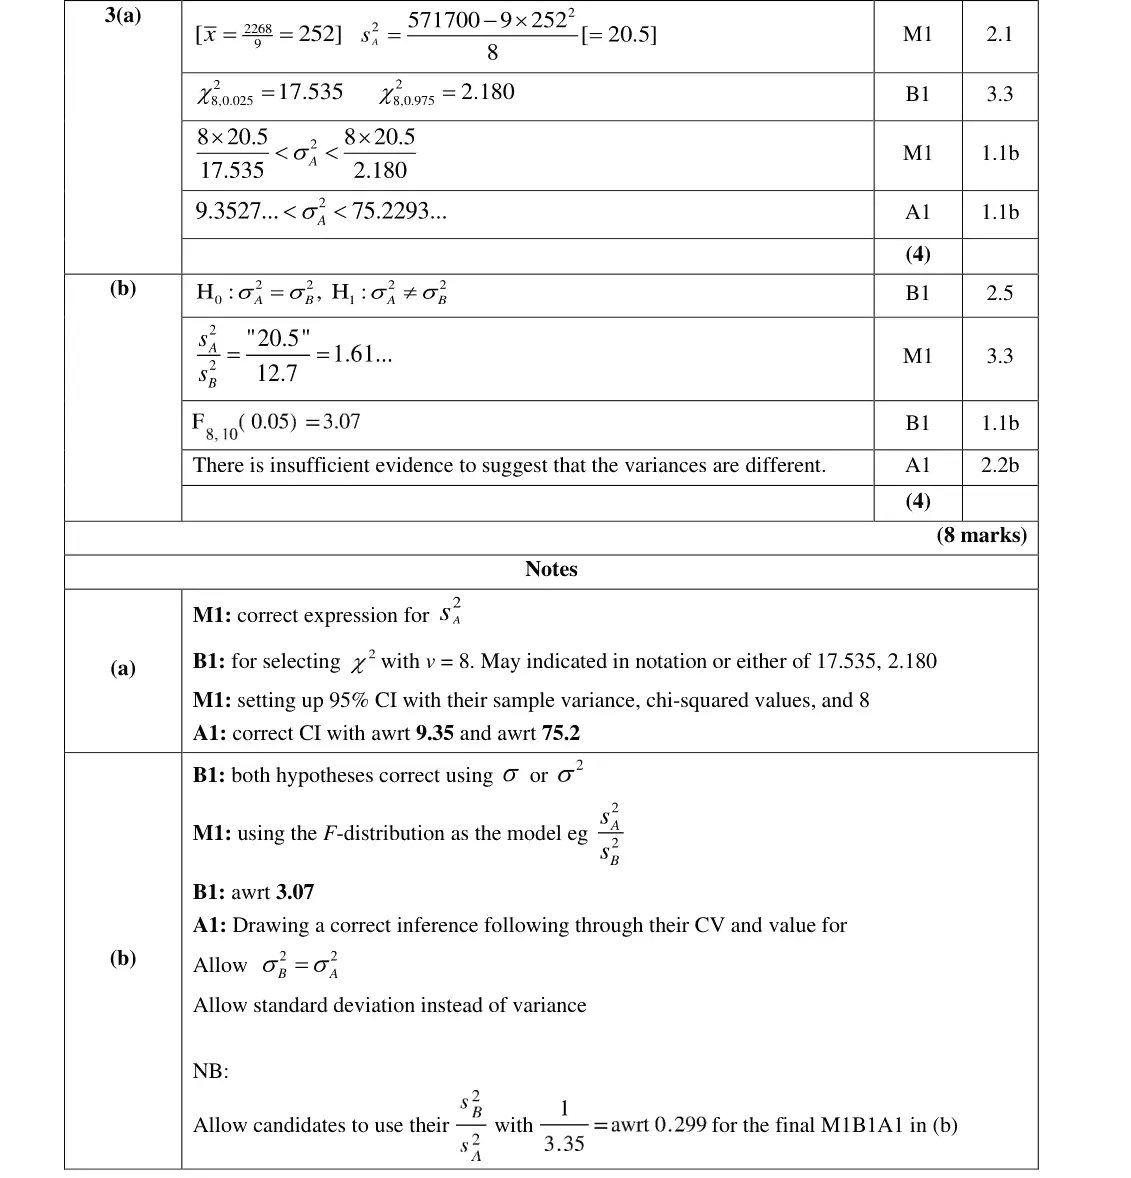
June 2023 · Paper 4B (Further Statistics 2) · Q3(b) 4 marks
For Machine B, a random sample of 11 bottles is taken. The sample variance of the amount of water dispensed in bottles is 12.7 ml2 (b) Test, at the 10% level of significance, whether there is evidence that the variances of the amounts of water dispensed in bottles by the two machines are different. You should state the hypotheses and the critical value used. (4)
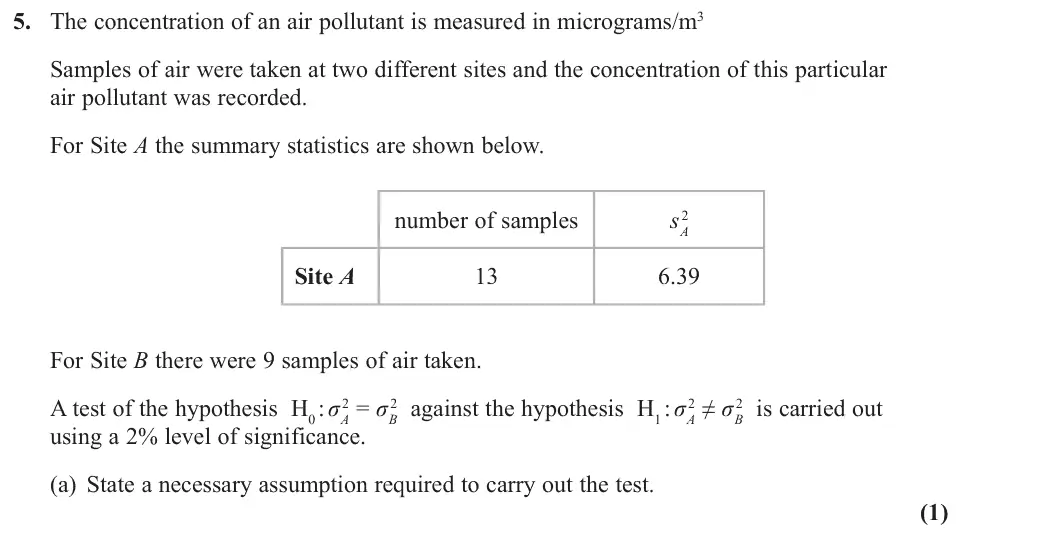
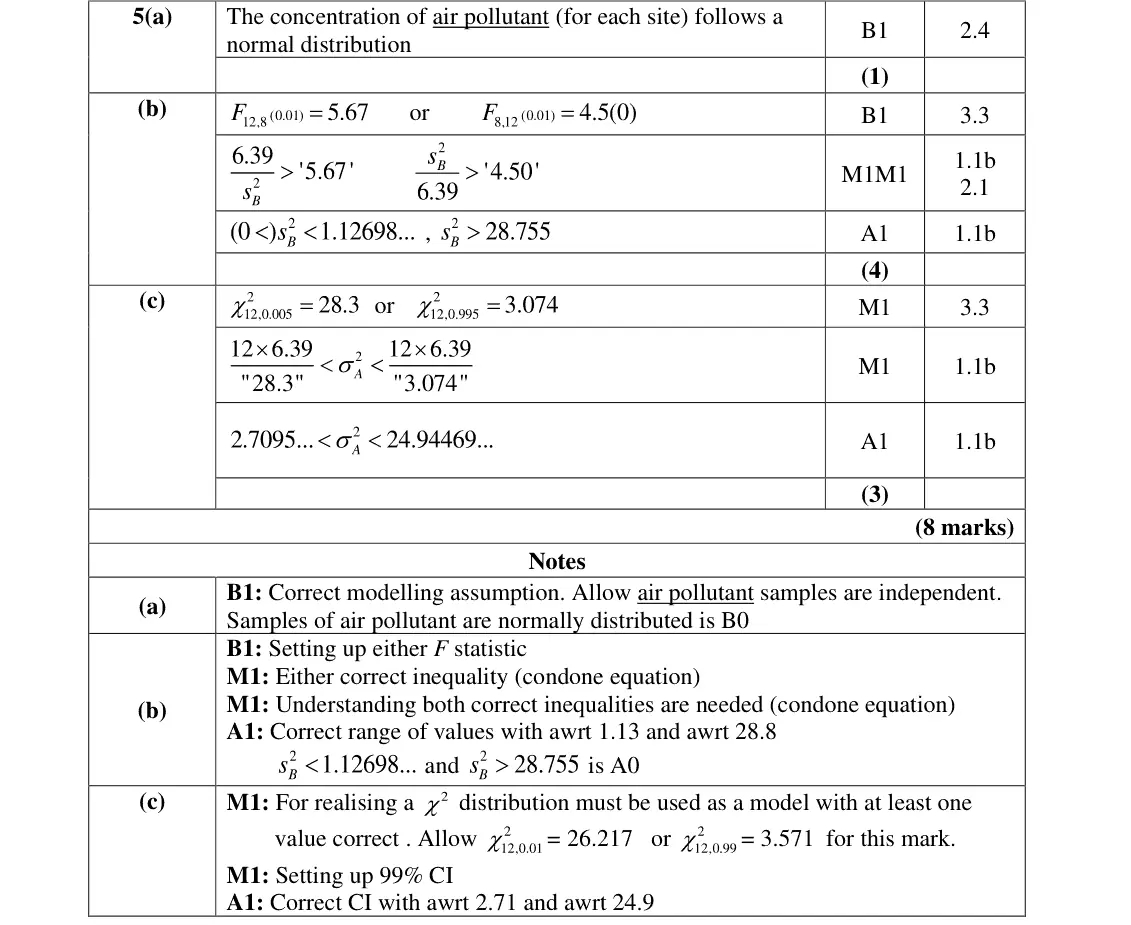
June 2022 · Paper 4B (Further Statistics 2) · Q5(a) 1 mark
5. The concentration of an air pollutant is measured in micrograms/m3 Samples of air were taken at two different sites and the concentration of this particular air pollutant was recorded. For Site A the summary statistics are shown below. number of samples s 2 A Site A 6.39 For Site B there were 9 samples of air taken. A test of the hypothesis H0 : sigma 2 A = sigma 2 B against the hypothesis H1 : sigma 2 A ≠ sigma 2 B is carried out using a 2% level of significance. (a) State a necessary assumption required to carry out the test. (1)
June 2022 · Paper 4B (Further Statistics 2) · Q5(b) 4 marks
Given that the assumption in part (a) holds, (b) find the set of values of s 2 B that would lead to the null hypothesis being rejected, (4)
Nov 2021 · Paper 4B (Further Statistics 2) · Q6(a) 7 marks
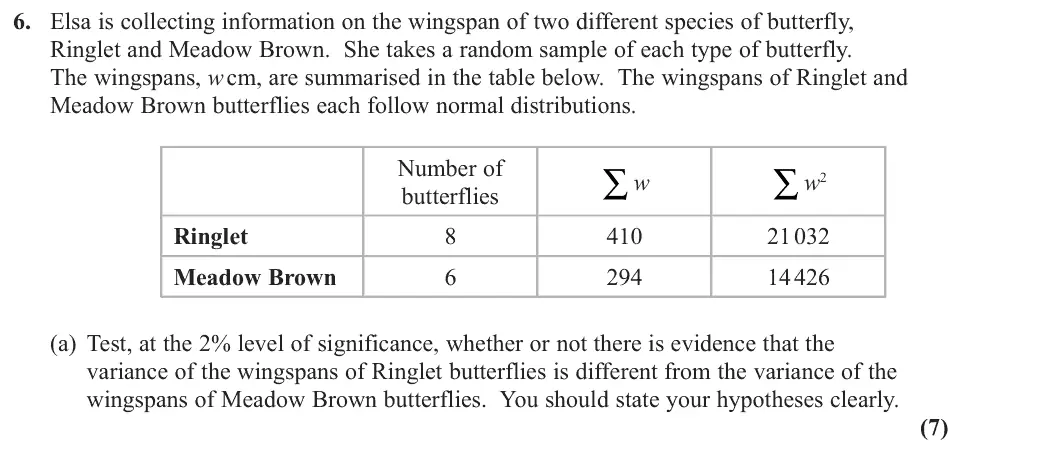
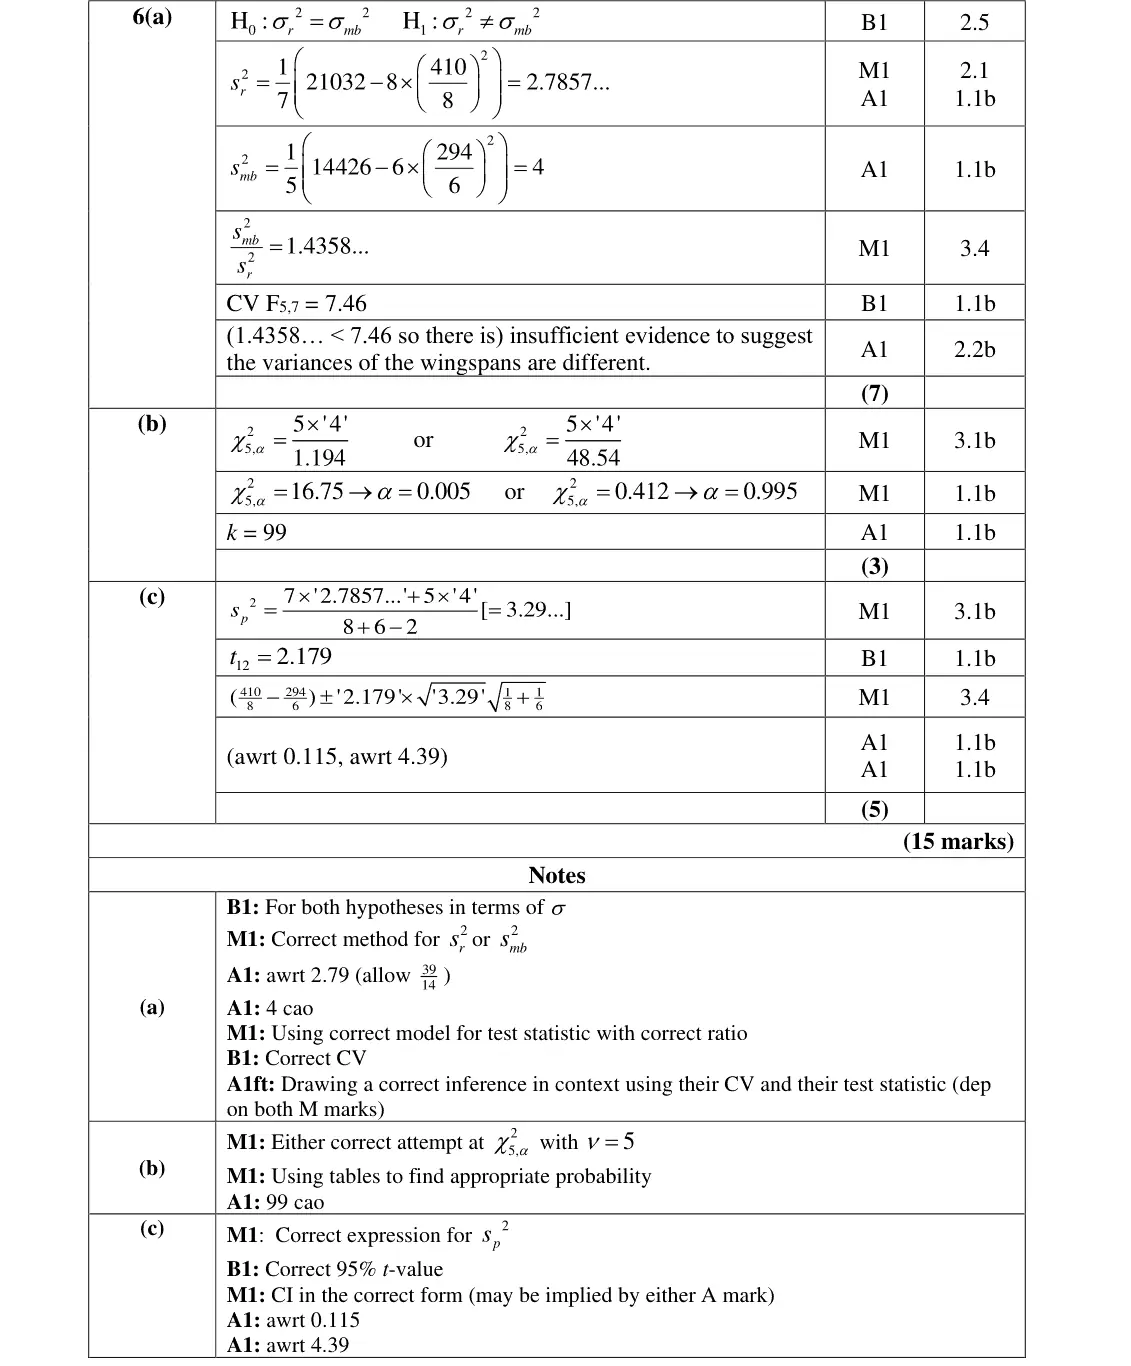
6. Elsa is collecting information on the wingspan of two different species of butterfly, Ringlet and Meadow Brown. She takes a random sample of each type of butterfly. The wingspans, w cm, are summarised in the table below. The wingspans of Ringlet and Meadow Brown butterflies each follow normal distributions. Number of ∑w ∑w2 butterflies Ringlet 21 032 Meadow Brown 14 426 (a) Test, at the 2% level of significance, whether or not there is evidence that the variance of the wingspans of Ringlet butterflies is different from the variance of the wingspans of Meadow Brown butterflies. You should state your hypotheses clearly. (7)
Oct 2020 · Paper 4B (Further Statistics 2) · Q1 6 marks
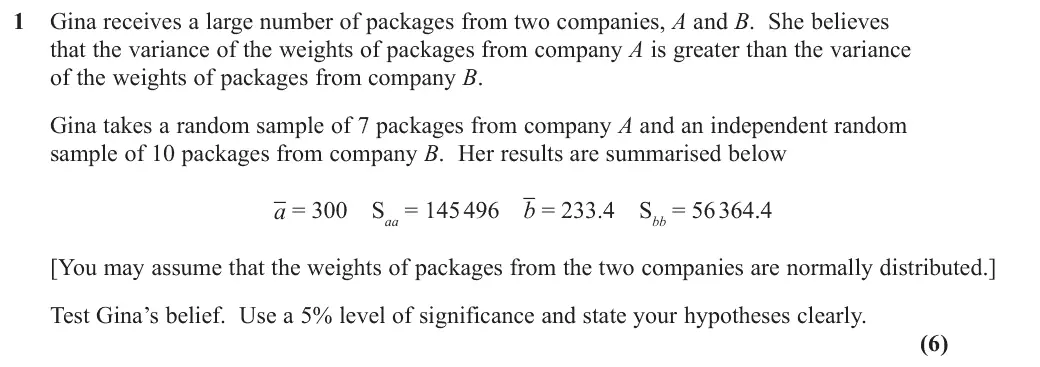
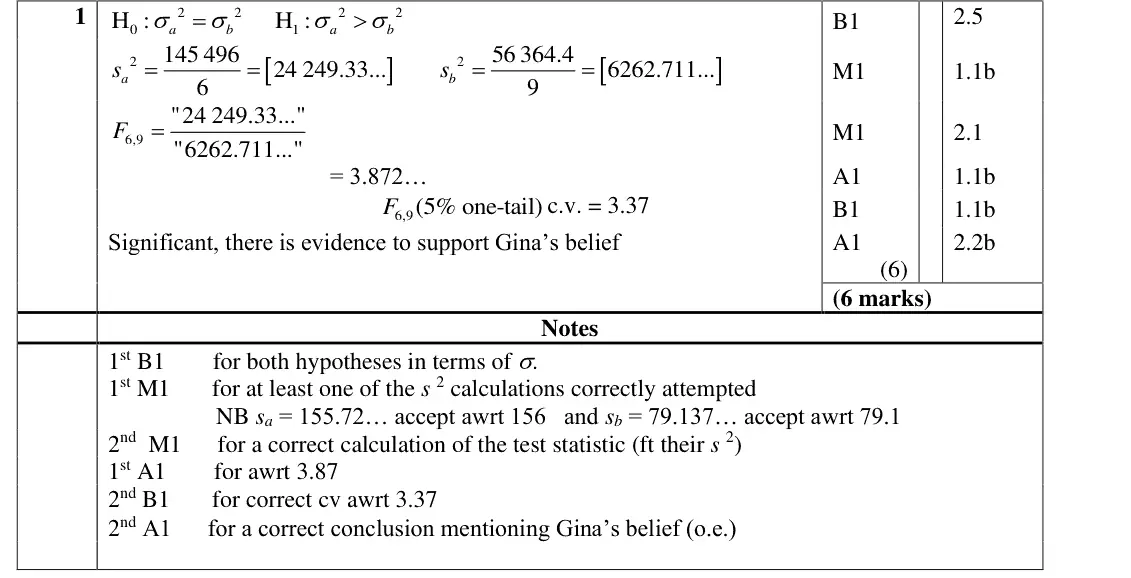
1 Gina receives a large number of packages from two companies, A and B. She believes that the variance of the weights of packages from company A is greater than the variance of the weights of packages from company B. Gina takes a random sample of 7 packages from company A and an independent random sample of 10 packages from company B. Her results are summarised below a = 300 Saa = 145 496 b = 233.4 Sbb = 56 364.4 [You may assume that the weights of packages from the two companies are normally distributed.] Test Gina’s belief. Use a 5% level of significance and state your hypotheses clearly. (6)
June 2019 · Paper 4B (Further Statistics 2) · Q3(a) 7 marks
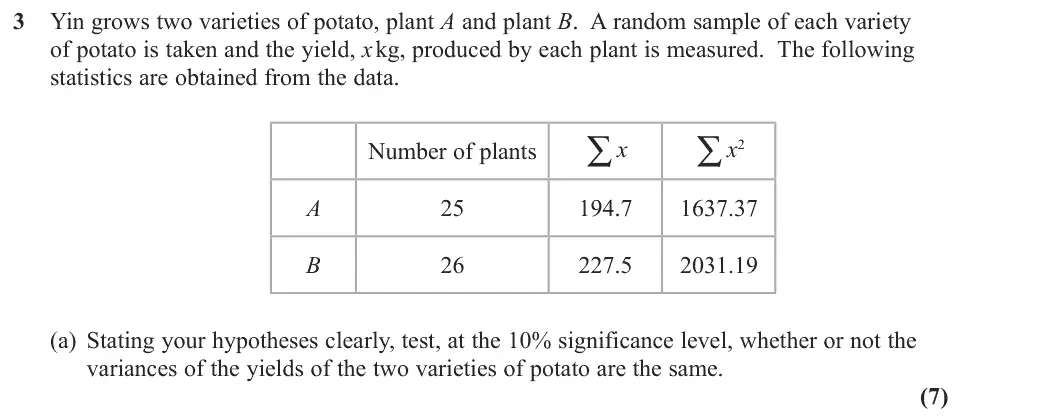
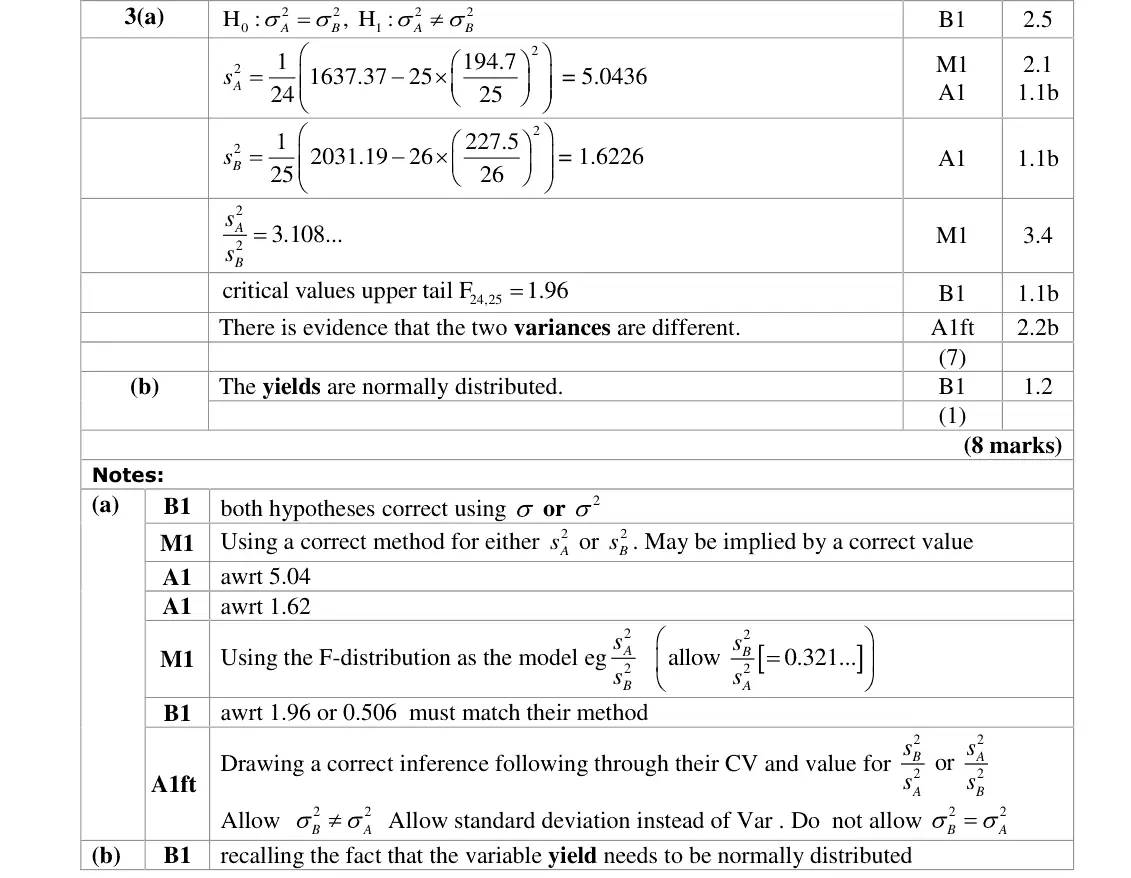
3 Yin grows two varieties of potato, plant A and plant B. A random sample of each variety of potato is taken and the yield, x kg, produced by each plant is measured. The following statistics are obtained from the data. ∑x ∑x2 Number of plants A 194.7 1637.37 B 227.5 2031.19 (a) Stating your hypotheses clearly, test, at the 10% significance level, whether or not the variances of the yields of the two varieties of potato are the same. (7)
June 2019 · Paper 4B (Further Statistics 2) · Q3(b) 1 mark
(b) State an assumption you have made in order to carry out the test in part (a). (1)

Find an Edexcel Further Maths tutor

Stuck on this? Book a trial lesson with our Further Maths tutor.

Prefer email? Send an enquiry

If you are under 18, please include a parent's contact details. Enquiries go to enquiries@alevelfurthermathstutor.com and are deleted once handled.