FS2.6.1 Hypothesis test and confidence interval for the variance of a…

Section
FS2.6 Other Hypothesis Tests and confidence intervals
Level
A level only
Statement
Hypothesis test and confidence interval for the variance of a Normal distribution.
Guidance
Use of (n − 1)S²/σ² ~ χ²ₙ₋₁. Candidates may use χ²-tables or their calculators to find critical values or p-values.
Since 2018
10 parts, 43 marks · topic pages: Variance tests: chi-squared and F-distribution, Estimators, confidence intervals and tests using the normal distribution, The t-distribution: t-tests and paired t-tests

Back to the checklist

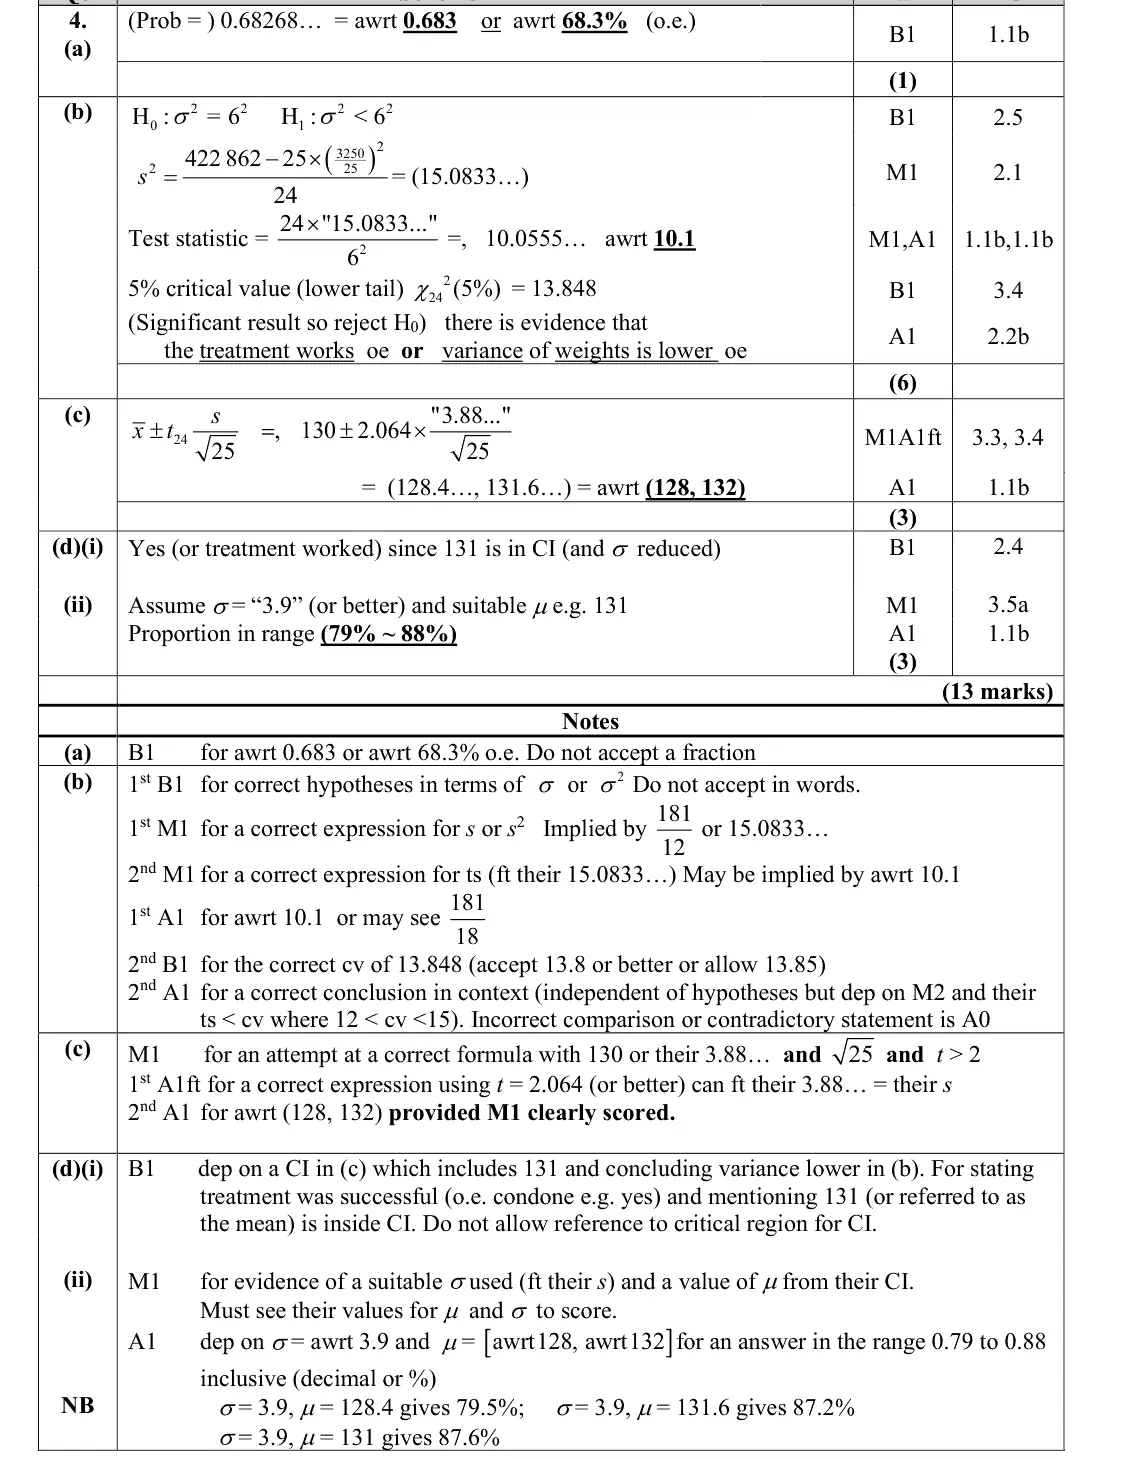
June 2025 · Paper 4B (Further Statistics 2) · Q4(a) 1 mark
4. The weights of apples Sam grows are normally distributed with a mean of 131 g and a standard deviation of 6 g A supermarket will only buy apples with weights in the range 125 g to 137 g (a) Find the proportion of apples Sam grows that the supermarket will buy. (1)
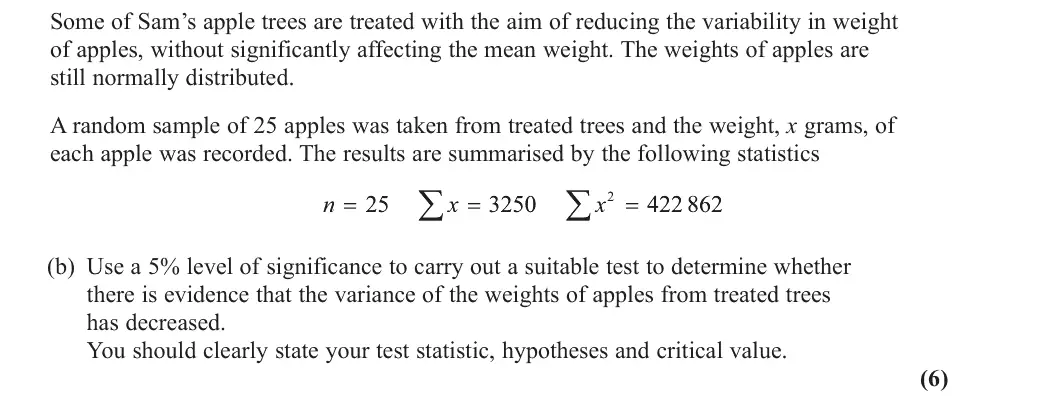
June 2025 · Paper 4B (Further Statistics 2) · Q4(b) 6 marks
Some of Sam’s apple trees are treated with the aim of reducing the variability in weight of apples, without significantly affecting the mean weight. The weights of apples are still normally distributed. A random sample of 25 apples was taken from treated trees and the weight, x grams, of each apple was recorded. The results are summarised by the following statistics ; ; n x 3250 x 422 862 (b) Use a 5% level of significance to carry out a suitable test to determine whether there is evidence that the variance of the weights of apples from treated trees has decreased. You should clearly state your test statistic, hypotheses and critical value. (6)
June 2025 · Paper 4B (Further Statistics 2) · Q4(d) 3 marks
(d) (i) State, giving a reason, whether the aims of the treatment have been met. (ii) Give an estimate of the proportion of apples the supermarket will buy from Sam’s trees that have been treated. (3)
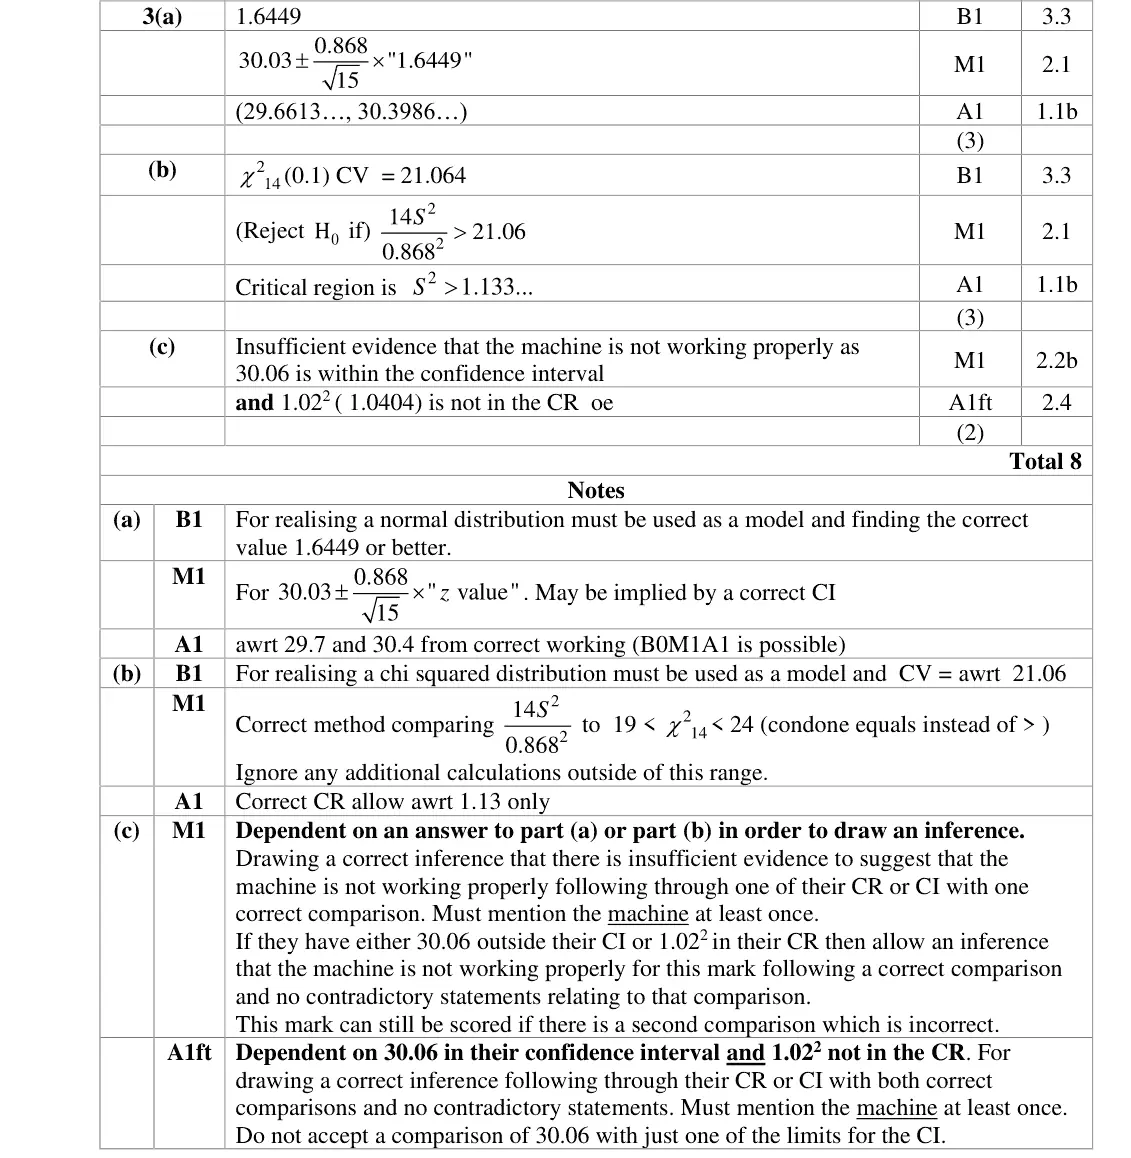
June 2024 · Paper 4B (Further Statistics 2) · Q3(b) 3 marks
A suitable test, at the 10% level of significance, is carried out using these 15 bolts, to see whether or not there is evidence that the variance of the length of the bolts has increased. (b) Calculate the critical region for S (3)
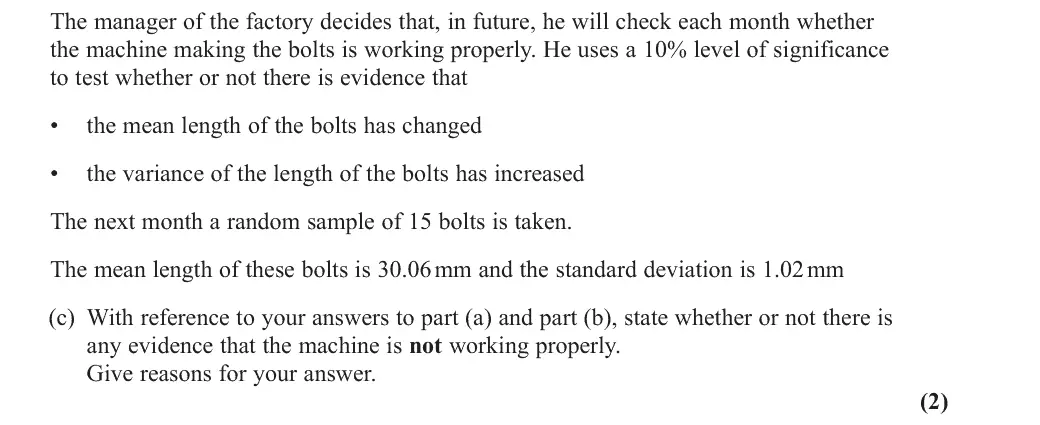
June 2024 · Paper 4B (Further Statistics 2) · Q3(c) 2 marks
The manager of the factory decides that, in future, he will check each month whether the machine making the bolts is working properly. He uses a 10% level of significance to test whether or not there is evidence that • the mean length of the bolts has changed • the variance of the length of the bolts has increased The next month a random sample of 15 bolts is taken. The mean length of these bolts is 30.06 mm and the standard deviation is 1.02 mm (c) With reference to your answers to part (a) and part (b), state whether or not there is any evidence that the machine is not working properly. Give reasons for your answer. (2)
June 2023 · Paper 4B (Further Statistics 2) · Q3(a) 4 marks
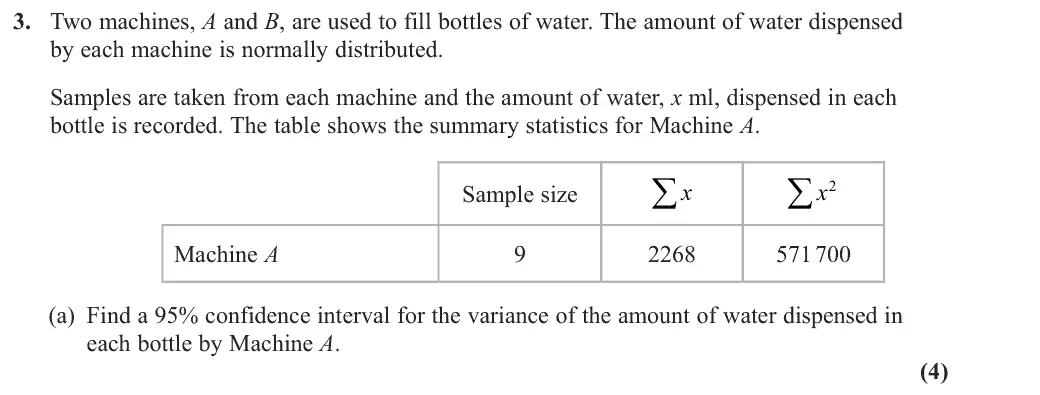
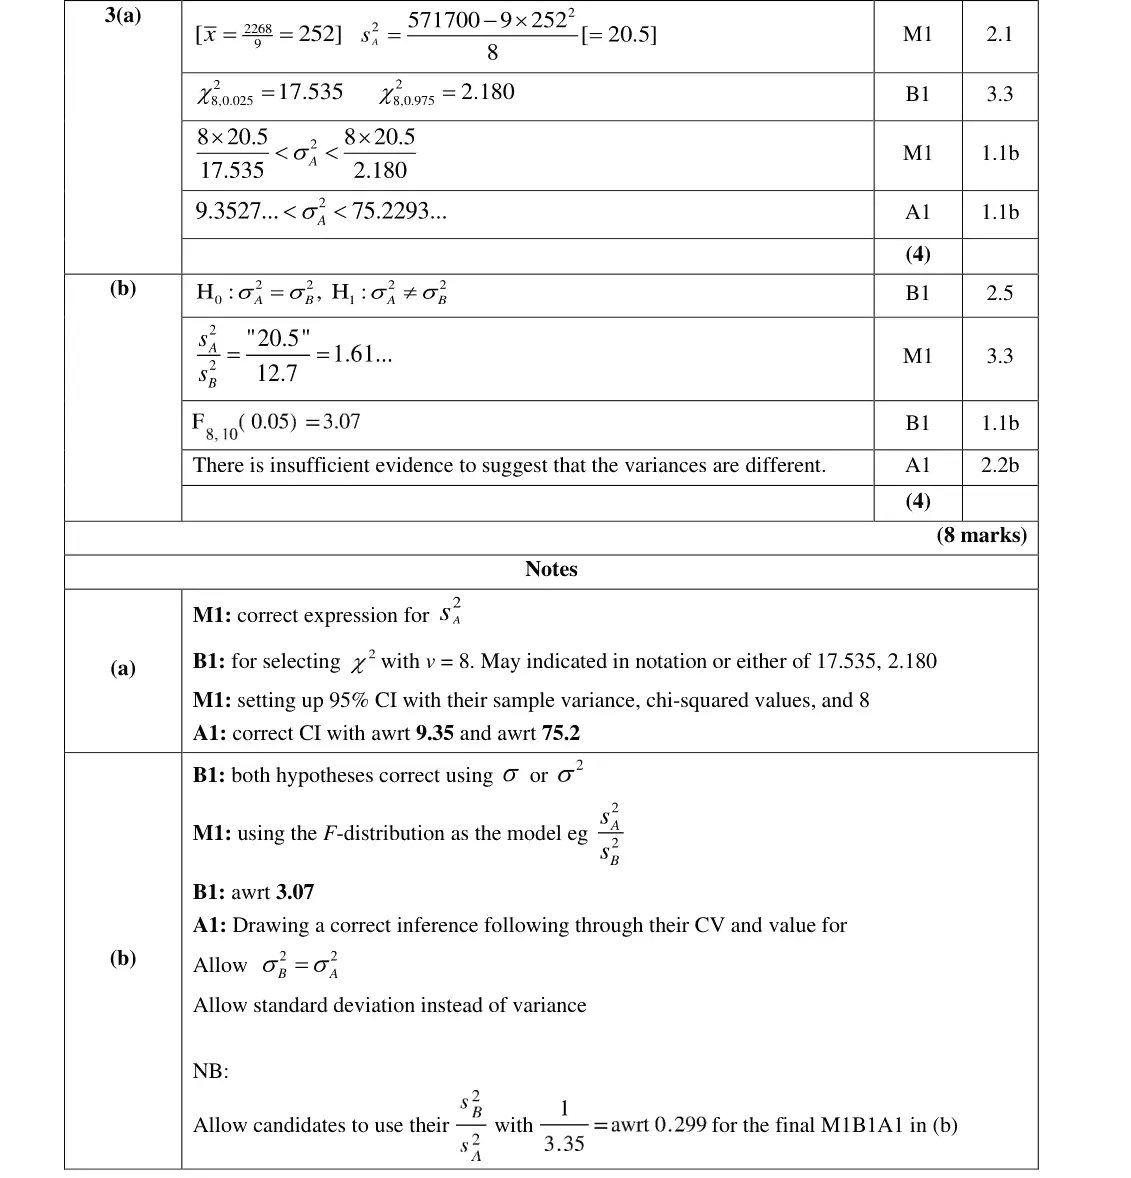
3. Two machines, A and B, are used to fill bottles of water. The amount of water dispensed by each machine is normally distributed. Samples are taken from each machine and the amount of water, x ml, dispensed in each bottle is recorded. The table shows the summary statistics for Machine A. ∑ ∑ Sample size x x2 Machine A 2268 571 700 (a) Find a 95% confidence interval for the variance of the amount of water dispensed in each bottle by Machine A. (4)
June 2022 · Paper 4B (Further Statistics 2) · Q5(c) 3 marks
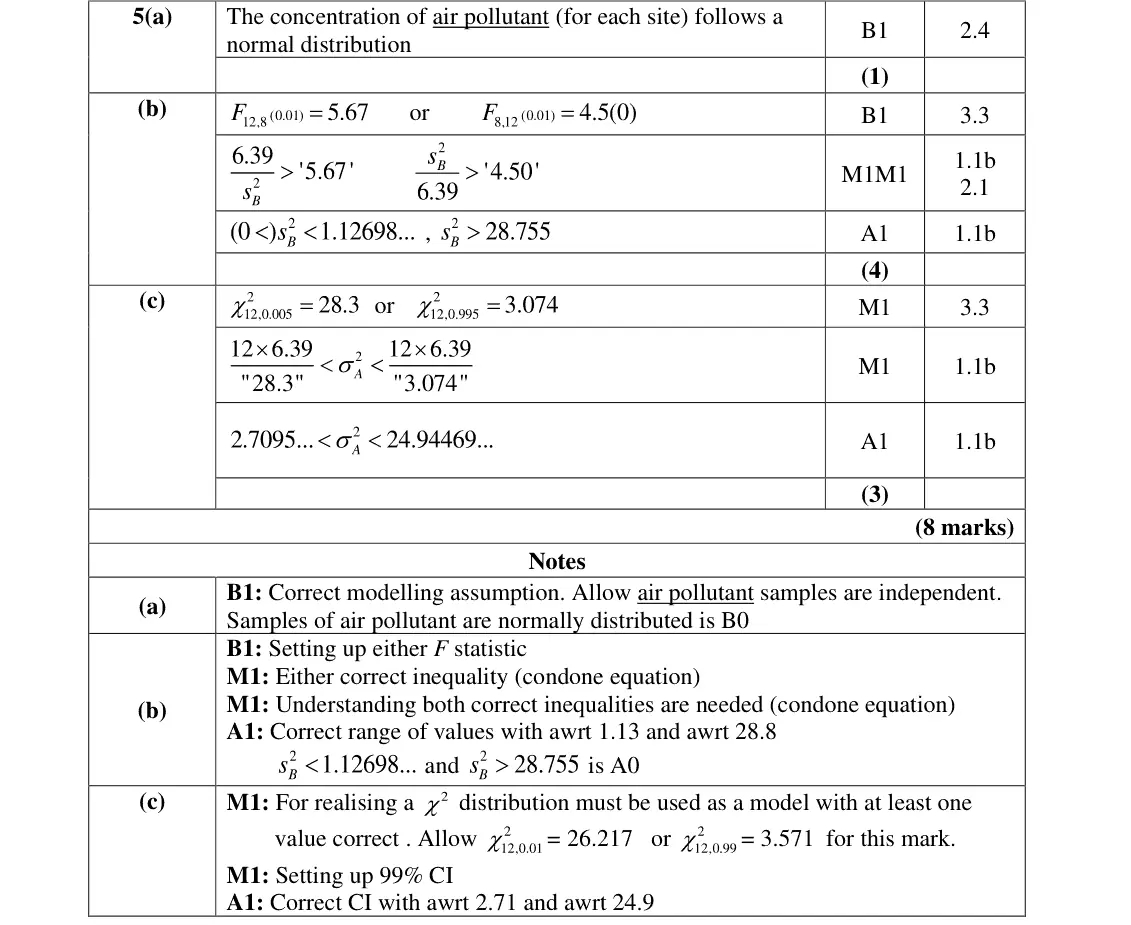
(c) find a 99% confidence interval for the variance of the concentration of the air pollutant at Site A. (3)
Nov 2021 · Paper 4B (Further Statistics 2) · Q6(b) 3 marks
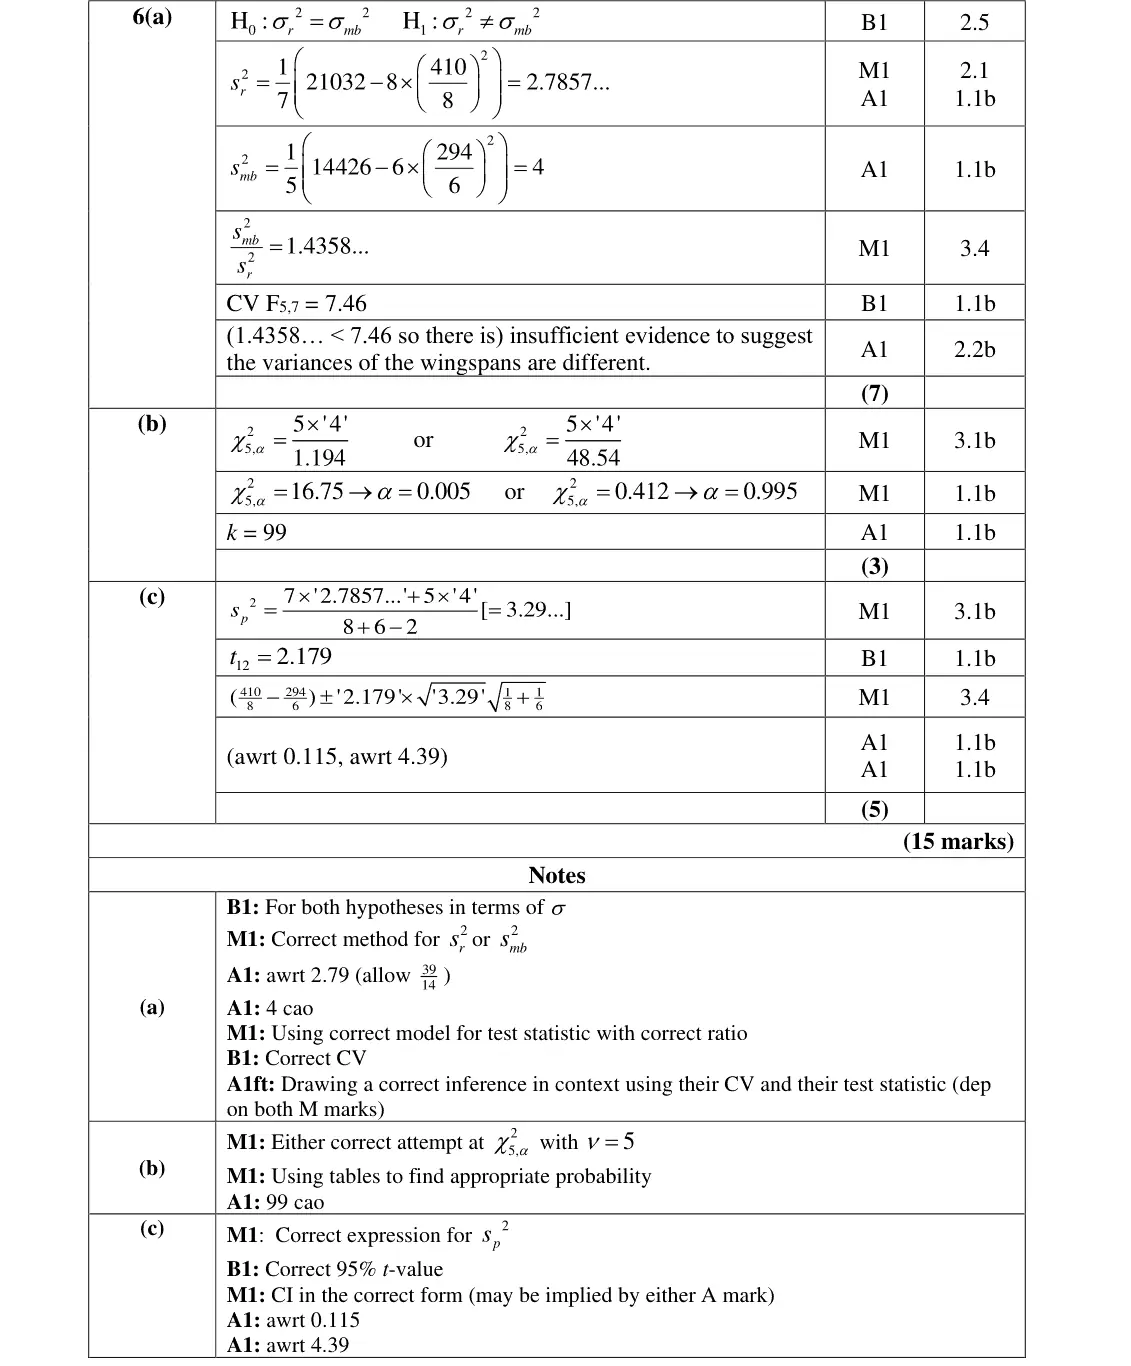
The k % confidence interval for the variance of the wingspans of Meadow Brown butterflies is (1.194, 48.54) (b) Find the value of k (3)
Oct 2020 · Paper 4B (Further Statistics 2) · Q6(a) 9 marks
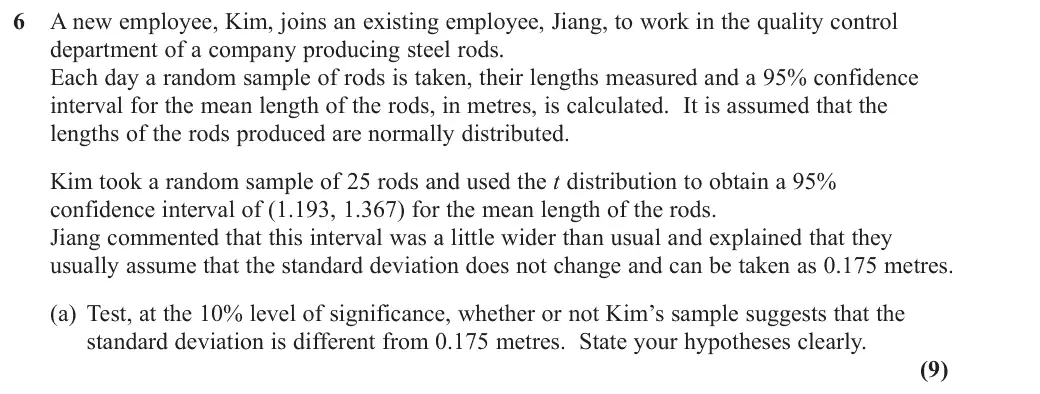
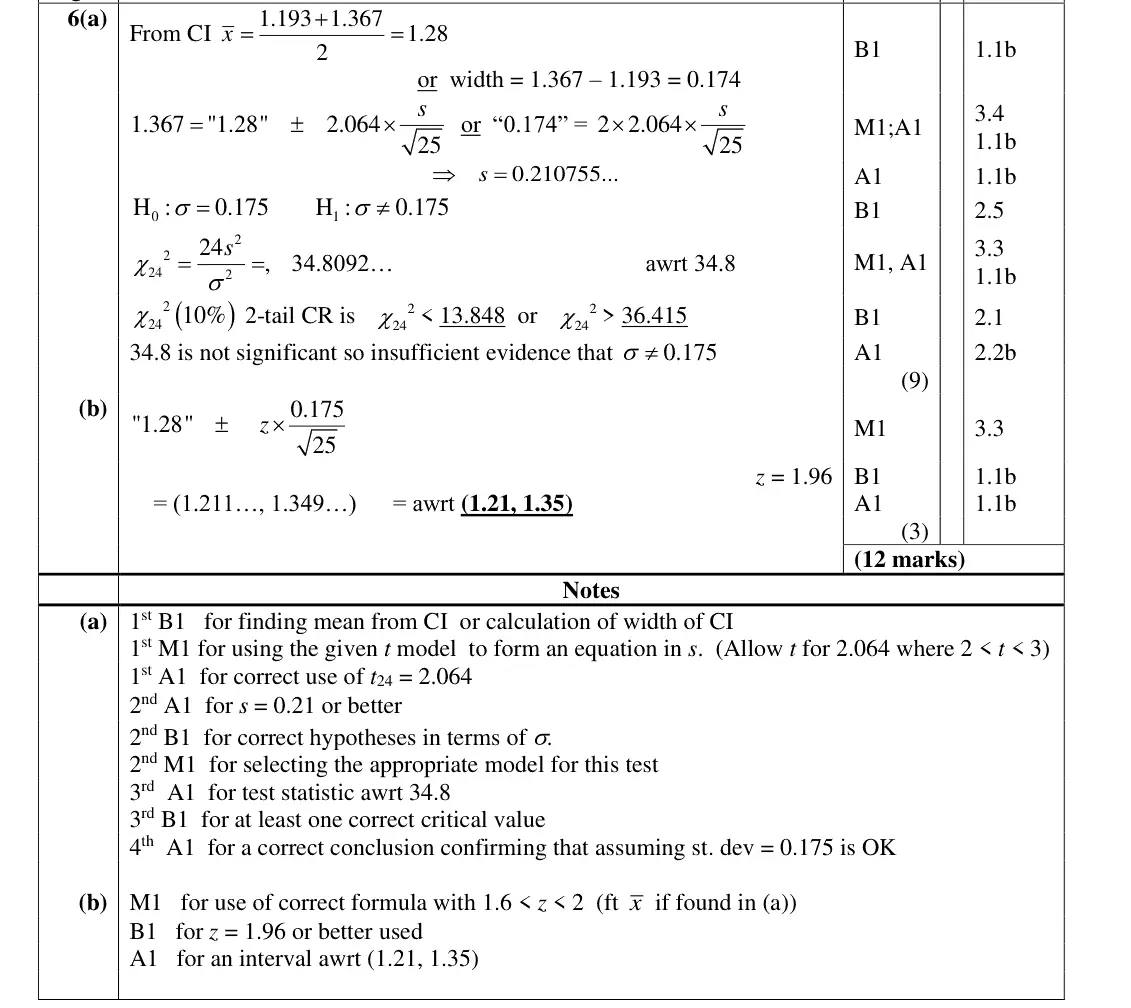
6 A new employee, Kim, joins an existing employee, Jiang, to work in the quality control department of a company producing steel rods. Each day a random sample of rods is taken, their lengths measured and a 95% confidence interval for the mean length of the rods, in metres, is calculated. It is assumed that the lengths of the rods produced are normally distributed. Kim took a random sample of 25 rods and used the t distribution to obtain a 95% confidence interval of (1.193, 1.367) for the mean length of the rods. Jiang commented that this interval was a little wider than usual and explained that they usually assume that the standard deviation does not change and can be taken as 0.175 metres. (a) Test, at the 10% level of significance, whether or not Kim’s sample suggests that the standard deviation is different from 0.175 metres. State your hypotheses clearly. (9)
June 2019 · Paper 4B (Further Statistics 2) · Q6 9 marks
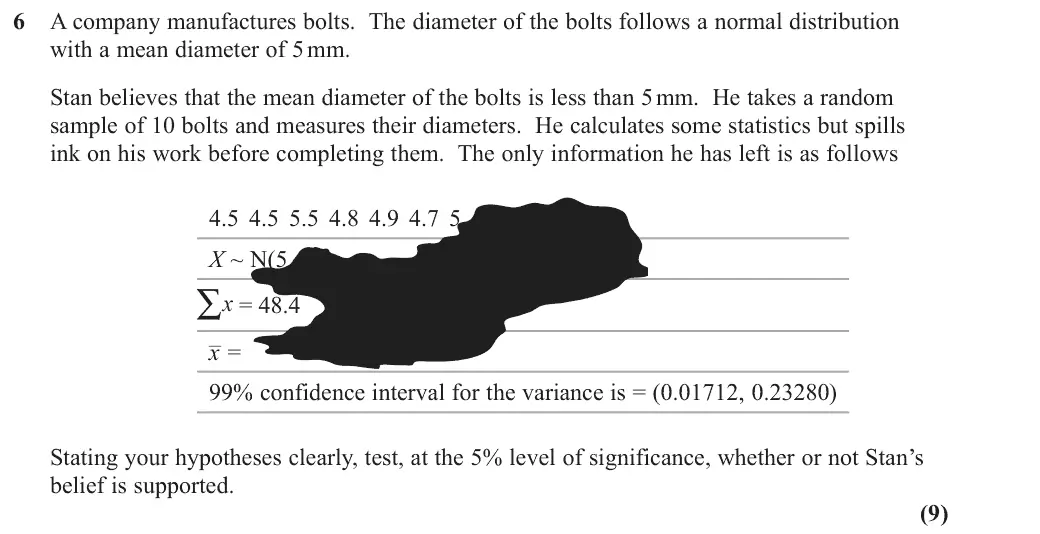
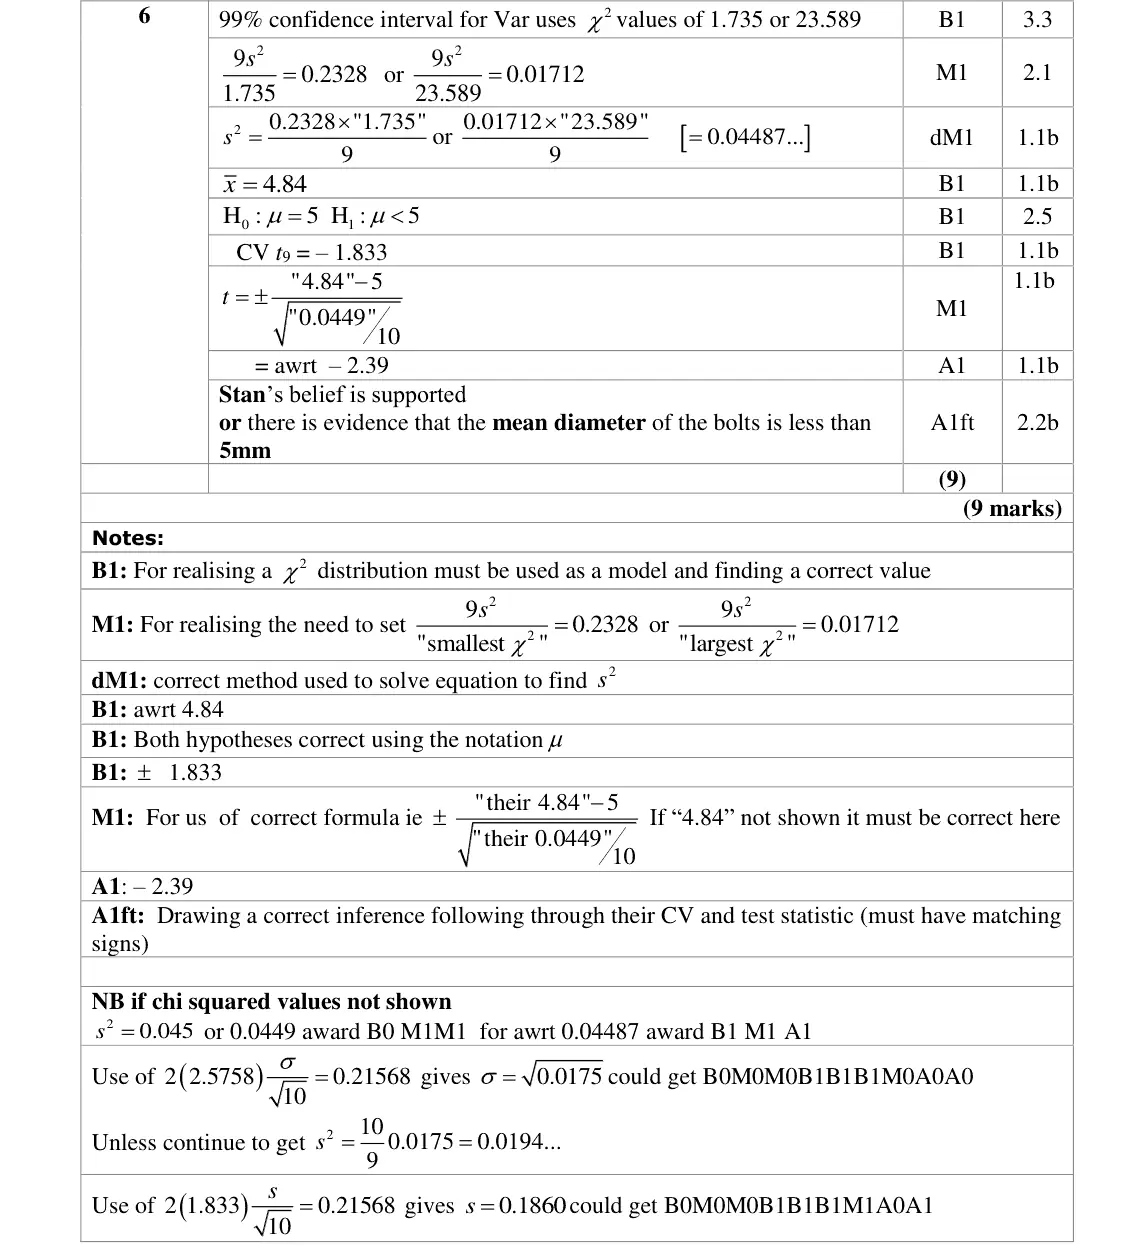
6 A company manufactures bolts. The diameter of the bolts follows a normal distribution with a mean diameter of 5 mm. Stan believes that the mean diameter of the bolts is less than 5 mm. He takes a random sample of 10 bolts and measures their diameters. He calculates some statistics but spills ink on his work before completing them. The only information he has left is as follows 4.5 4.5 5.5 4.8 4.9 4.7 5 X ~ N(5 2) ∑ x = 48.4 x– = 99% confidence interval for the variance is = (0.01712, 0.23280) Stating your hypotheses clearly, test, at the 5% level of significance, whether or not Stan’s belief is supported. (9)

Find an Edexcel Further Maths tutor

Stuck on this? Book a trial lesson with our Further Maths tutor.

Prefer email? Send an enquiry

If you are under 18, please include a parent's contact details. Enquiries go to enquiries@alevelfurthermathstutor.com and are deleted once handled.