The one-sample, paired and pooled two-sample t statistics and the t table are given.
Since 2018
21 question parts, 85 marks
Notes, worked examples and practice for this topic are being written by our tutors. The past-paper questions below are ready now: work each one on paper, then open the mark scheme and the examiner's comment.
Tap a question to zoom it. Mark scheme and examiner's comment open under each question.
June 2025 · Paper 4B (Further Statistics 2) · Q3(b)2 marks
Mark scheme (whole question; this part is marked with the orange bar)
Examiner's comment
This question required candidates to conduct a test to see whether two variances were the same. Candidates found this question more challenging, so it was rare for full marks to be achieved, usually part (b) being where marks were not scored. Part (b) was rarely fully correct. Candidates often did not fully answer (b)(i) which required an explanation regarding the importance of the conclusion to the test in (a) with respect to the test carried out on the difference between two means. Just stating you can find a pooled estimate for the population variance was not sufficient without explaining that the variances were equal was a required assumption to carry out the t-test. Some candidates also did not correctly interpret the significance of the p-value, whilst others did not correctly mention the effect on the mean yield (instead of just ‘yield’).
Key points from the mark scheme and examiner's report
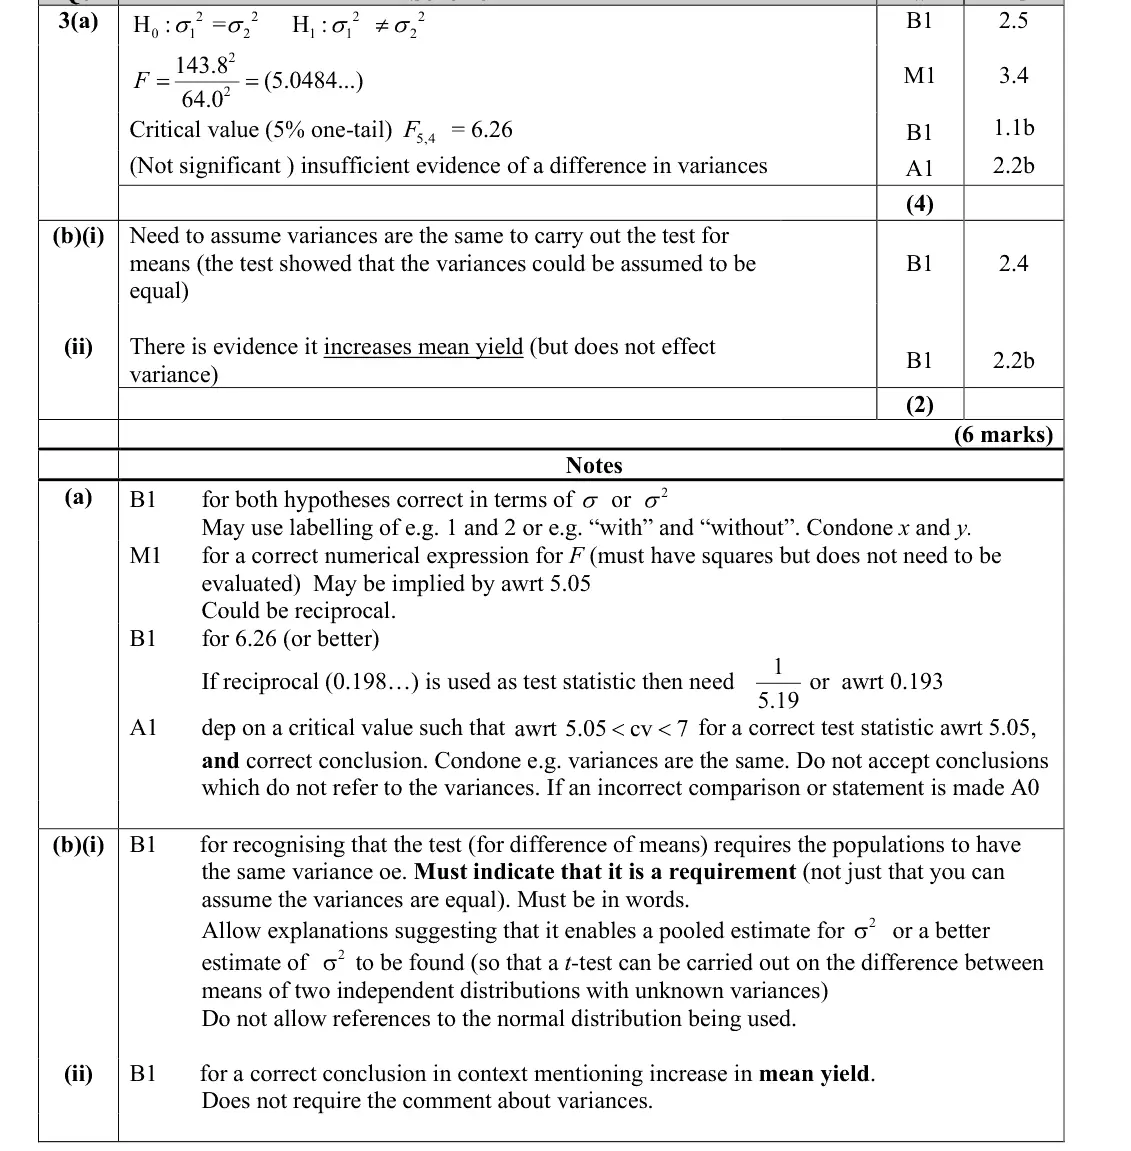
(i) the pooled two-sample t-test REQUIRES equal population variances, which (a) supports
just 'can pool' is not enough
(ii) p = 0.002 is very small: evidence the bacteria increase MEAN yield
June 2025 · Paper 4B (Further Statistics 2) · Q4(c)3 marks
Mark scheme (whole question; this part is marked with the orange bar)
Examiner's comment
This question was more demanding and required candidates to carry out a hypothesis test on the variance, as well as constructing a confidence interval. Candidates found this question more demanding, but they were still able to score a high number of the available marks. Part (c) was usually fully correct, however, the main cause of the loss of all marks was for failing to use a critical value from the t-distribution. A significant number used 1.96 from the normal distribution was not appropriate.
Key points from the mark scheme and examiner's report
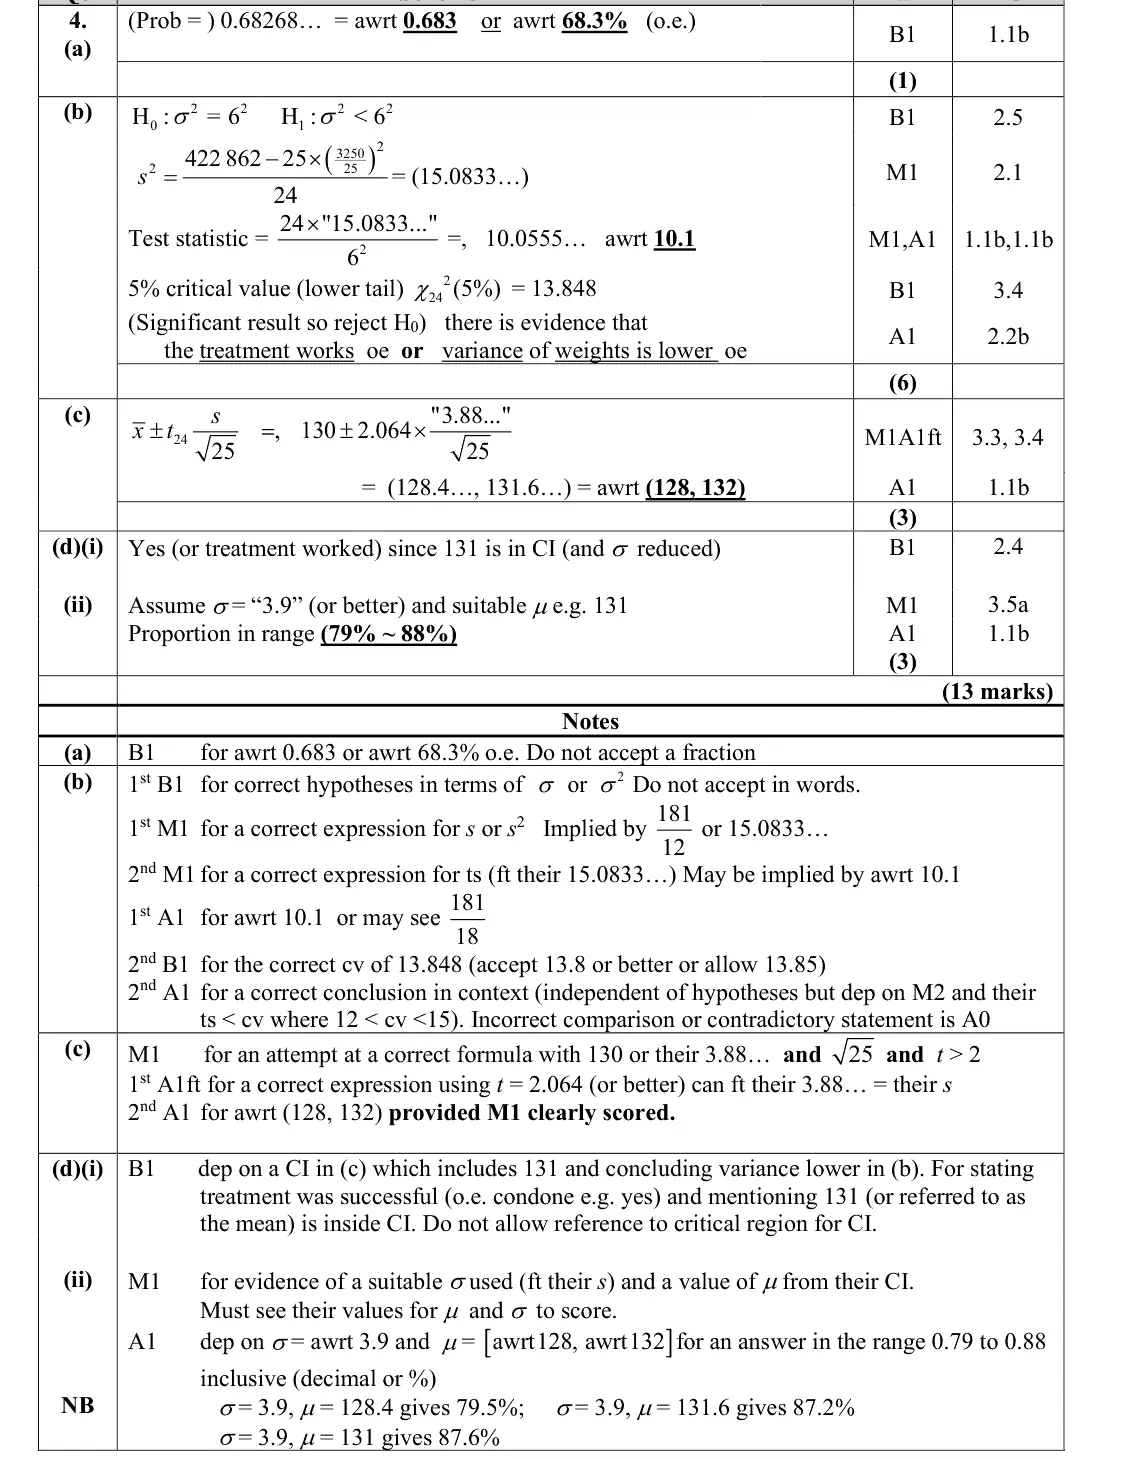
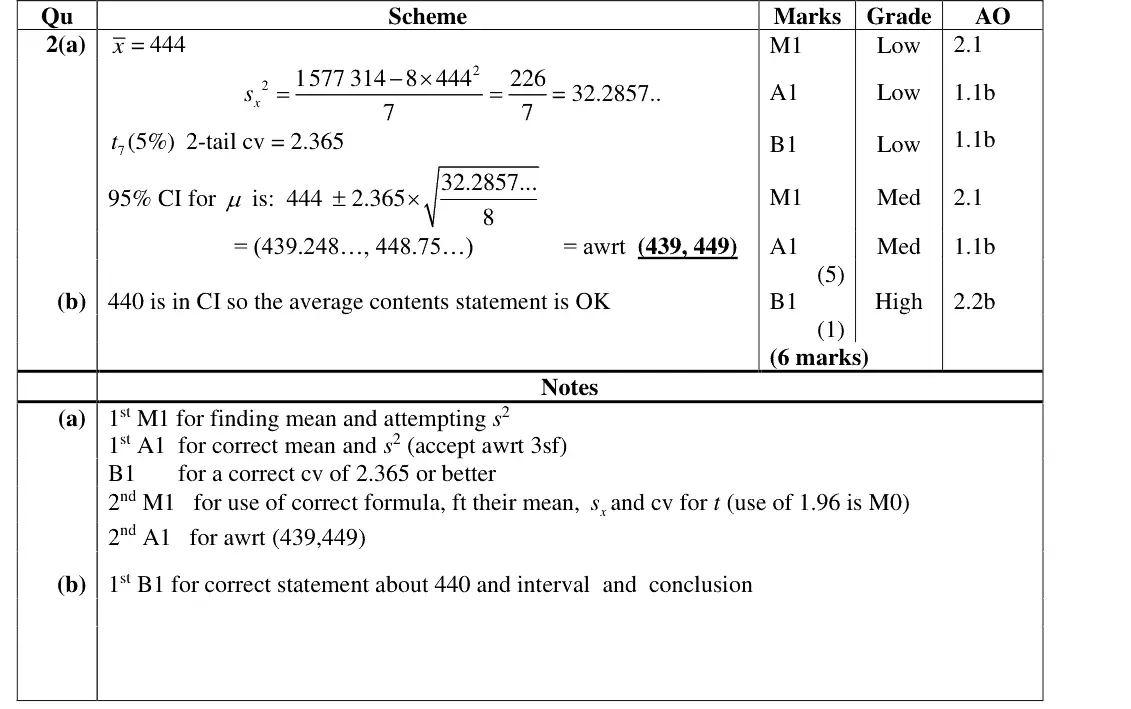
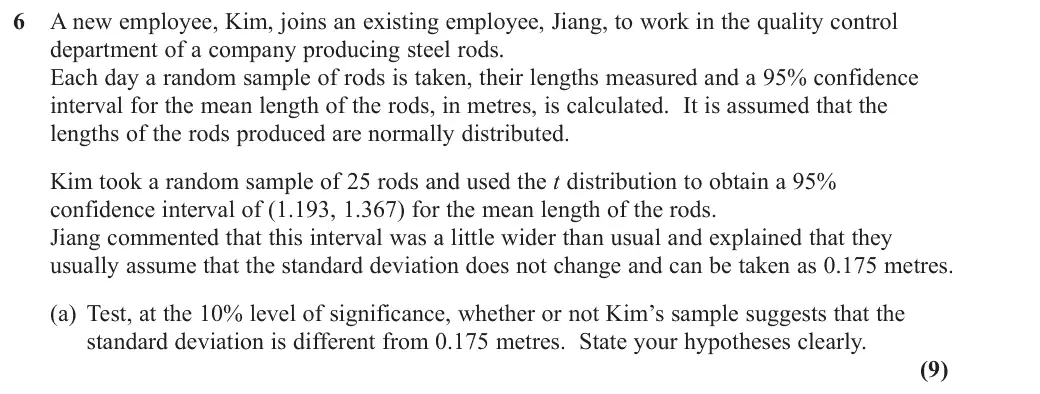
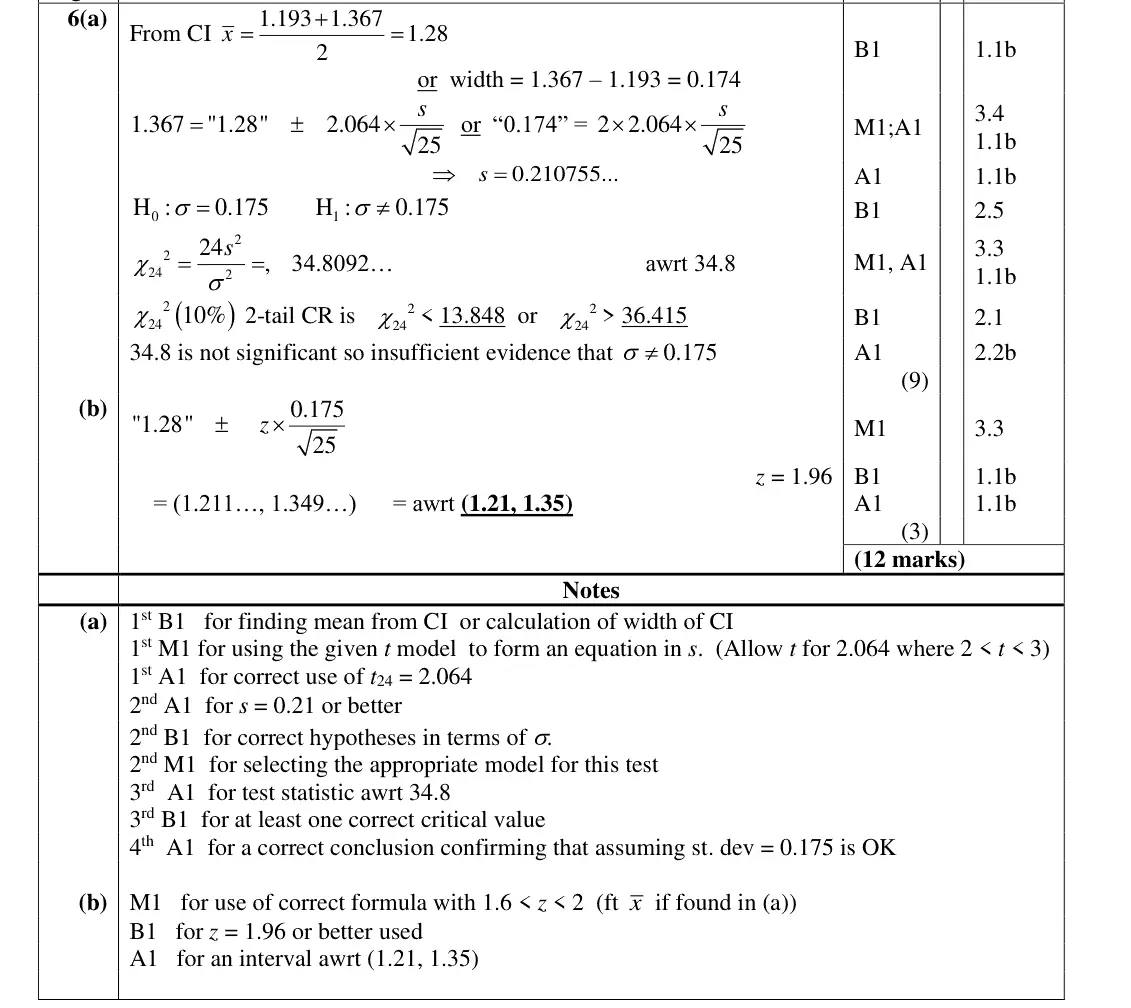
x̄ = 130, s = 3.88
130 ± 2.064 × 3.88/5 = (128, 132)
using 1.96 instead of t₂₄ lost all marks
June 2025 · Paper 4B (Further Statistics 2) · Q6(b)1 mark
Mark scheme (whole question; this part is marked with the orange bar)
Examiner's comment
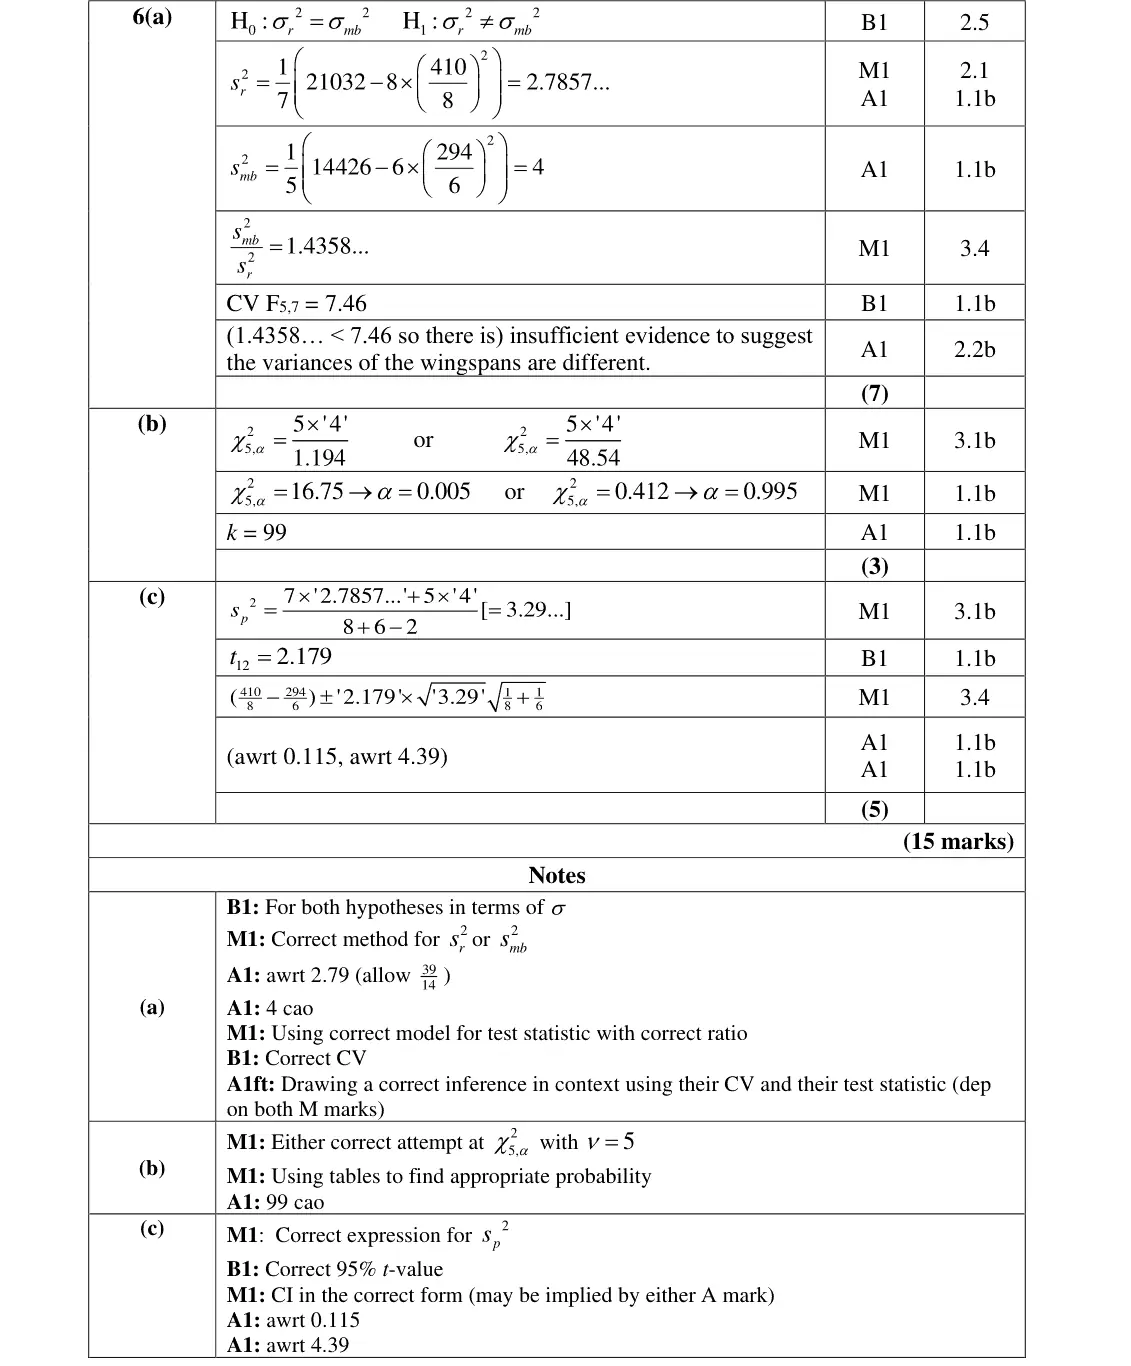
This 17-mark question on delivery rates was very demanding for candidates as it involved two different hypothesis tests. It was very rare for full marks to be scored, although it was pleasing to see most candidates scoring the majority of them. In part (b) candidates were required to mention that the delivery rates were normally distributed and the variances were equal. It was rare for both assumptions to be given so this mark was usually not scored.
Key points from the mark scheme and examiner's report
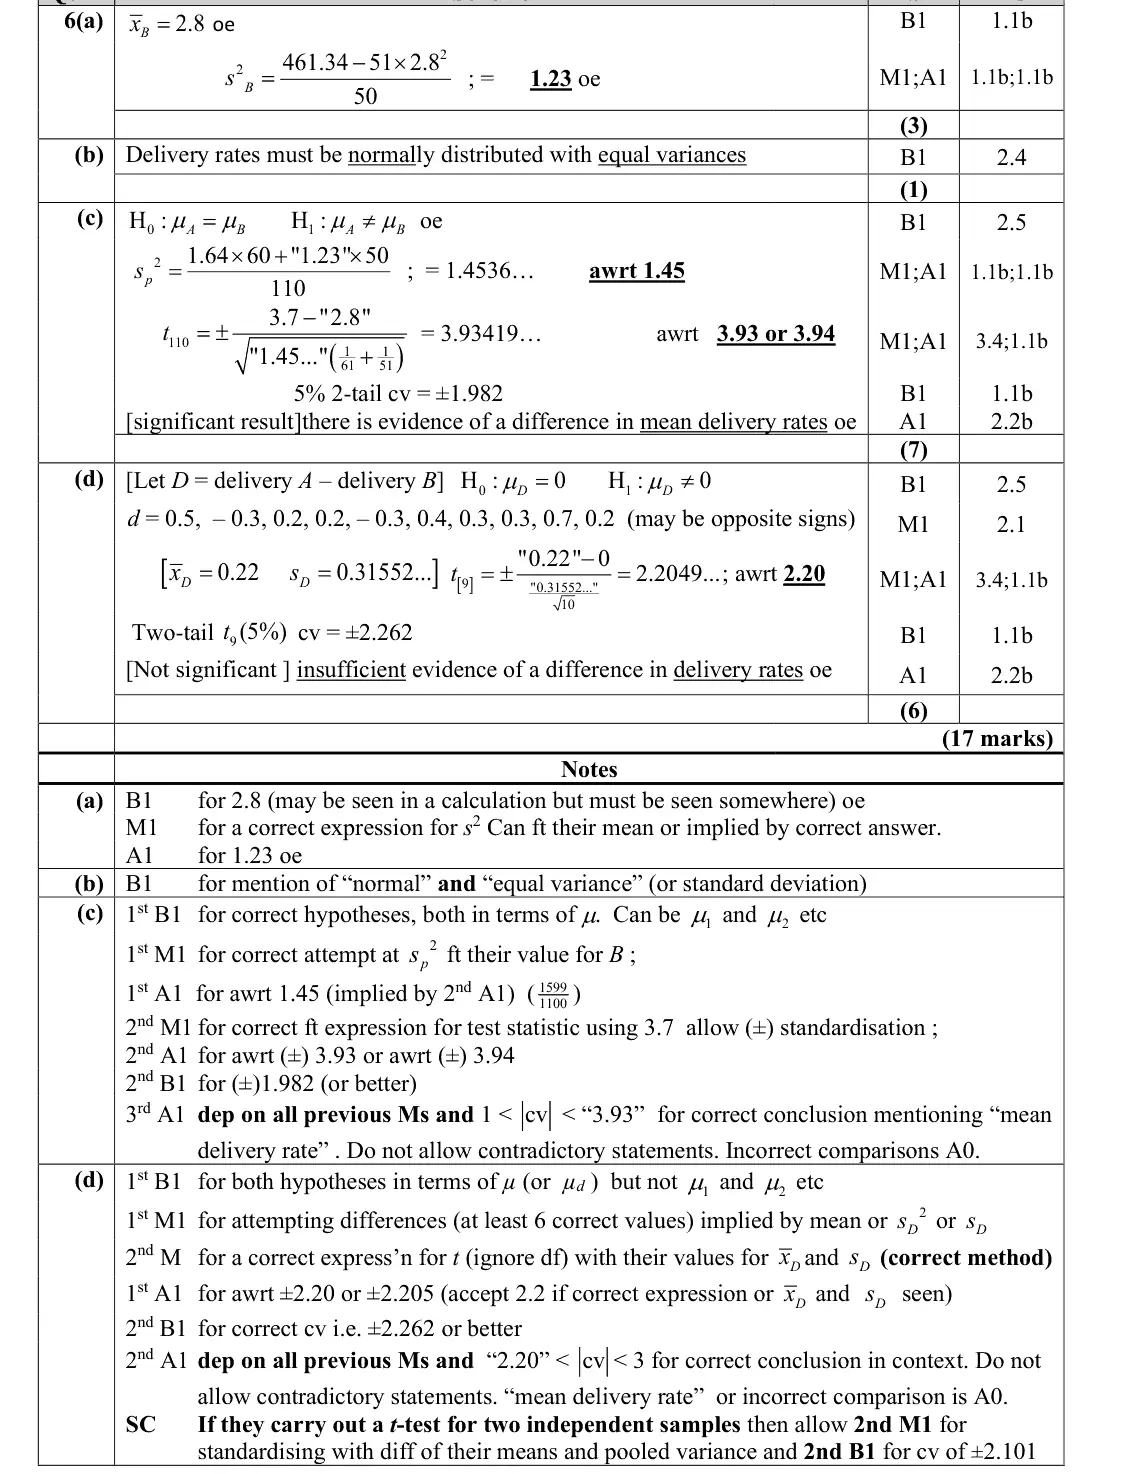
delivery rates normally distributed AND equal variances
both needed, rarely given
June 2025 · Paper 4B (Further Statistics 2) · Q6(c)7 marks
Mark scheme (whole question; this part is marked with the orange bar)
Examiner's comment
This 17-mark question on delivery rates was very demanding for candidates as it involved two different hypothesis tests. It was very rare for full marks to be scored, although it was pleasing to see most candidates scoring the majority of them. Part (c) was usually answered well with most candidates able to demonstrate their ability to carry out a two-sample t-test. The conclusion, in some cases, however was not sufficiently in context, or ‘mean’ was missing in their statement.
Key points from the mark scheme and examiner's report
H₀: μA = μB, H₁: μA ≠ μB
sp² = (60 × 1.64 + 50 × 1.23)/110 = 1.45
t = 0.9/√(1.45(1/61 + 1/51)) = 3.93 > 1.982, evidence of a difference in MEAN delivery rates
June 2025 · Paper 4B (Further Statistics 2) · Q6(d)6 marks
Mark scheme (whole question; this part is marked with the orange bar)
Examiner's comment
This 17-mark question on delivery rates was very demanding for candidates as it involved two different hypothesis tests. It was very rare for full marks to be scored, although it was pleasing to see most candidates scoring the majority of them. Part (d) involved carrying out a paired t-test. Most candidates made some progress with this, however, a number did not show their working sufficiently to evidence how they found an unbiased estimate for the variance and this meant that they lost marks in finding the test statistic. Others set up another two-sample t-test which could only score two of the available marks.
Key points from the mark scheme and examiner's report
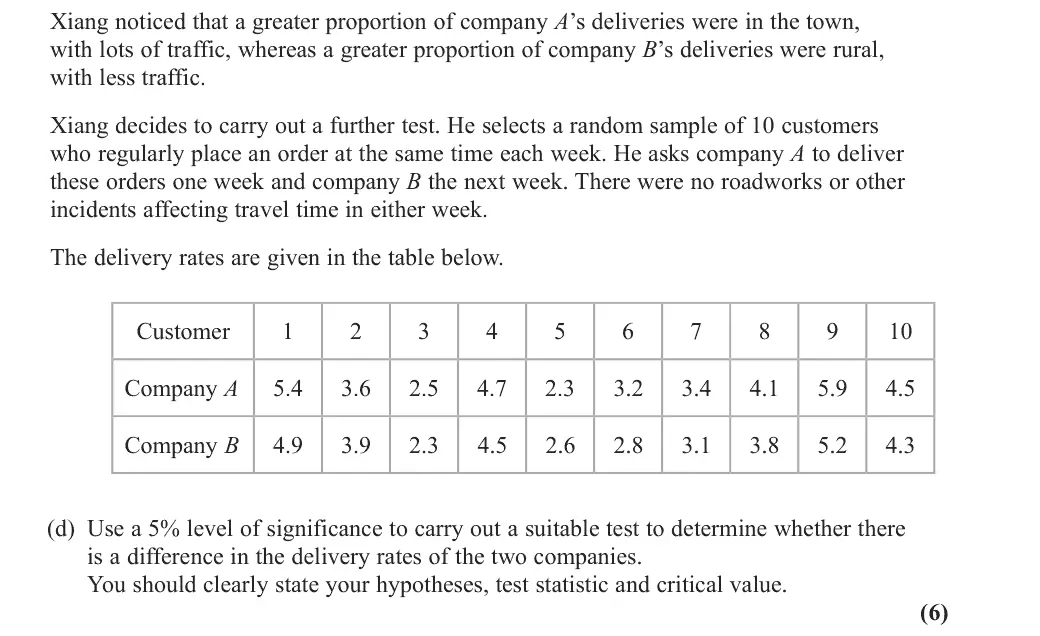
paired t-test on differences A − B: d̄ = 0.22, s_d = 0.3155
H₀: μD = 0, H₁: μD ≠ 0
t = 2.20 < t₉ = 2.262, insufficient evidence of a difference
a second two-sample test scores only 2 marks
show the working for s_d
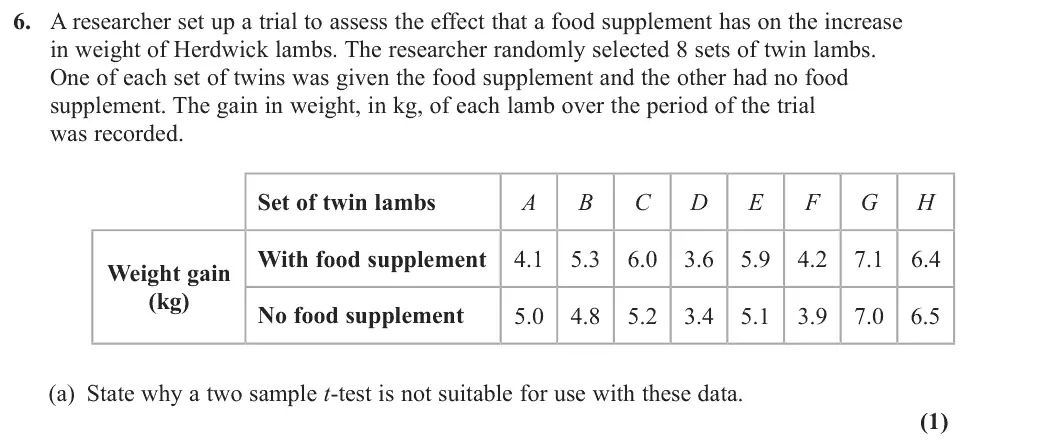
June 2024 · Paper 4B (Further Statistics 2) · Q6(a)1 mark
Mark scheme (whole question; this part is marked with the orange bar)
Examiner's comment
Parts (a) to (c) were generally quite poorly answered. In (a) and (c) many candidates were not sufficiently aware of the assumptions and conditions necessary for the use of the particular statistical model. In (b), few read the question carefully enough to realise it was asking about difference of means and a pooled variance. This was somewhat surprising, given that part (a) stated that this method is not suitable and part (c) indicating a paired t-test was possibly the
Key points from the mark scheme and examiner's report
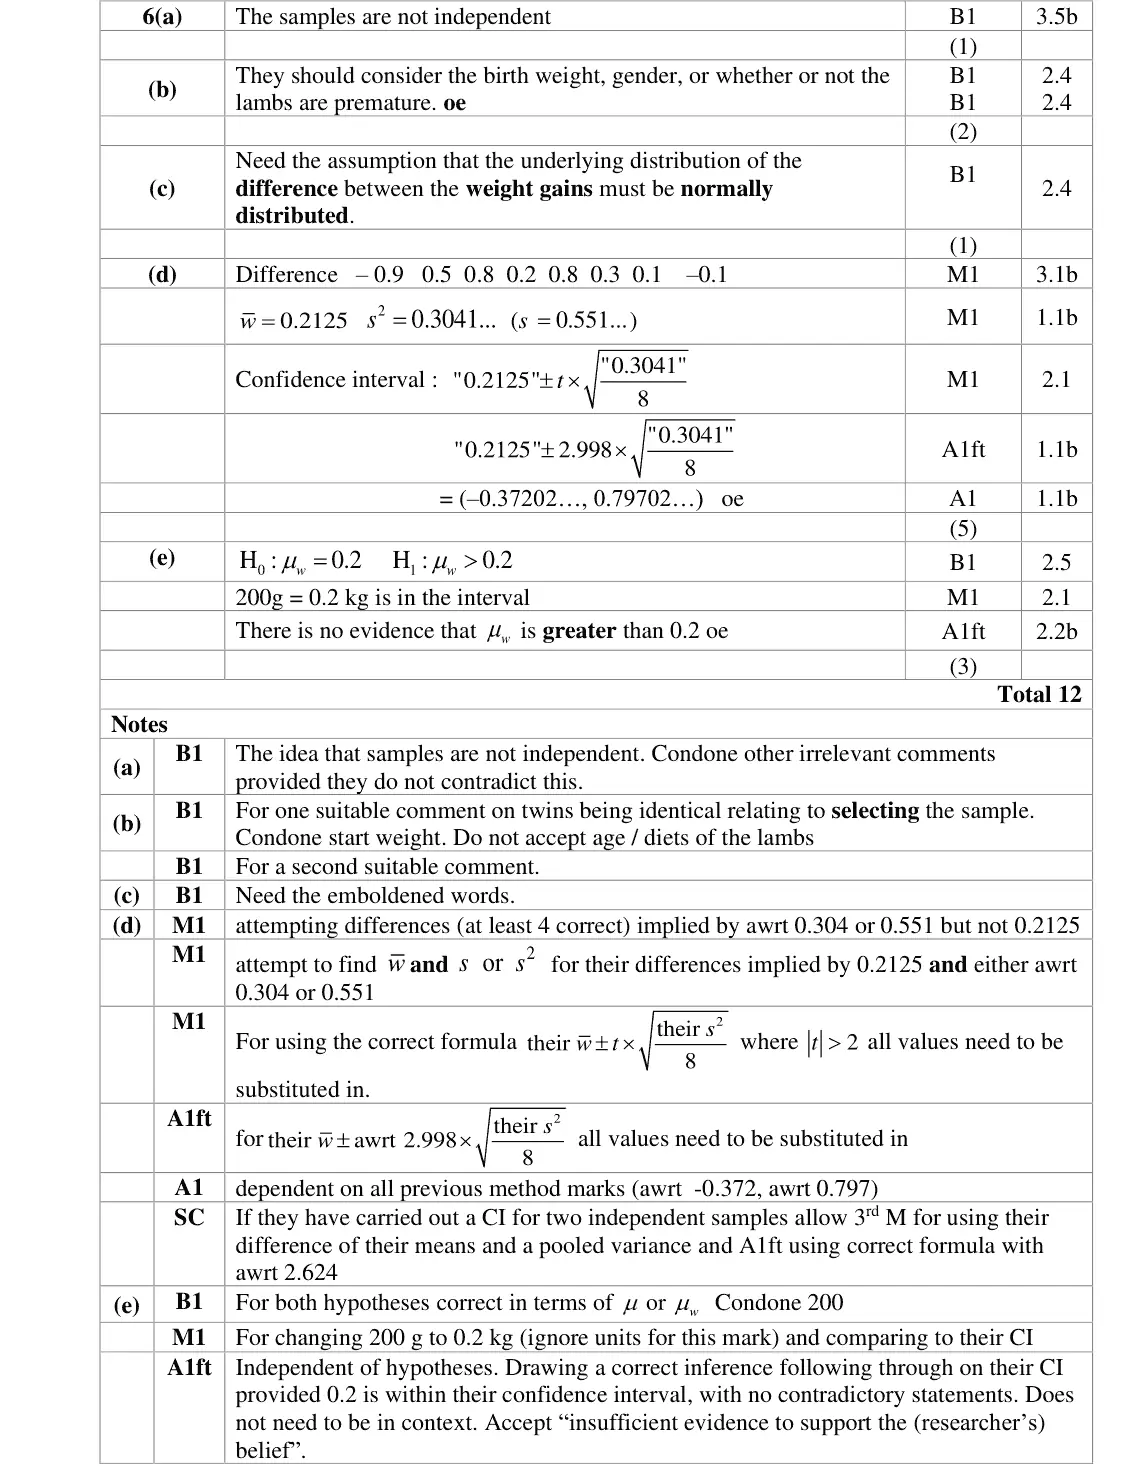
the samples are not independent (twins are paired)
June 2024 · Paper 4B (Further Statistics 2) · Q6(b)2 marks
Mark scheme (whole question; this part is marked with the orange bar)
Examiner's comment
statistical model. In (b), few read the question carefully enough to realise it was asking about sampling considerations. Many wrote lots about the controlling conditions the lambs were kept in, but this was not relevant to sampling and gained no credit.
Key points from the mark scheme and examiner's report
sampling factors such as birth weight, gender, prematurity, identical twins
comments about diet or conditions the lambs are kept in score 0
June 2024 · Paper 4B (Further Statistics 2) · Q6(c)1 mark
Mark scheme (whole question; this part is marked with the orange bar)
Examiner's comment
Parts (a) to (c) were generally quite poorly answered. In (a) and (c) many candidates were not sufficiently aware of the assumptions and conditions necessary for the use of the particular statistical model. In (b), few read the question carefully enough to realise it was asking about stated that this method is not suitable and part (c) indicating a paired t-test was possibly the correct approach. Some credit was given as a special case, however a good proportion of these candidates did not square root the correct elements of their formula or failed to fully substitute their values in their workings, so could not score marks.
Key points from the mark scheme and examiner's report
the differences between the weight gains are normally distributed (key words needed)
June 2024 · Paper 4B (Further Statistics 2) · Q6(d)5 marks
Mark scheme (whole question; this part is marked with the orange bar)
Examiner's comment
In (d), evidence of method was often lacking, leading to a loss of method marks where errors were made, and the method was not shown. A significant number of candidates incorrectly worked with the method to find a confidence interval from two independent samples, using difference of means and a pooled variance. This was somewhat surprising, given that part (a)
Key points from the mark scheme and examiner's report
differences w̄ = 0.2125, s² = 0.3041
t₇ (1% each tail) = 2.998
0.2125 ± 2.998√(0.3041/8) = (−0.372, 0.797)
a pooled two-sample interval is the common wrong method
June 2024 · Paper 4B (Further Statistics 2) · Q6(e)3 marks
Mark scheme (whole question; this part is marked with the orange bar)
Examiner's comment
In part (e), the distinction between then population mean, and sample mean was important in the hypotheses, with many students using the wrong symbol and so writing incorrect hypotheses. Candidates needed to clearly convert 200(g) to 0.2(kg) to compare to the confidence interval and a number failed to do so. Marks were also lost with incorrectly two- tailed hypotheses, comparing the sample mean to the confidence interval, instead of the supposed population mean, and by incorrectly taking 0.2's presence in the confidence interval as evidence to support the alternative rather than the null hypothesis.
Key points from the mark scheme and examiner's report
H₀: μw = 0.2, H₁: μw > 0.2 (population mean, kg)
0.2 kg lies inside the interval so no evidence for the researcher's belief
convert 200 g to 0.2 kg
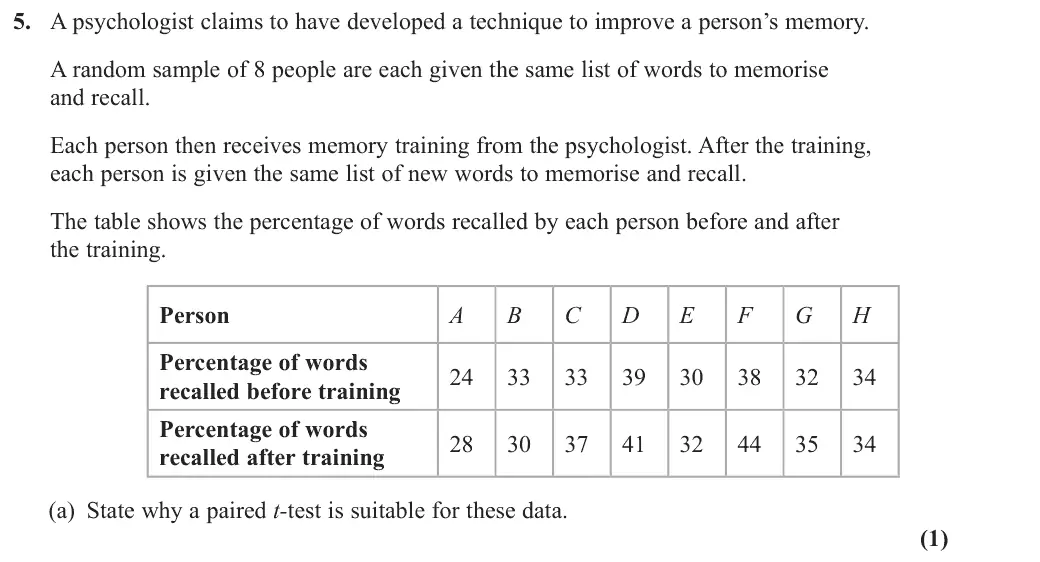
June 2023 · Paper 4B (Further Statistics 2) · Q5(a)1 mark
Mark scheme (whole question; this part is marked with the orange bar)
Examiner's comment
This was perhaps the first really challenging question on the paper. The candidates’ holistic knowledge of t-tests and when it is appropriate to use them was thoroughly tested. Parts (a) and (b) were quite high demand as they required rigorous answers. Most of the candidates showed understanding of the premise of both parts, but were often unable to give sufficiently detailed and high-level answers worthy of both marks. Most candidates were able to carry out the hypothesis test well, and hence gained the majority of the marks in (c). A good number made an error while finding their differences, costing them two marks.
Key points from the mark scheme and examiner's report
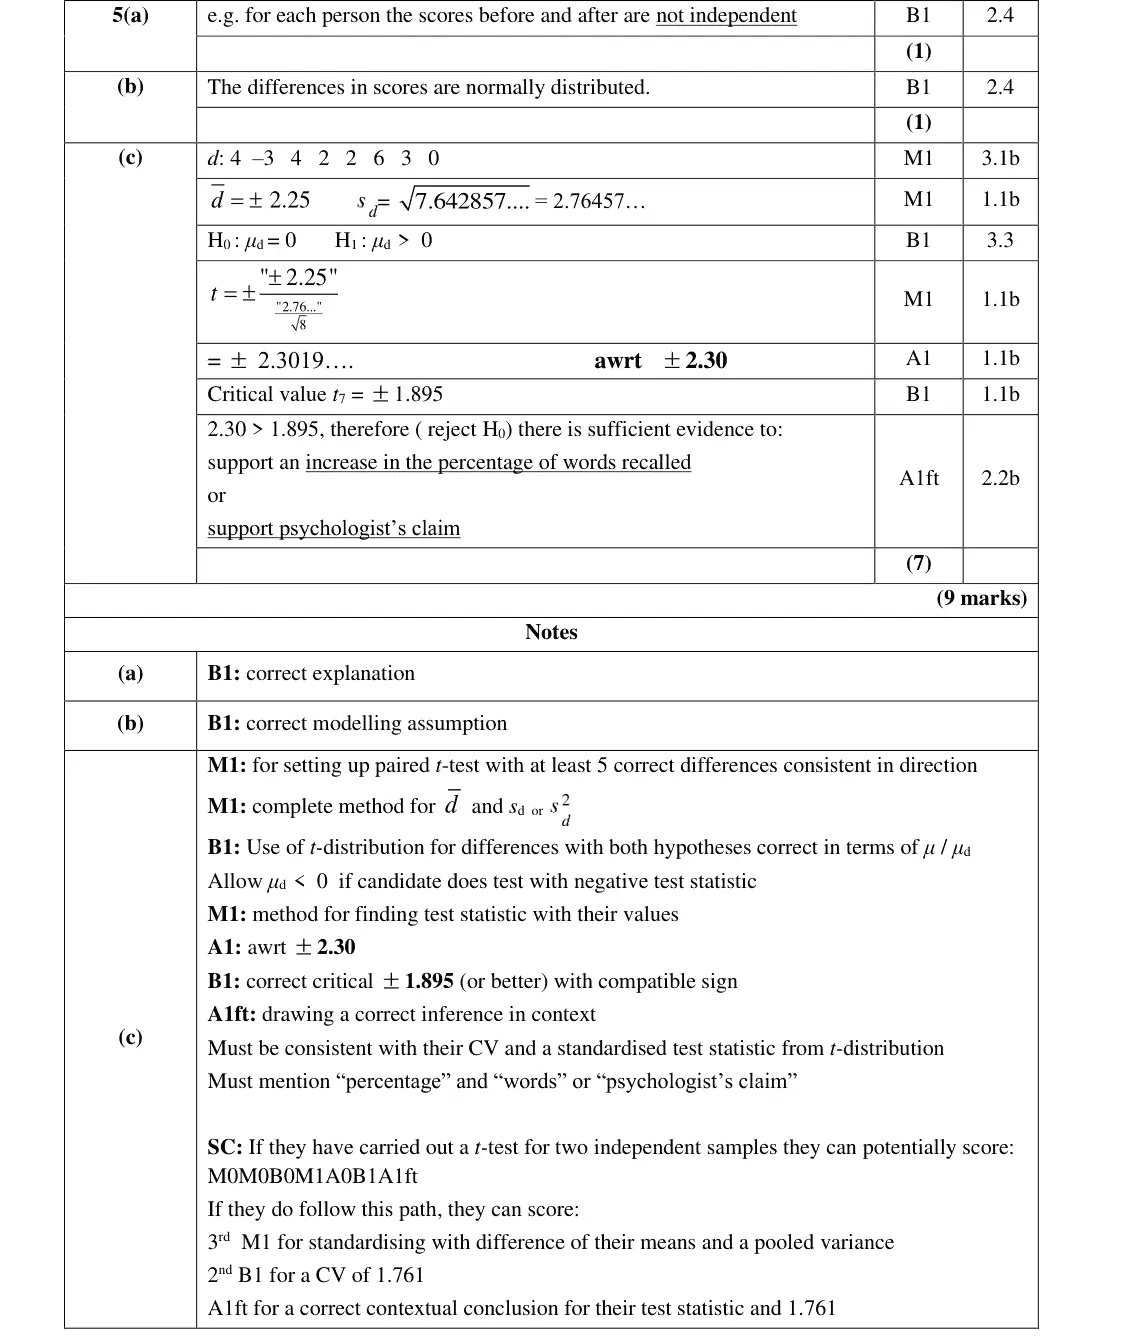
the before and after scores are for the same person, so not independent (paired data)
answers often not precise enough
June 2023 · Paper 4B (Further Statistics 2) · Q5(b)1 mark
Mark scheme (whole question; this part is marked with the orange bar)
Examiner's comment
This was perhaps the first really challenging question on the paper. The candidates’ holistic knowledge of t-tests and when it is appropriate to use them was thoroughly tested. Parts (a) and (b) were quite high demand as they required rigorous answers. Most of the candidates showed understanding of the premise of both parts, but were often unable to give sufficiently detailed and high-level answers worthy of both marks. Most candidates were able to carry out the hypothesis test well, and hence gained the majority of the marks in (c). A good number made an error while finding their differences, costing them two marks.
Key points from the mark scheme and examiner's report
the differences in scores are normally distributed
June 2023 · Paper 4B (Further Statistics 2) · Q5(c)7 marks
Mark scheme (whole question; this part is marked with the orange bar)
Examiner's comment
This was perhaps the first really challenging question on the paper. The candidates’ holistic knowledge of t-tests and when it is appropriate to use them was thoroughly tested. marks in (c). A good number made an error while finding their differences, costing them two marks. A small minority of candidates carried out a test for two independent population means instead of a paired t-test. This limited such candidates to 3 marks out of the 7 available in (c). The question led candidates into the correct approach helpfully by asking candidates directly why a paired t-test is suitable for this situation. Therefore, candidates should be encouraged to read the question carefully to ensure they pick up on such direction.
Key points from the mark scheme and examiner's report
t = 2.30 > t₇ = 1.895, evidence of an increase in the percentage of words recalled
slips in differences cost two marks
two-sample t-test scores at most 3
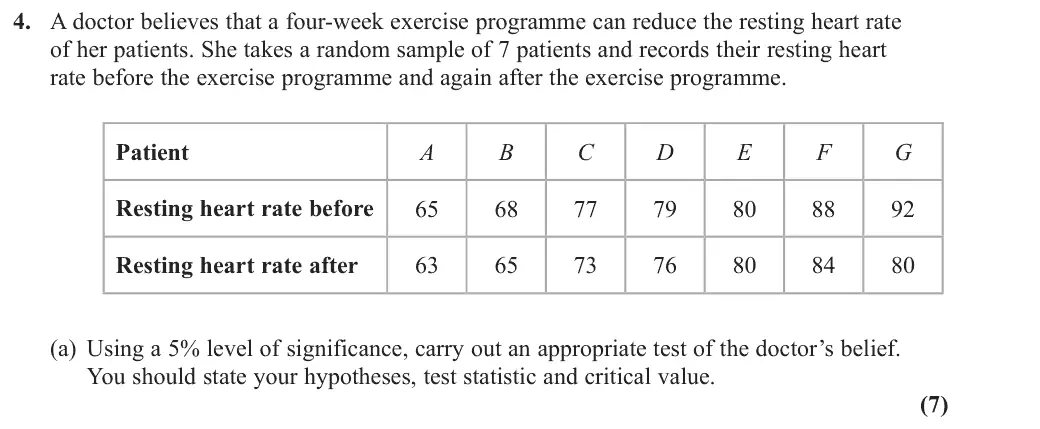
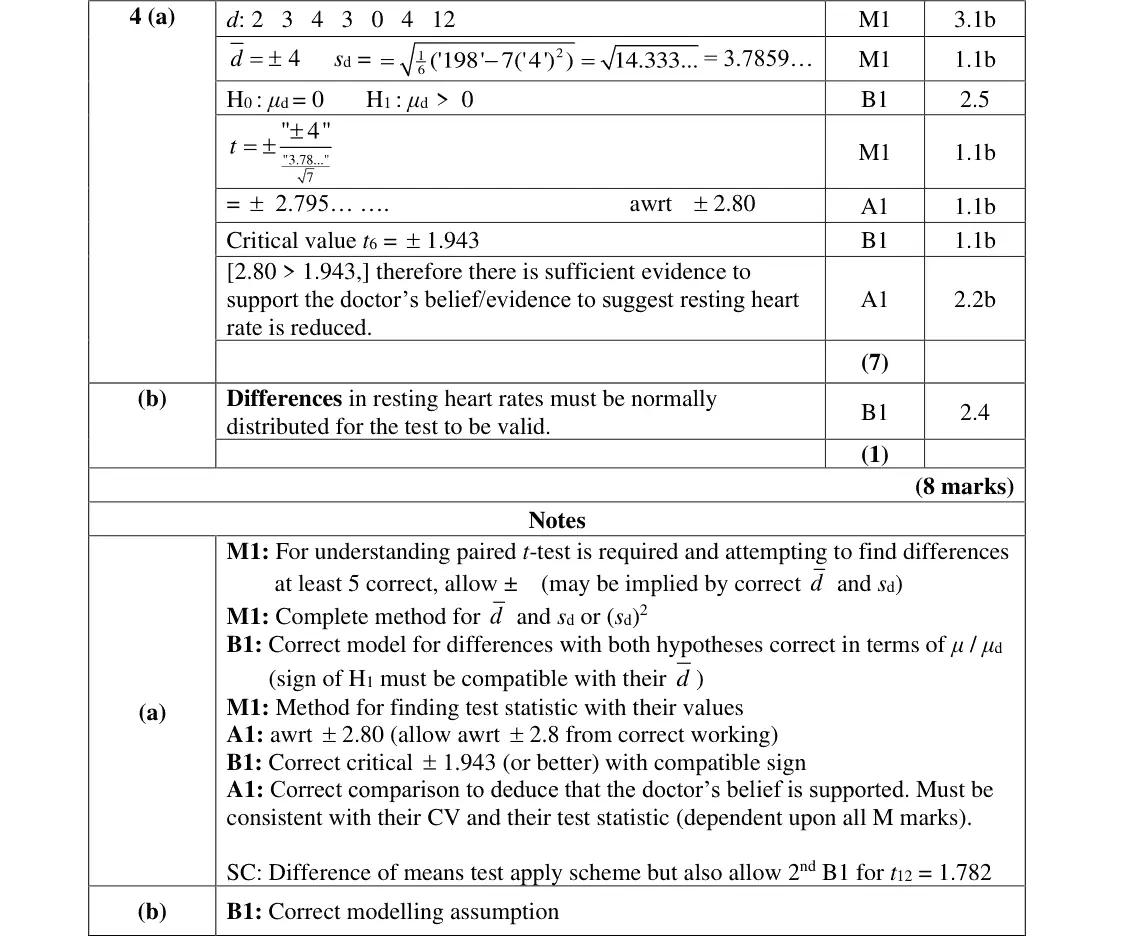
June 2022 · Paper 4B (Further Statistics 2) · Q4(a)7 marks
Mark scheme (whole question; this part is marked with the orange bar)
Examiner's comment
The candidates who recognised that a paired t-test was needed knew what to do. The errors made were usually minor such as making a slip with one of the differences (usually the last one) or failing to match their alternative hypothesis with the sign of their differences. Pleasingly most candidates selected the appropriate critical value for their t-value. The most common error was to use a difference of means test which resulted in those candidates gaining a maximum
Key points from the mark scheme and examiner's report
t = 2.80 > t₆ = 1.943, supports the doctor's belief
H₁ sign must match the differences
difference-of-means test is the common wrong method
June 2022 · Paper 4B (Further Statistics 2) · Q4(b)1 mark
Mark scheme (whole question; this part is marked with the orange bar)
Examiner's comment
of 1 mark for identifying an appropriate critical t -value. In part (b) only a few candidates showed understanding that the differences in the resting heart rates need to be normally distributed.
Key points from the mark scheme and examiner's report
the DIFFERENCES in resting heart rates are normally distributed
few said differences
Nov 2021 · Paper 4B (Further Statistics 2) · Q6(c)5 marks
Mark scheme (whole question; this part is marked with the orange bar)
Key points from the mark scheme and examiner's report
24s²/0.175² = 34.8, not in CR (χ²₂₄ < 13.848 or > 36.415), so no evidence σ has changed
June 2019 · Paper 4B (Further Statistics 2) · Q1(d)2 marks
Mark scheme (whole question; this part is marked with the orange bar)
Examiner's comment
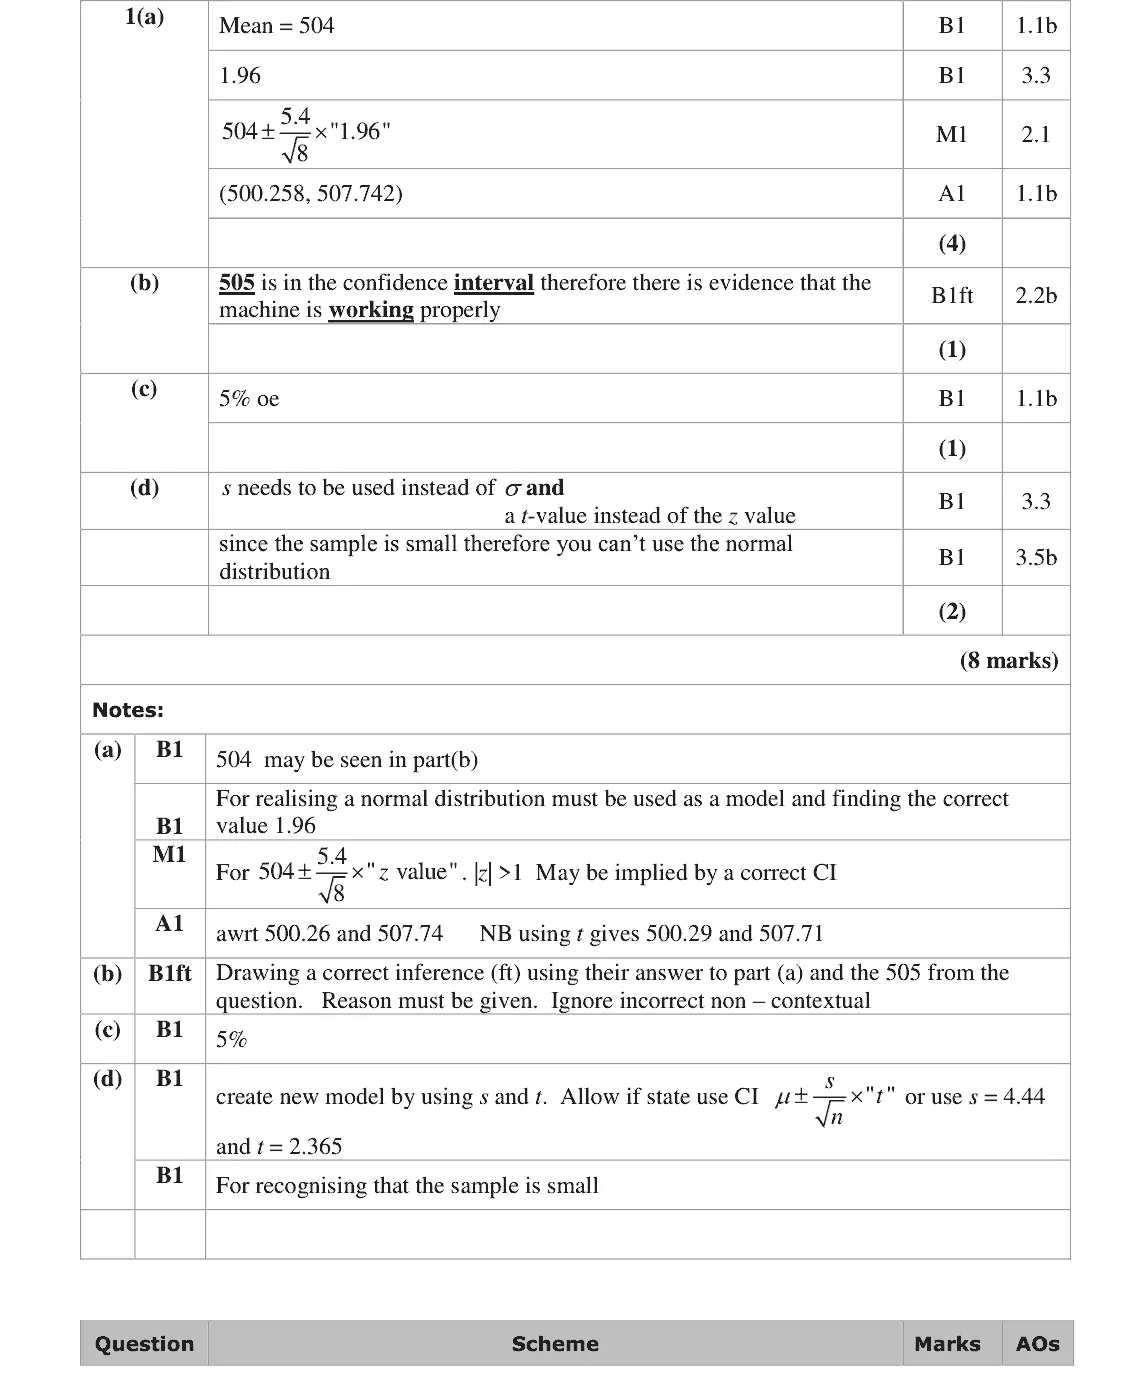
It was rare to see a fully correct answer in part (d). The idea that a t-value rather than a z value and s instead of 𝜎 was commonly seen but the reason of the sample being small was not common. The most common reason given was that 𝜎 was unknown. However more is need as it is n being small which means the Central limit theorem cannot be used.
Key points from the mark scheme and examiner's report
use s instead of σ and a t value (t₇ = 2.365) instead of z
the reason needed is that the sample is small (so CLT cannot be used), not just that σ is unknown
rarely fully correct
June 2019 · Paper 4B (Further Statistics 2) · Q57 marks
Mark scheme (whole question; this part is marked with the orange bar)
Examiner's comment
The candidates who recognised that a paired t-test was needed knew what to do. The errors made were usually numerical such as taking the differences as all positive or simply calculating one incorrectly. Pleasingly most candidates selected the appropriate CV for their t – value. The most common error was to use a difference of means test which resulted in those candidates gaining a maximum of 1 mark for the hypotheses.
Key points from the mark scheme and examiner's report
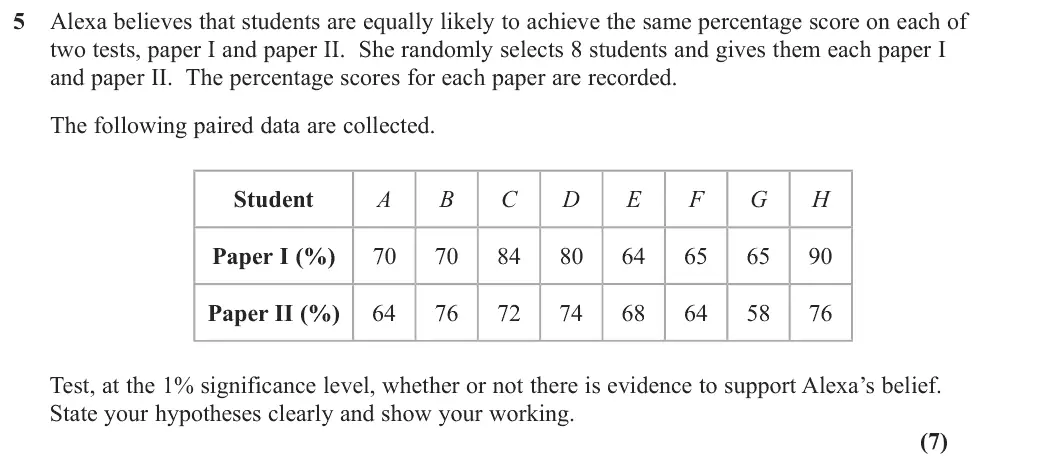
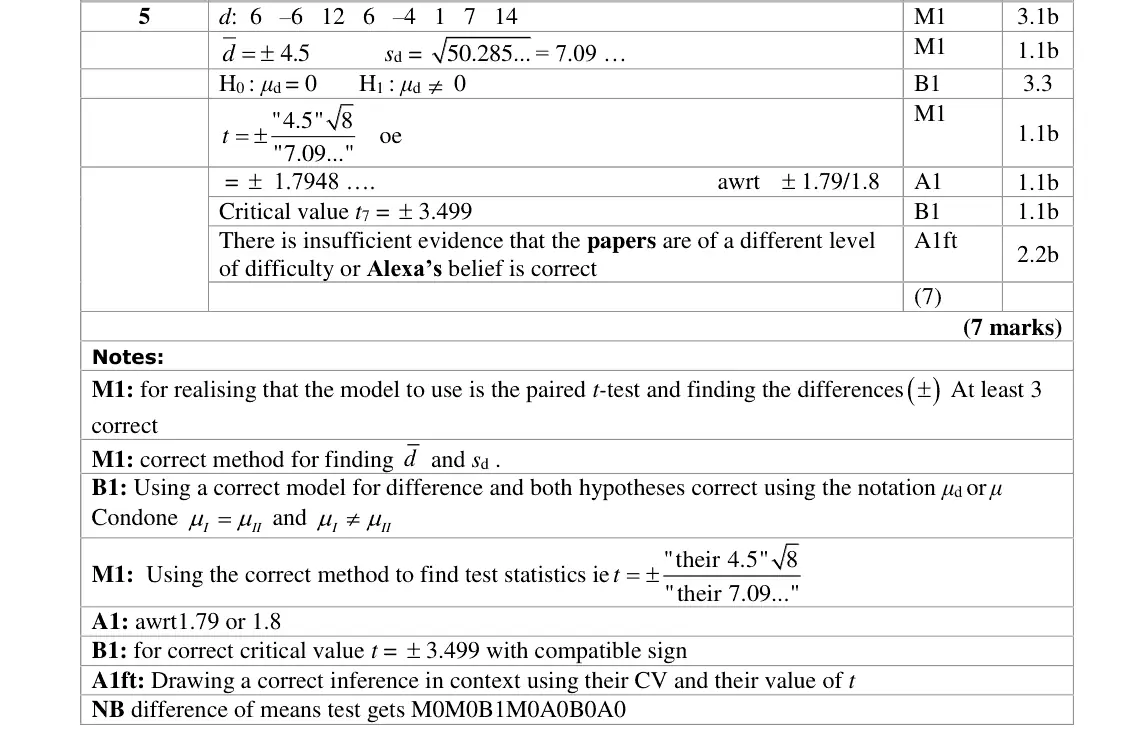
paired t-test: differences d̄ = 4.5, s_d = 7.09
H₀: μd = 0, H₁: μd ≠ 0
t = 1.79 < t₇ = 3.499 (1% two-tailed), insufficient evidence the papers differ, so Alexa's belief supported
difference-of-means test scores only the hypotheses mark
sign slips in differences
June 2019 · Paper 4B (Further Statistics 2) · Q69 marks
Mark scheme (whole question; this part is marked with the orange bar)
Examiner's comment
This question proved to be challenging for some. Candidates generally knew the test they needed to use but struggled to find a value for the unbiased estimator of sigma . The main loss of marks for those who realised that they had been given the confidence interval for the variance was to either not show the 2 value they had used or not show a method at all followed by a value for s that was inaccurate. The most common error was to think that the confidence interval was in fact for the mean rather than the variance. The marks they could then achieve depended on whether they had found s or sigma
Key points from the mark scheme and examiner's report
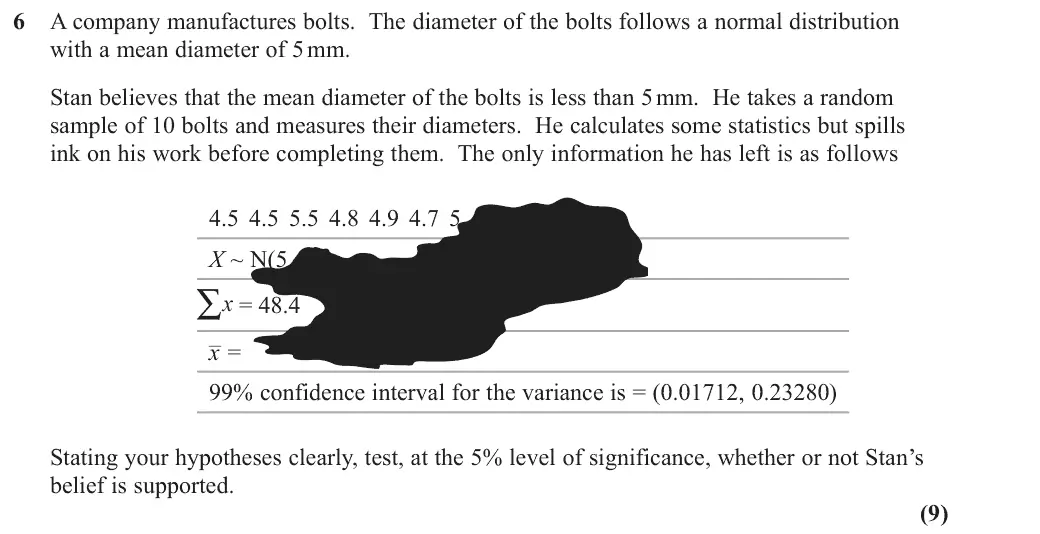
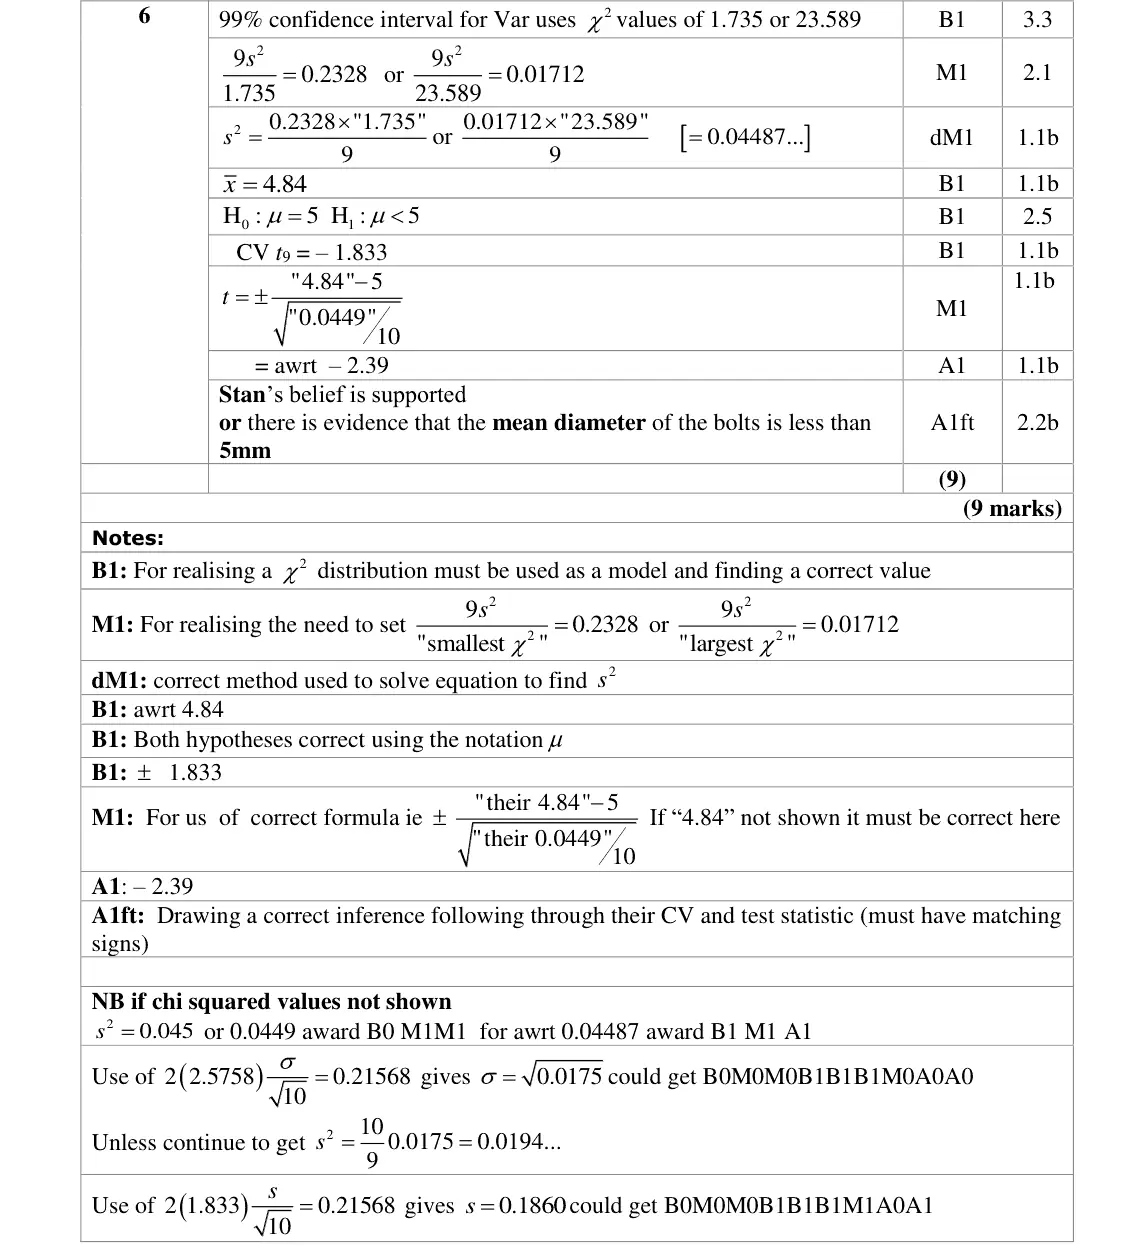
the given 99% interval is for the VARIANCE: 9s²/1.735 = 0.2328 so s² = 0.0449
x̄ = 4.84
H₀: μ = 5, H₁: μ < 5
t = −2.39 < −1.833 (t₉), Stan's belief supported
commonest error treating the interval as one for the mean
show the χ² values used
Find an Edexcel Further Maths tutor
Stuck on this? Book a trial lesson with our Further Maths tutor.