FS2.7.1 Hypothesis test and confidence interval for the mean of a Normal…

Section
FS2.7 Confidence intervals and tests using the t – distribution
Level
A level only
Statement
Hypothesis test and confidence interval for the mean of a Normal distribution with unknown variance.
Guidance
Use of (X̄ − μ)/(S/√n) ~ tₙ₋₁. Candidates may use t-tables or their calculators to calculate critical or p-values.
Since 2018
6 parts, 33 marks · topic pages: The t-distribution: t-tests and paired t-tests, Variance tests: chi-squared and F-distribution, Estimators, confidence intervals and tests using the normal distribution

Back to the checklist

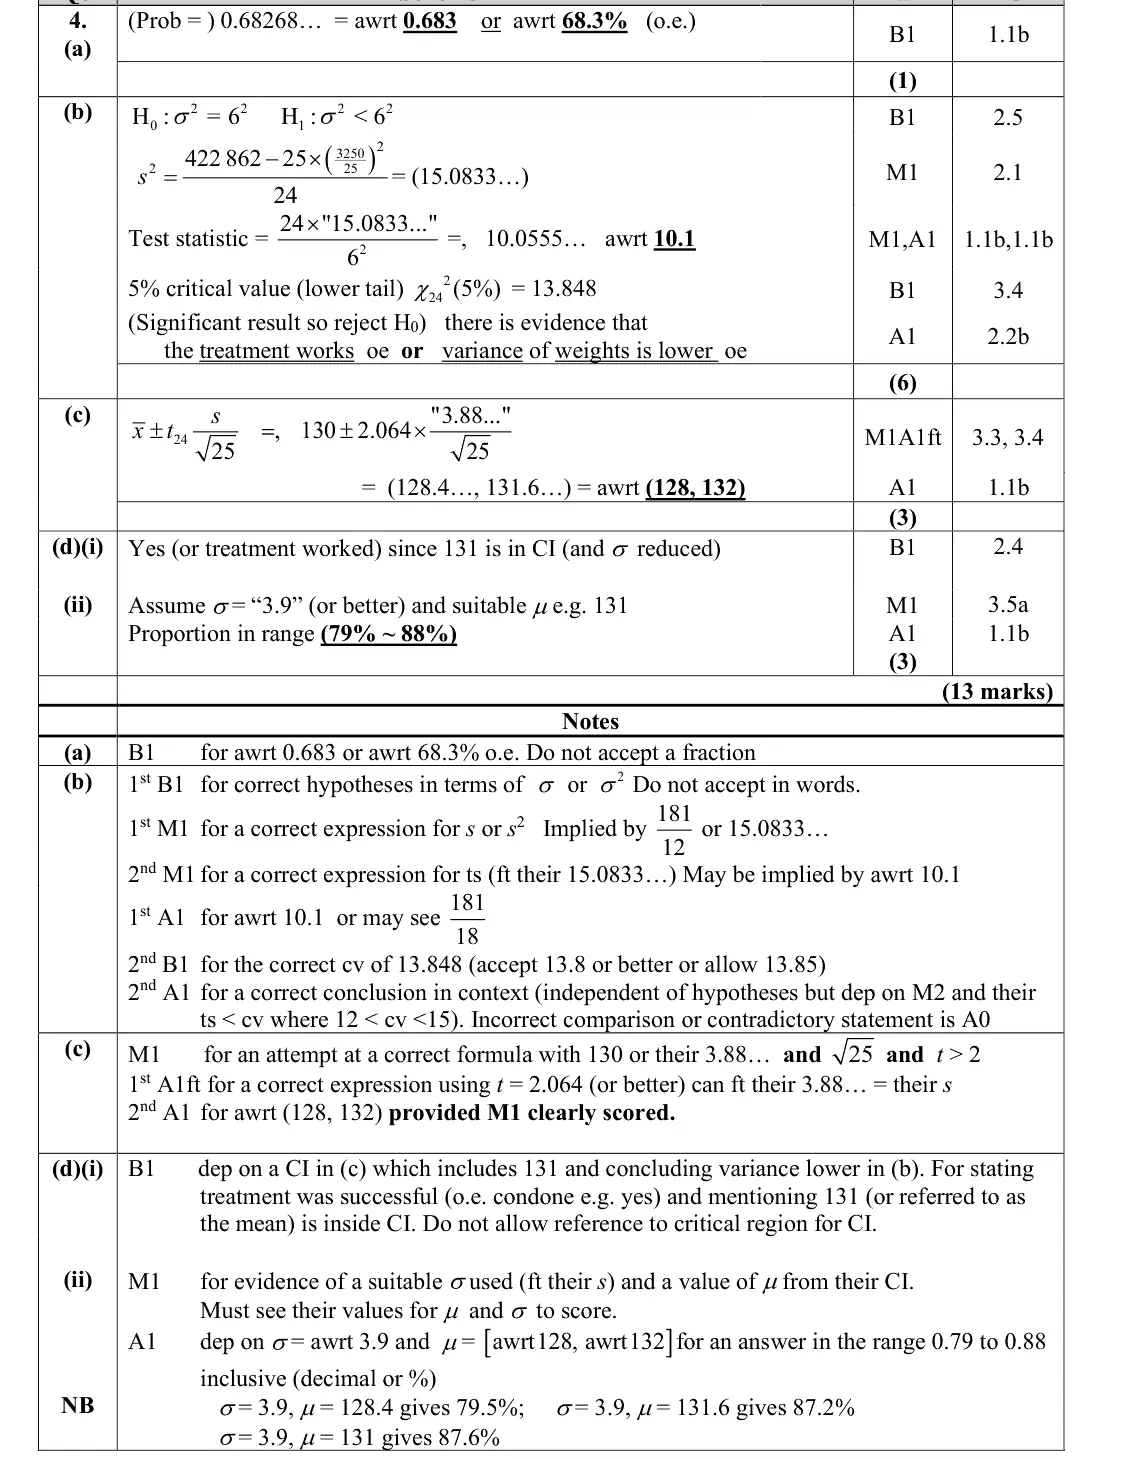
June 2025 · Paper 4B (Further Statistics 2) · Q4(c) 3 marks
(c) Calculate a 95% confidence interval for the mean weight of apples produced by Sam’s trees after treatment. You should clearly state the formula and numerical expression you have used. (3)
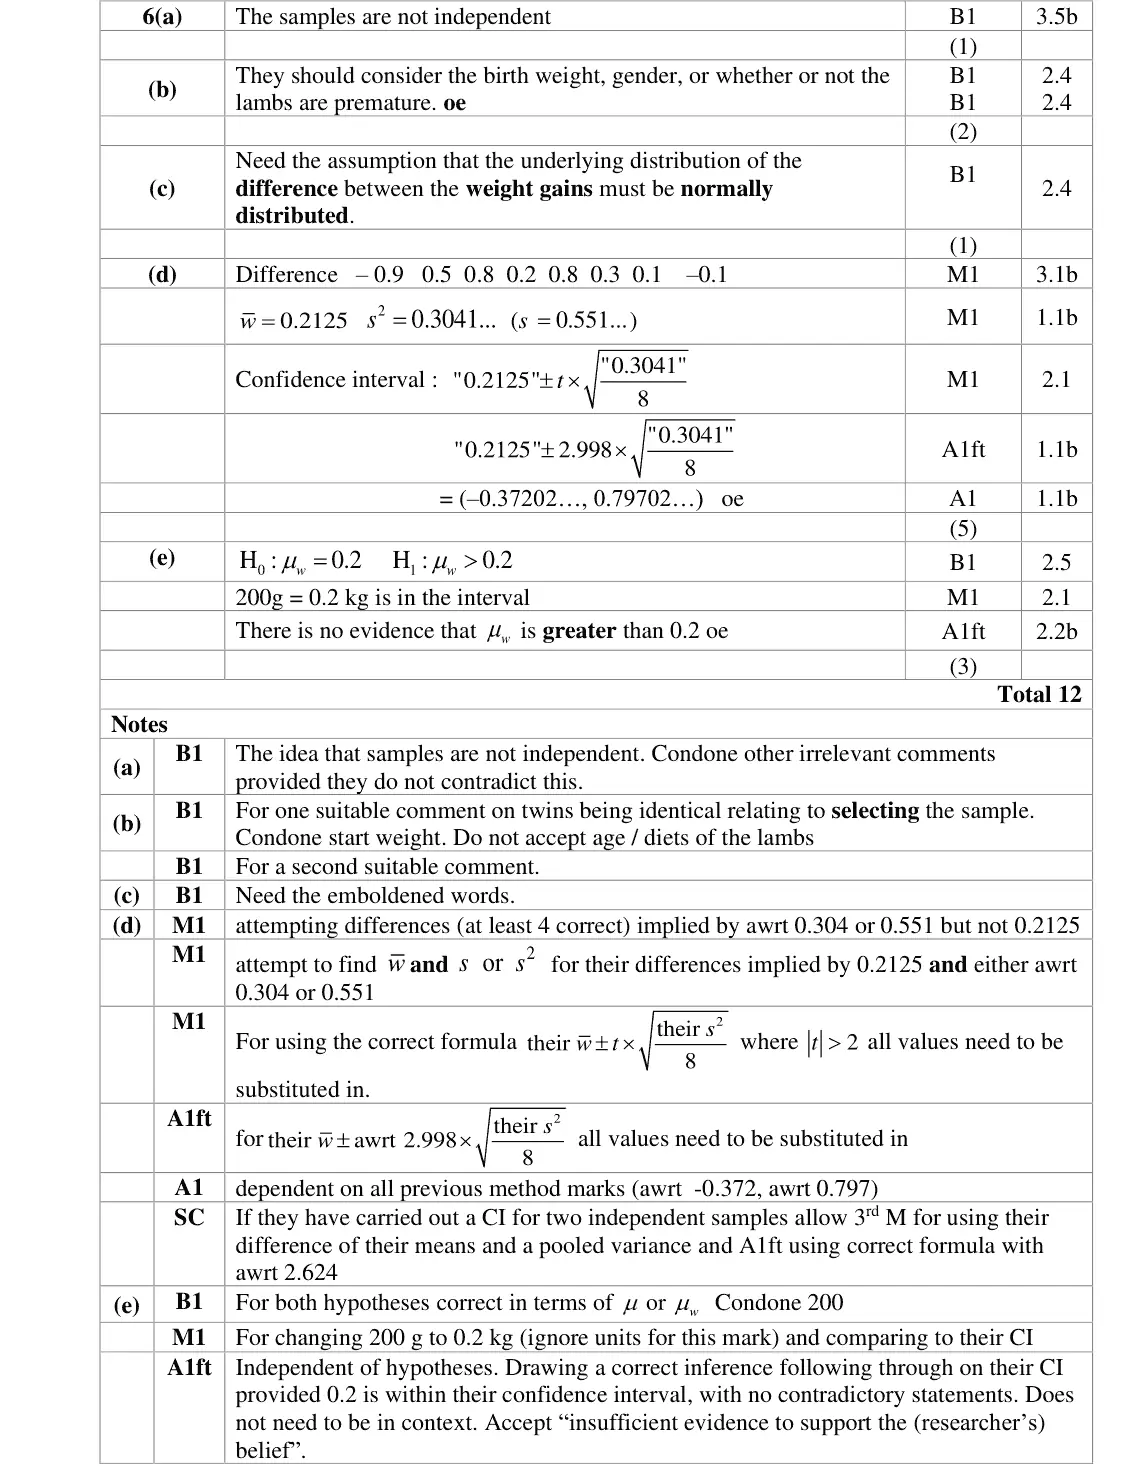
June 2024 · Paper 4B (Further Statistics 2) · Q6(d) 5 marks
For a pair of twin lambs, the random variable W represents the weight gain of the lamb given the food supplement minus the weight gain of the lamb not given the food supplement. (d) Using the data in the table, calculate a 98% confidence interval for the mean of W Show your working clearly. (5)
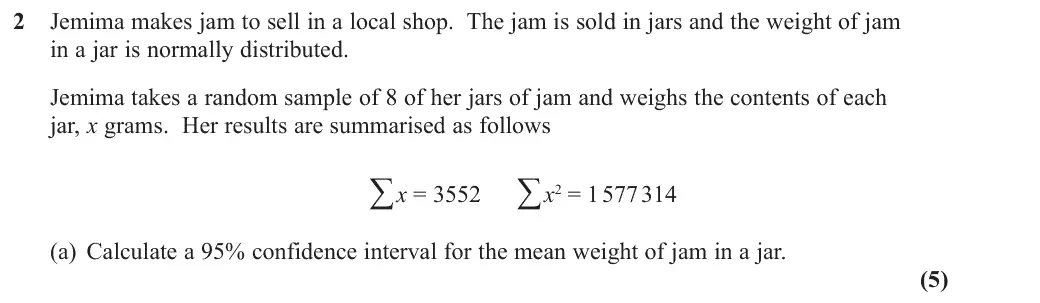
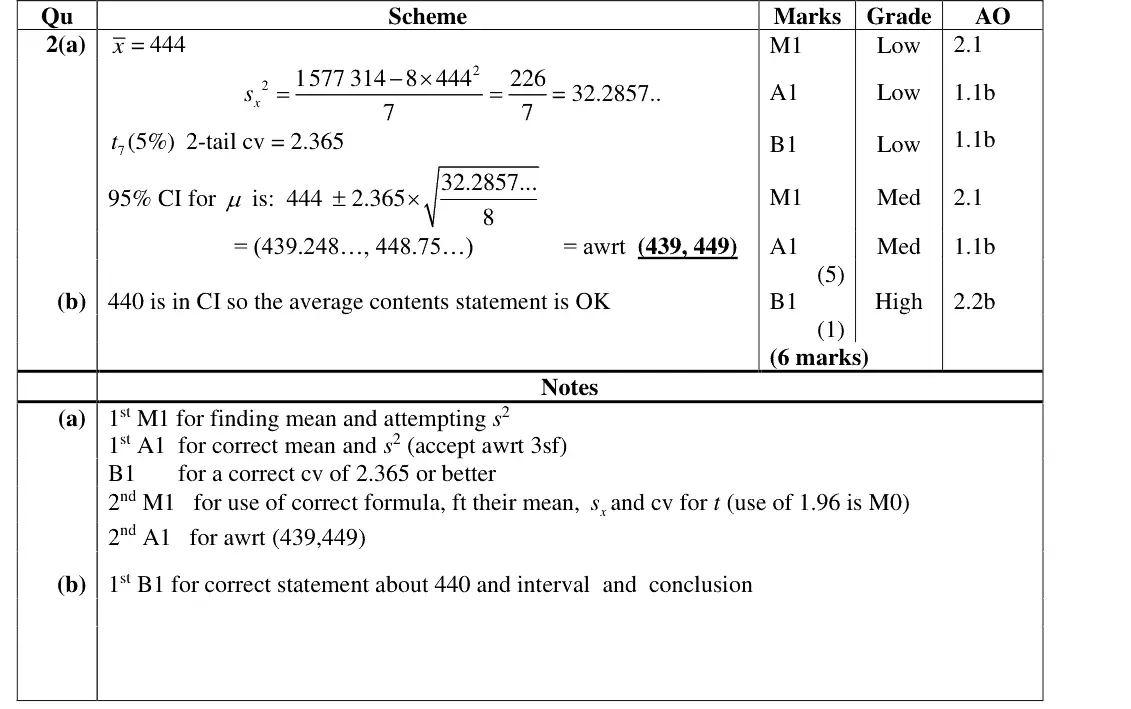
Oct 2020 · Paper 4B (Further Statistics 2) · Q2(a) 5 marks
2 Jemima makes jam to sell in a local shop. The jam is sold in jars and the weight of jam in a jar is normally distributed. Jemima takes a random sample of 8 of her jars of jam and weighs the contents of each jar, x grams. Her results are summarised as follows ∑ x = 3552 ∑ x2 = 1 577 314 (a) Calculate a 95% confidence interval for the mean weight of jam in a jar. (5)
Oct 2020 · Paper 4B (Further Statistics 2) · Q6(a) 9 marks
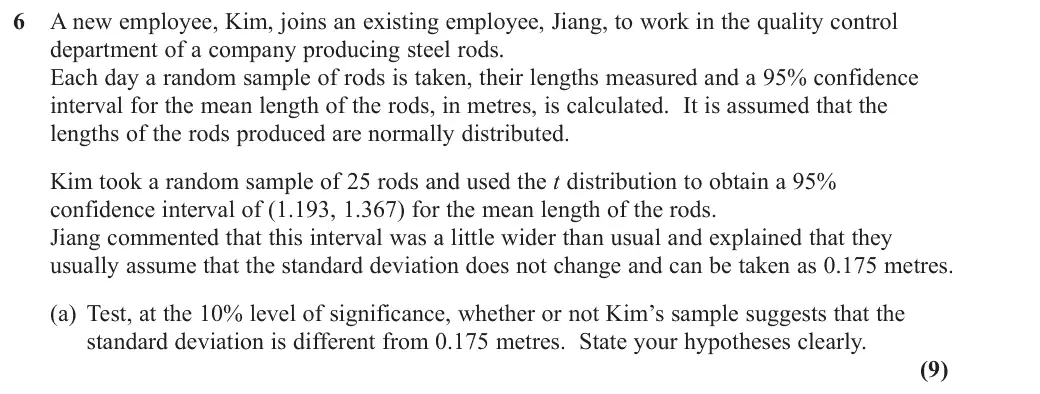
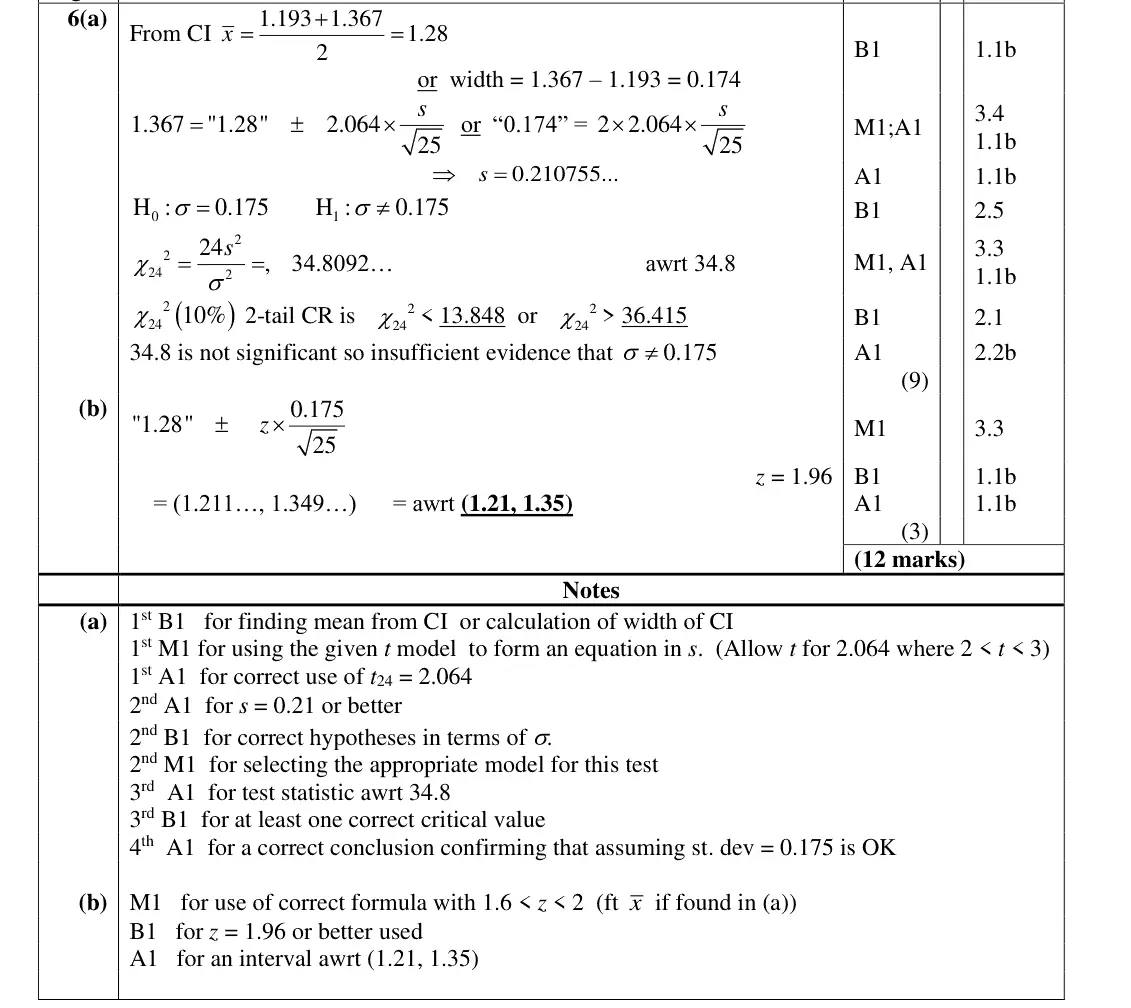
6 A new employee, Kim, joins an existing employee, Jiang, to work in the quality control department of a company producing steel rods. Each day a random sample of rods is taken, their lengths measured and a 95% confidence interval for the mean length of the rods, in metres, is calculated. It is assumed that the lengths of the rods produced are normally distributed. Kim took a random sample of 25 rods and used the t distribution to obtain a 95% confidence interval of (1.193, 1.367) for the mean length of the rods. Jiang commented that this interval was a little wider than usual and explained that they usually assume that the standard deviation does not change and can be taken as 0.175 metres. (a) Test, at the 10% level of significance, whether or not Kim’s sample suggests that the standard deviation is different from 0.175 metres. State your hypotheses clearly. (9)
June 2019 · Paper 4B (Further Statistics 2) · Q1(d) 2 marks
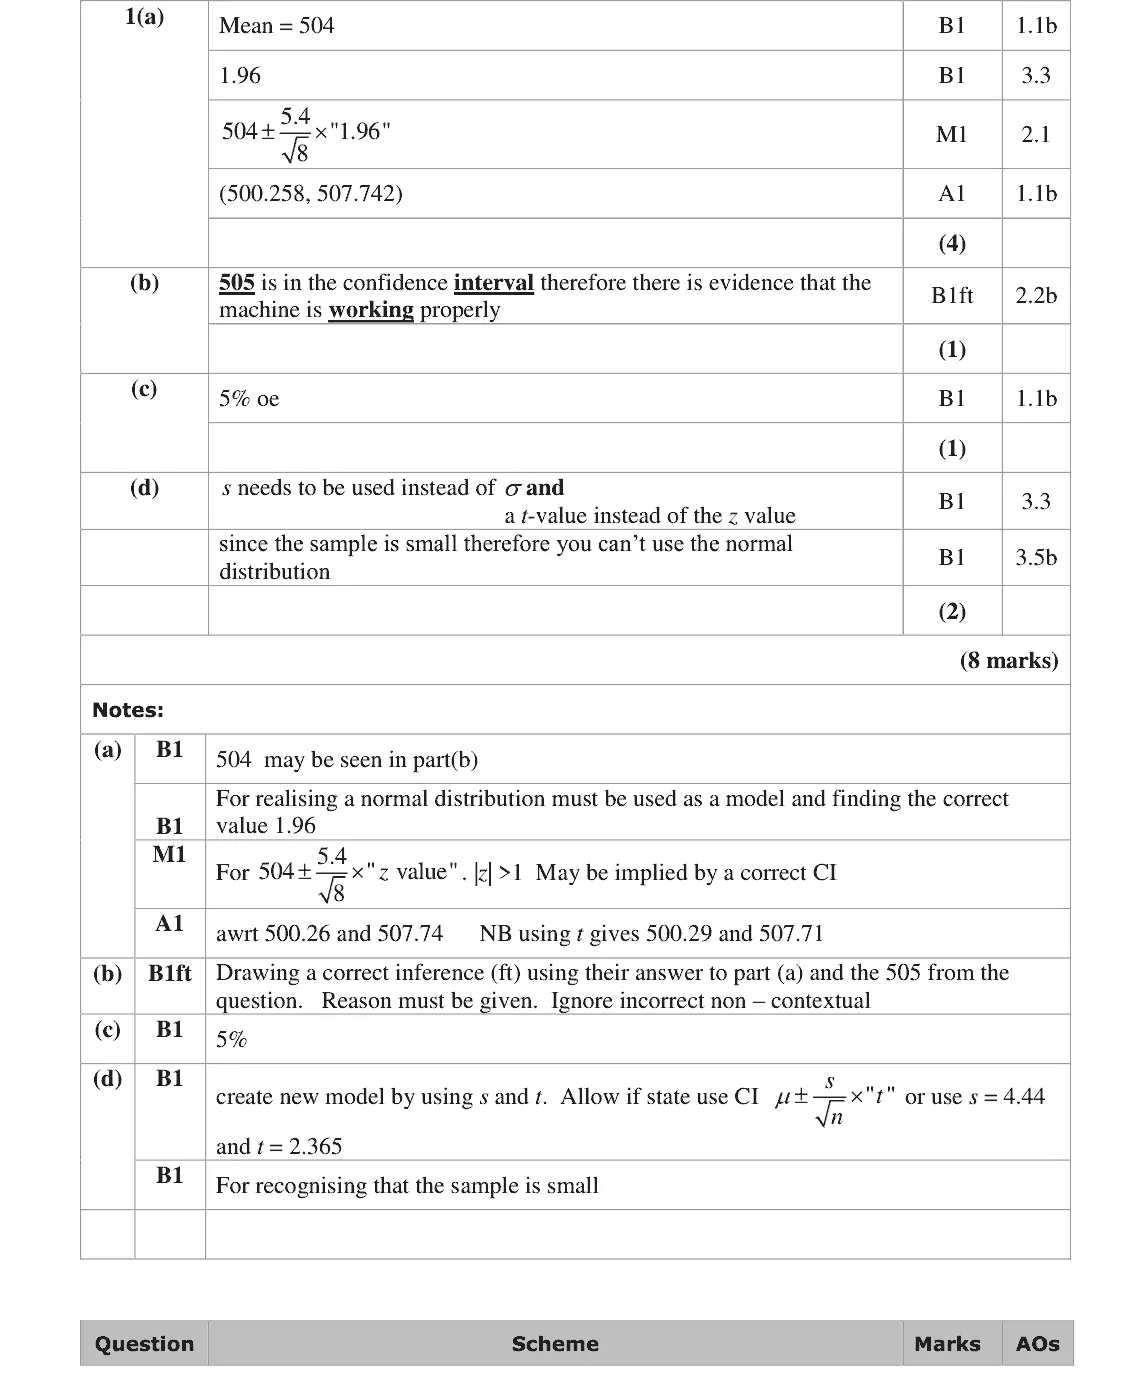
(d) Without carrying out any further calculations, explain the changes, if any, that would need to be made in calculating the confidence interval in part (a) if the standard deviation was unknown. Give a reason for your answer. You may assume that the weights of the yoghurt delivered by the machine still follow a normal distribution. (2)
June 2019 · Paper 4B (Further Statistics 2) · Q6 9 marks
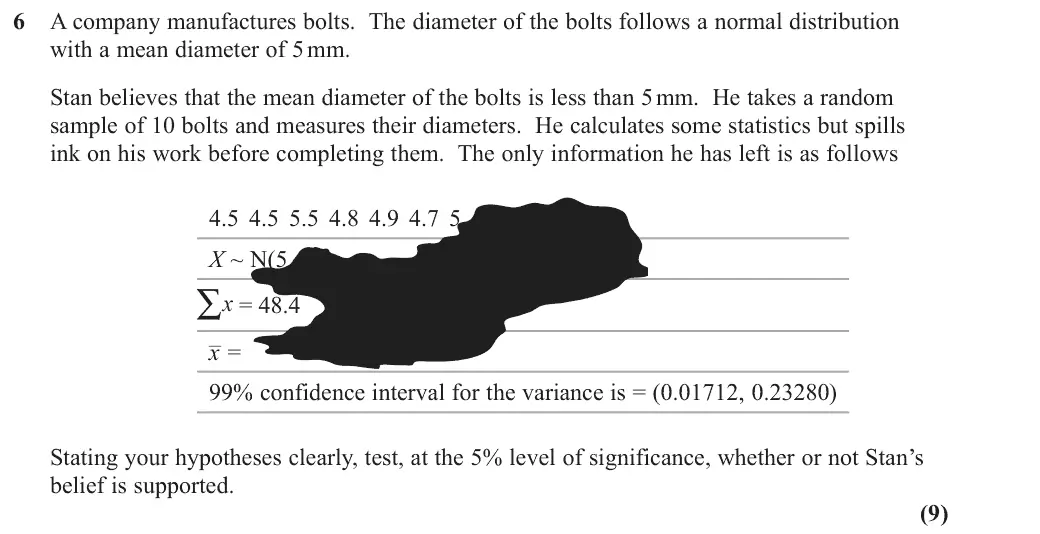
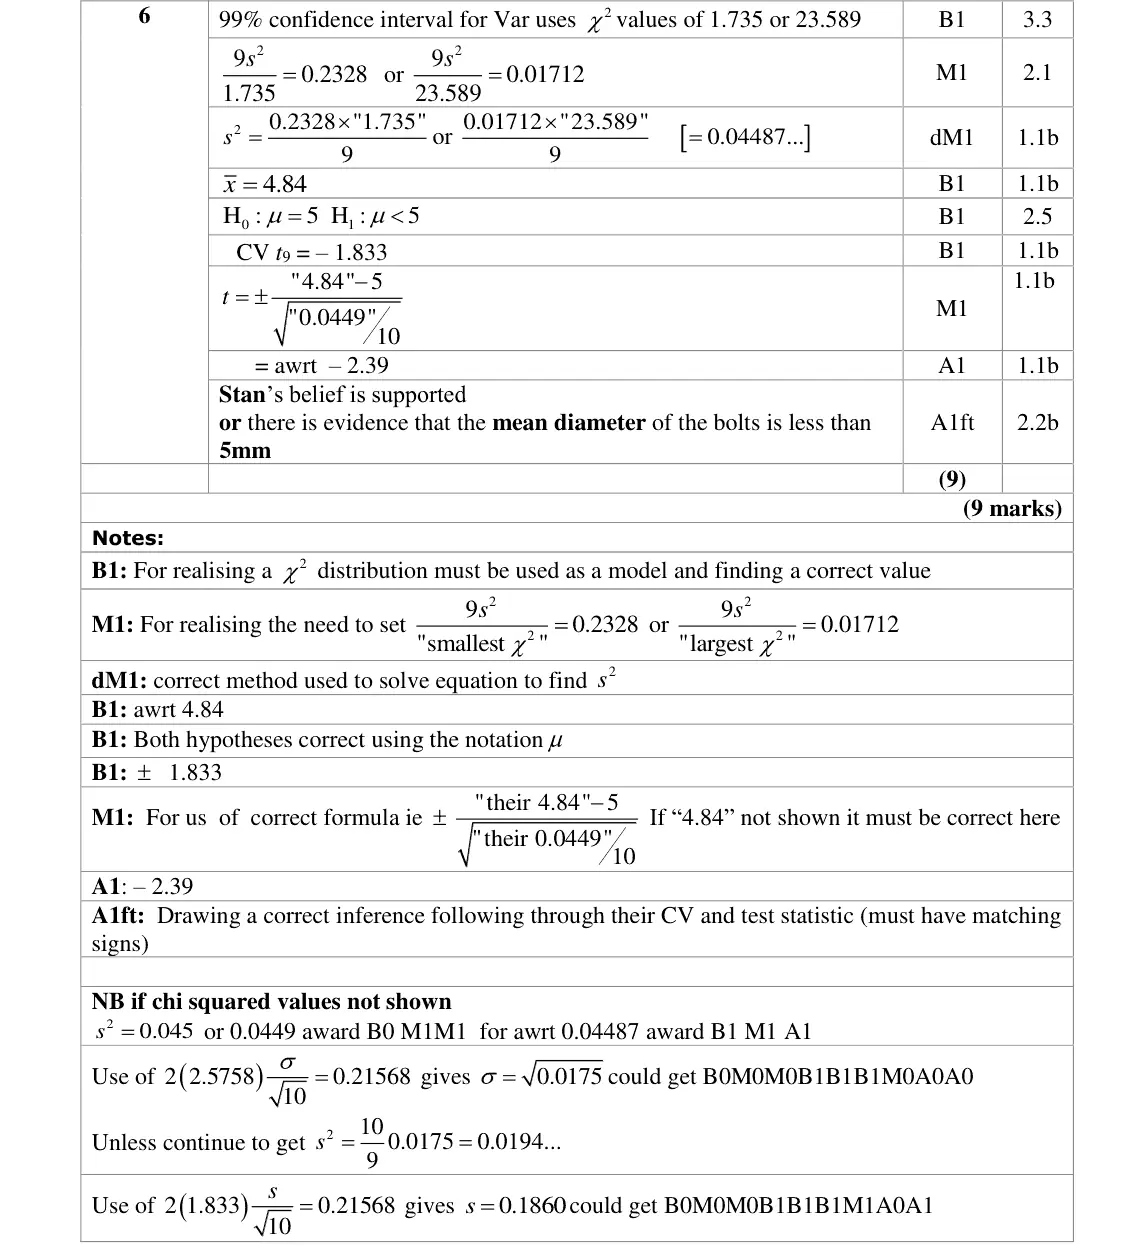
6 A company manufactures bolts. The diameter of the bolts follows a normal distribution with a mean diameter of 5 mm. Stan believes that the mean diameter of the bolts is less than 5 mm. He takes a random sample of 10 bolts and measures their diameters. He calculates some statistics but spills ink on his work before completing them. The only information he has left is as follows 4.5 4.5 5.5 4.8 4.9 4.7 5 X ~ N(5 2) ∑ x = 48.4 x– = 99% confidence interval for the variance is = (0.01712, 0.23280) Stating your hypotheses clearly, test, at the 5% level of significance, whether or not Stan’s belief is supported. (9)

Find an Edexcel Further Maths tutor

Stuck on this? Book a trial lesson with our Further Maths tutor.

Prefer email? Send an enquiry

If you are under 18, please include a parent's contact details. Enquiries go to enquiries@alevelfurthermathstutor.com and are deleted once handled.