June 2018: AS Paper 23: Further Statistics 1

40 marks · 13 question parts · Question paper, mark scheme and examiner's report on Pearson's site

Question by question

QTopicMarksDifficulty
1(a) Chi-squared tests: goodness of fit and contingency tables 1 —
1(b) Chi-squared tests: goodness of fit and contingency tables 1 —
1(c) Chi-squared tests: goodness of fit and contingency tables 2 —
1(d) Chi-squared tests: goodness of fit and contingency tables 2 —
1(e) Poisson and binomial distributions 4 —
2(a) Poisson and binomial distributions 1 —
2(b) Poisson and binomial distributions 2 —
2(c) Poisson and binomial distributions 3 —
2(d) Hypothesis tests: Poisson, binomial and geometric, Poisson and binomial distributions 5 —
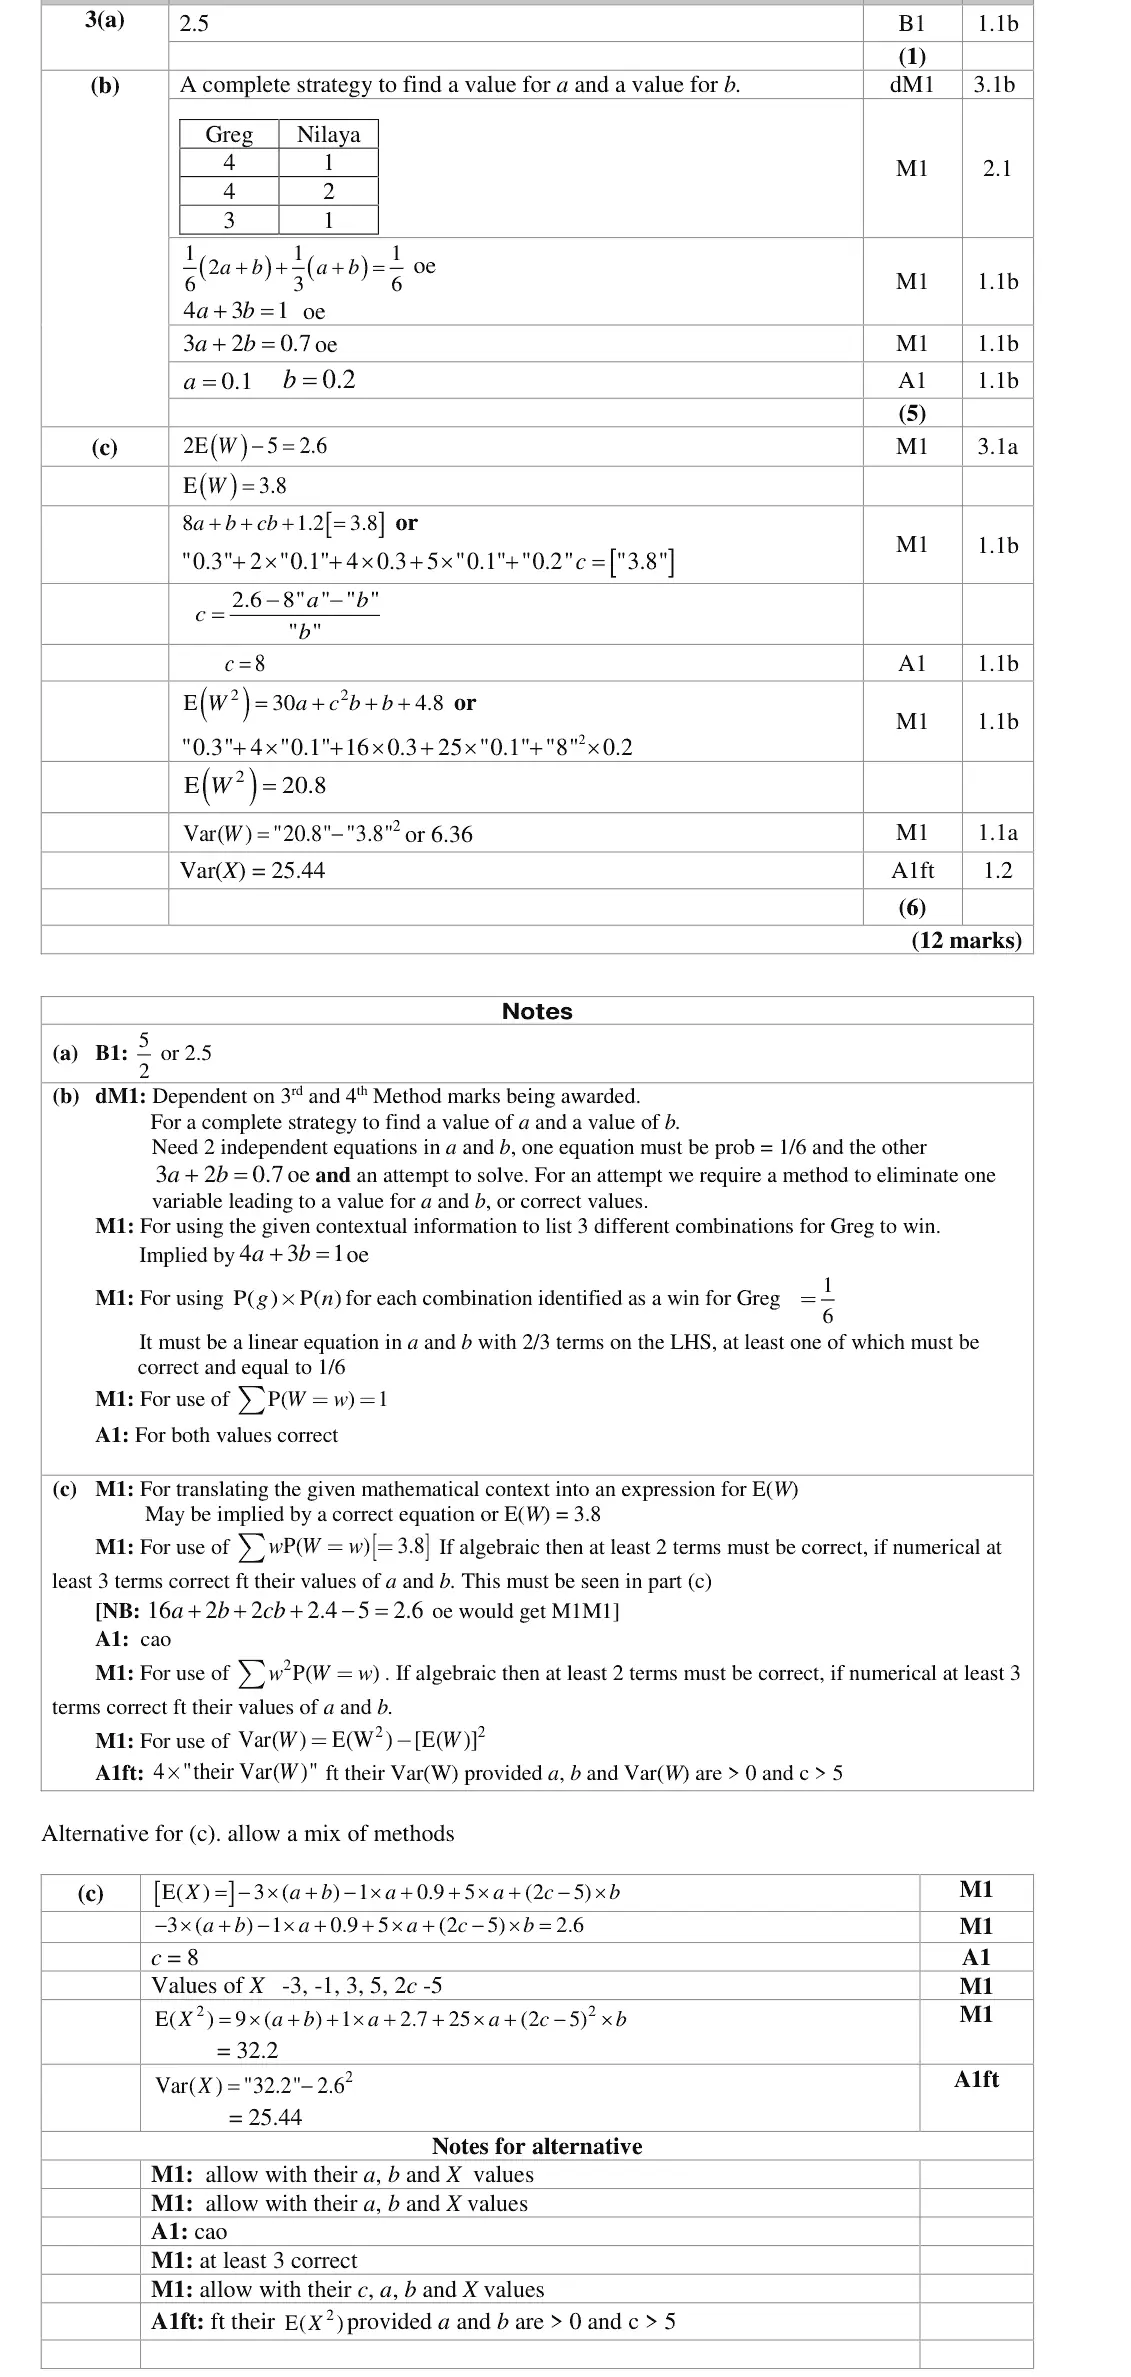
3(a) Discrete random variables: mean and variance 1 —
3(b) Discrete random variables: mean and variance 5 —
3(c) Discrete random variables: mean and variance 6 —
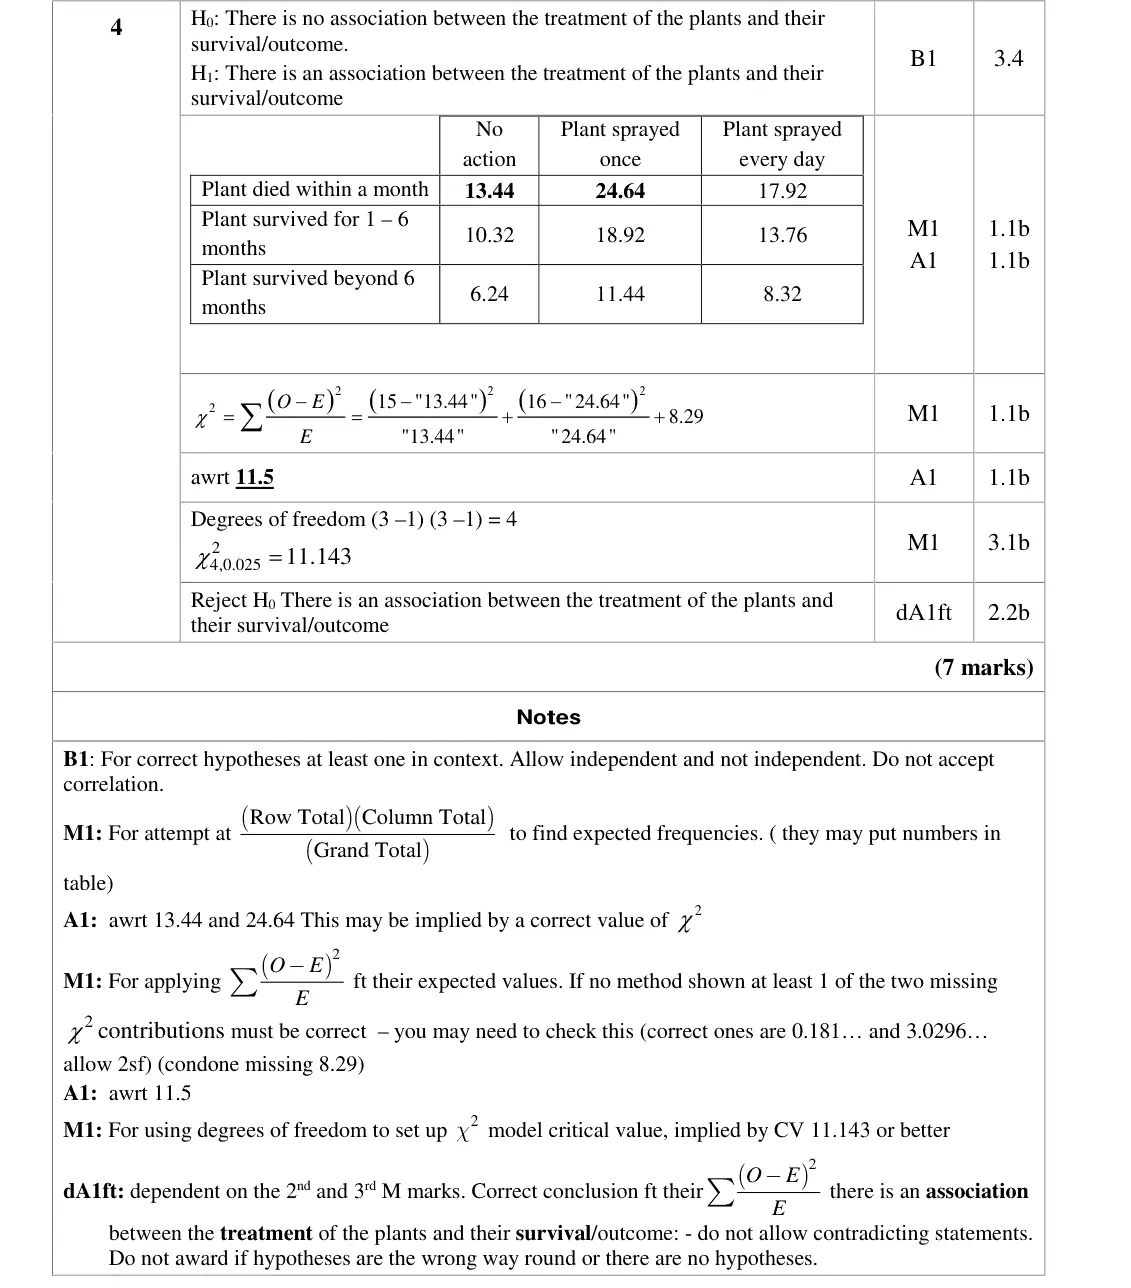
4 Chi-squared tests: goodness of fit and contingency tables 7 —

The questions

1(a)1(b)1(c)1(d)1(e)2(a)2(b)2(c)2(d)3(a)3(b)3(c)4
June 2018 · AS Paper 2 (Further Statistics 1) · Q1(a) 1 mark chi squared tests
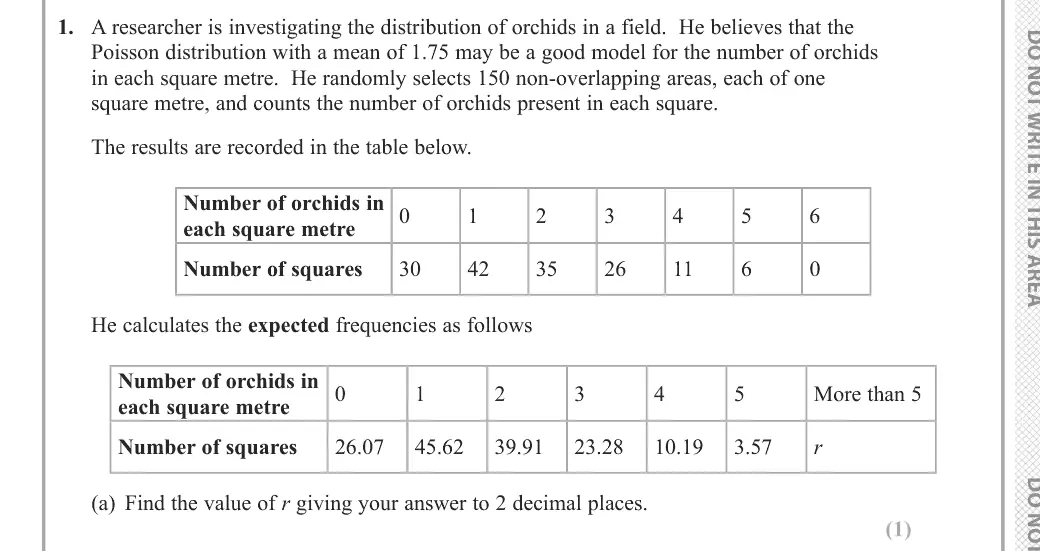
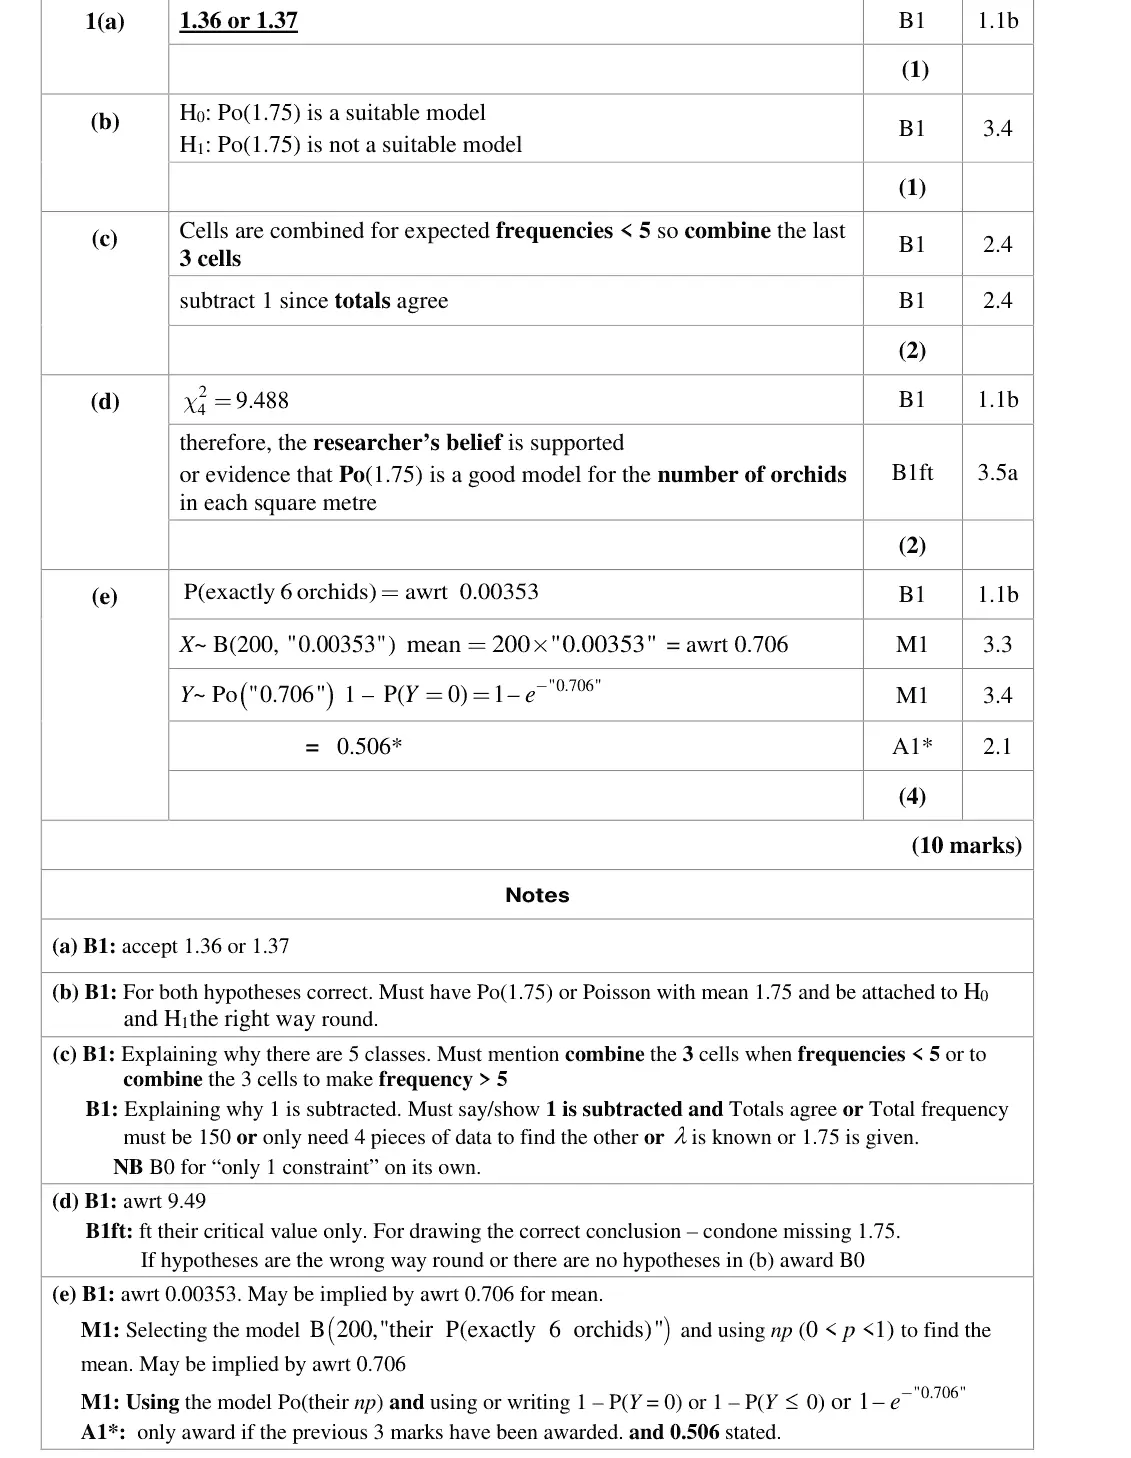
1. A researcher is investigating the distribution of orchids in a field. He believes that the Poisson distribution with a mean of 1.75 may be a good model for the number of orchids in each square metre. He randomly selects 150 non-overlapping areas, each of one square metre, and counts the number of orchids present in each square. The results are recorded in the table below. Number of orchids in each square metre Number of squares He calculates the expected frequencies as follows Number of orchids in More than 5 each square metre Number of squares 26.07 45.62 39.91 23.28 10.19 3.57 r (a) Find the value of r giving your answer to 2 decimal places. (1)
June 2018 · AS Paper 2 (Further Statistics 1) · Q1(b) 1 mark chi squared tests
The researcher will test, at the 5% level of significance, whether or not the data can be modelled by a Poisson distribution with mean 1.75 (b) State clearly the hypotheses required to test whether or not this Poisson distribution is a suitable model for these data. (1)
June 2018 · AS Paper 2 (Further Statistics 1) · Q1(c) 2 marks chi squared tests
The test statistic for this test is 2.0 and the number of degrees of freedom to be used is 4 (c) Explain fully why there are 4 degrees of freedom. (2)
June 2018 · AS Paper 2 (Further Statistics 1) · Q1(d) 2 marks chi squared tests
(d) Stating your critical value clearly, determine whether or not these data support the researcher’s belief. (2)
June 2018 · AS Paper 2 (Further Statistics 1) · Q1(e) 4 marks poisson distribution
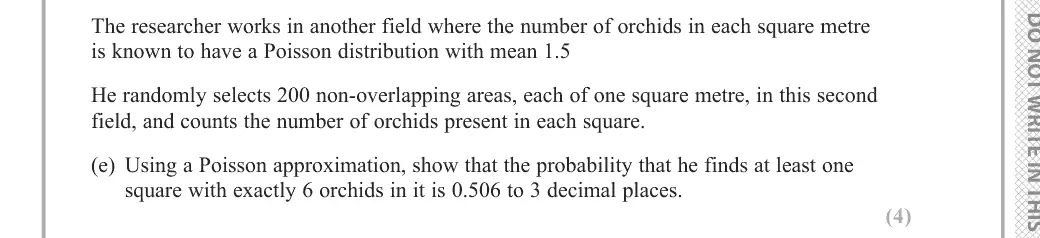
The researcher works in another field where the number of orchids in each square metre is known to have a Poisson distribution with mean 1.5 He randomly selects 200 non-overlapping areas, each of one square metre, in this second field, and counts the number of orchids present in each square. (e) Using a Poisson approximation, show that the probability that he finds at least one square with exactly 6 orchids in it is 0.506 to 3 decimal places. (4)
June 2018 · AS Paper 2 (Further Statistics 1) · Q2(a) 1 mark poisson distribution
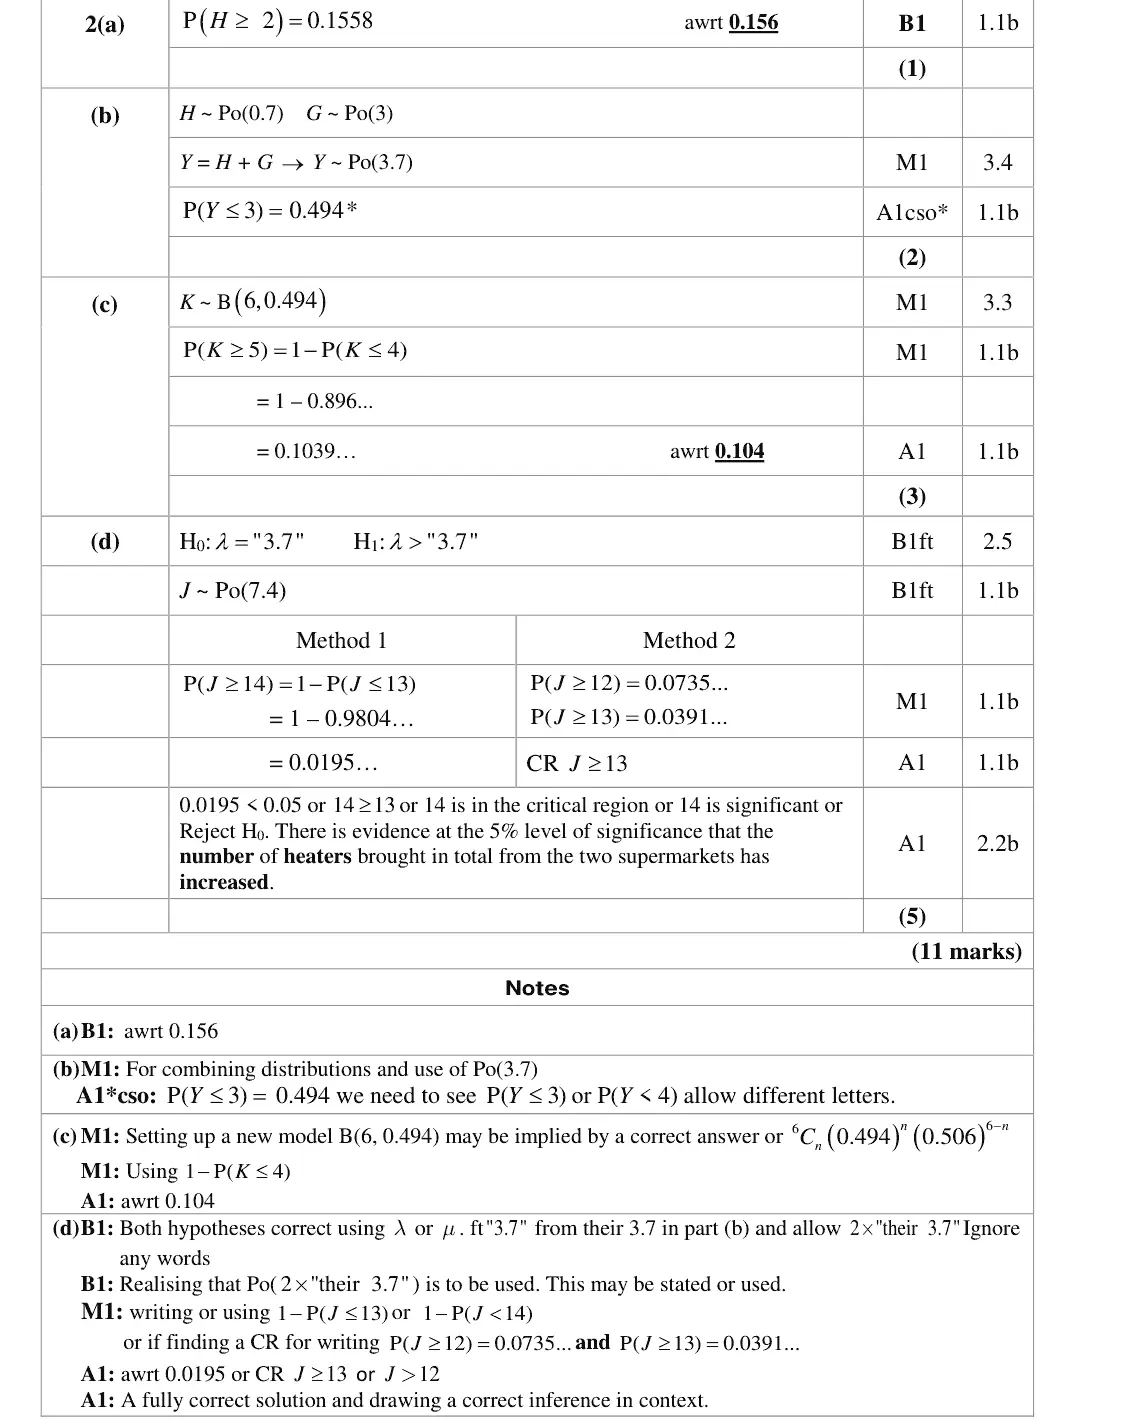
2. The number of heaters, H, bought during one day from Warmup supermarket can be modelled by a Poisson distribution with mean 0.7 (a) Calculate P(H 2) (1)
June 2018 · AS Paper 2 (Further Statistics 1) · Q2(b) 2 marks poisson distribution
The number of heaters, G, bought during one day from Pumraw supermarket can be modelled by a Poisson distribution with mean 3, where G and H are independent. (b) Show that the probability that a total of fewer than 4 heaters are bought from these two supermarkets in a day is 0.494 to 3 decimal places. (2)
June 2018 · AS Paper 2 (Further Statistics 1) · Q2(c) 3 marks poisson distribution
(c) Calculate the probability that a total of fewer than 4 heaters are bought from these two supermarkets on at least 5 out of 6 randomly chosen days. (3)
June 2018 · AS Paper 2 (Further Statistics 1) · Q2(d) 5 marks hypothesis tests fs1poisson distribution
December was particularly cold. Two days in December were selected at random and the total number of heaters bought from these two supermarkets was found to be 14 (d) Test whether or not the mean of the total number of heaters bought from these two supermarkets had increased. Use a 5% level of significance and state your hypotheses clearly. (5)
June 2018 · AS Paper 2 (Further Statistics 1) · Q3(a) 1 mark discrete random variables
3. A fair six-sided black die has faces numbered 1, 2, 2, 3, 3 and 4 The random variable B represents the score when the black die is rolled. (a) Write down the value of E(B) (1)
June 2018 · AS Paper 2 (Further Statistics 1) · Q3(b) 5 marks discrete random variables
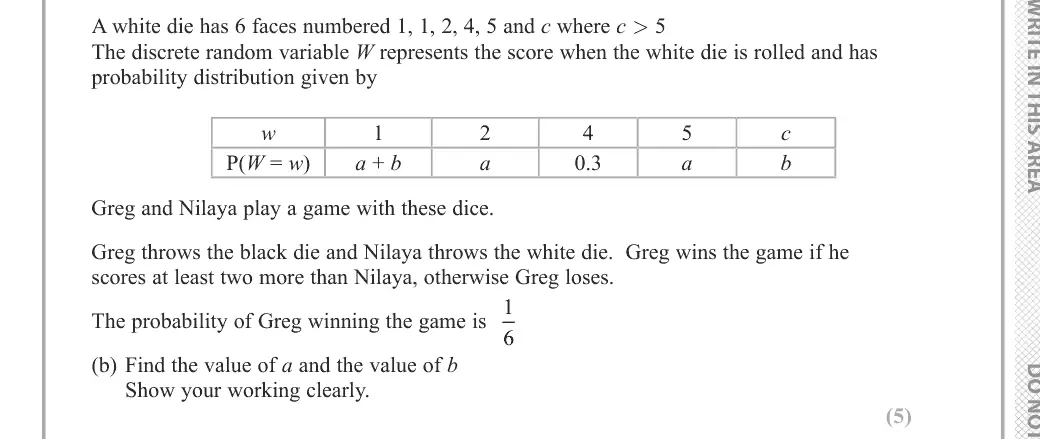
A white die has 6 faces numbered 1, 1, 2, 4, 5 and c where c > 5 The discrete random variable W represents the score when the white die is rolled and has probability distribution given by w c P(W = w) a + b a 0.3 a b Greg and Nilaya play a game with these dice. Greg throws the black die and Nilaya throws the white die. Greg wins the game if he scores at least two more than Nilaya, otherwise Greg loses. The probability of Greg winning the game is 1 (b) Find the value of a and the value of b Show your working clearly. (5)
June 2018 · AS Paper 2 (Further Statistics 1) · Q3(c) 6 marks discrete random variables
The random variable X = 2W – 5 Given that E(X) = 2.6 (c) find the exact value of Var(X) (6)
June 2018 · AS Paper 2 (Further Statistics 1) · Q4 7 marks chi squared tests
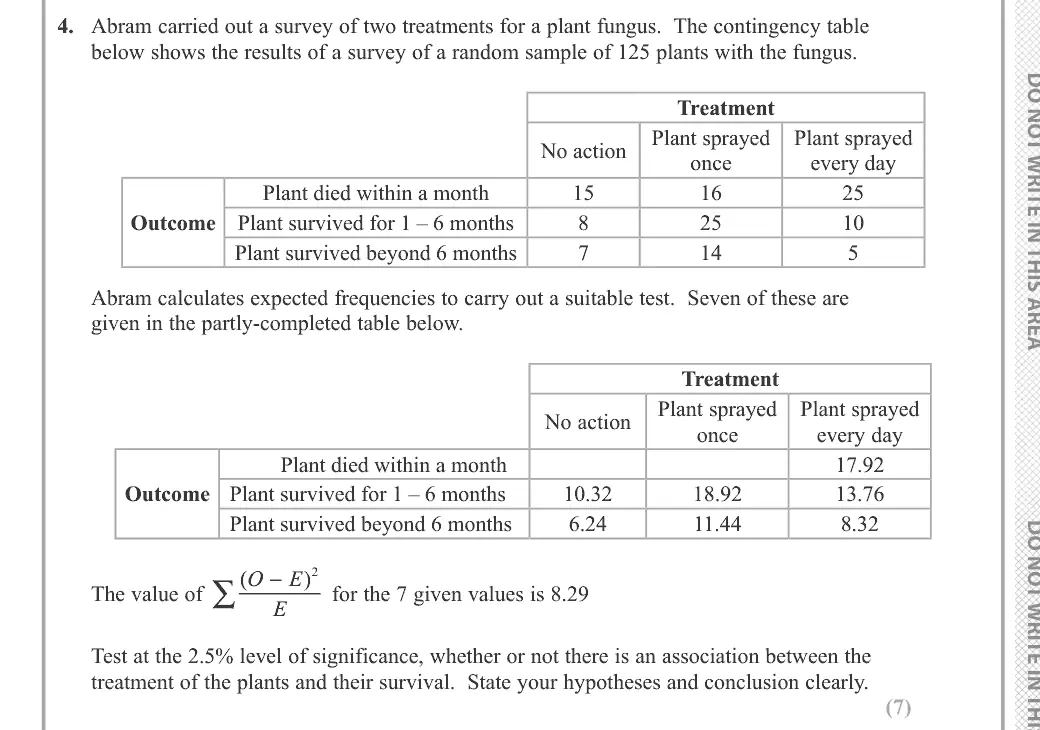
4. Abram carried out a survey of two treatments for a plant fungus. The contingency table below shows the results of a survey of a random sample of 125 plants with the fungus. Treatment Plant sprayed Plant sprayed No action once every day Plant died within a month Outcome Plant survived for 1 – 6 months Plant survived beyond 6 months Abram calculates expected frequencies to carry out a suitable test. Seven of these are given in the partly-completed table below. Treatment Plant sprayed Plant sprayed No action once every day Plant died within a month 17.92 Outcome Plant survived for 1 – 6 months 10.32 18.92 13.76 Plant survived beyond 6 months 6.24 11.44 8.32 ( - E ) ∑ The value of for the 7 given values is 8.29 E Test at the 2.5% level of significance, whether or not there is an association between the treatment of the plants and their survival. State your hypotheses and conclusion clearly. (7)

Find an Edexcel Further Maths tutor

Want this paper marked and gone through with a Further Maths tutor? Message us.

Prefer email? Send an enquiry

If you are under 18, please include a parent's contact details. Enquiries go to enquiries@alevelfurthermathstutor.com and are deleted once handled.