June 2025: AS Paper 23: Further Statistics 1

40 marks · 16 question parts · Question paper, mark scheme and examiner's report on Pearson's site

Question by question

QTopicMarksDifficulty
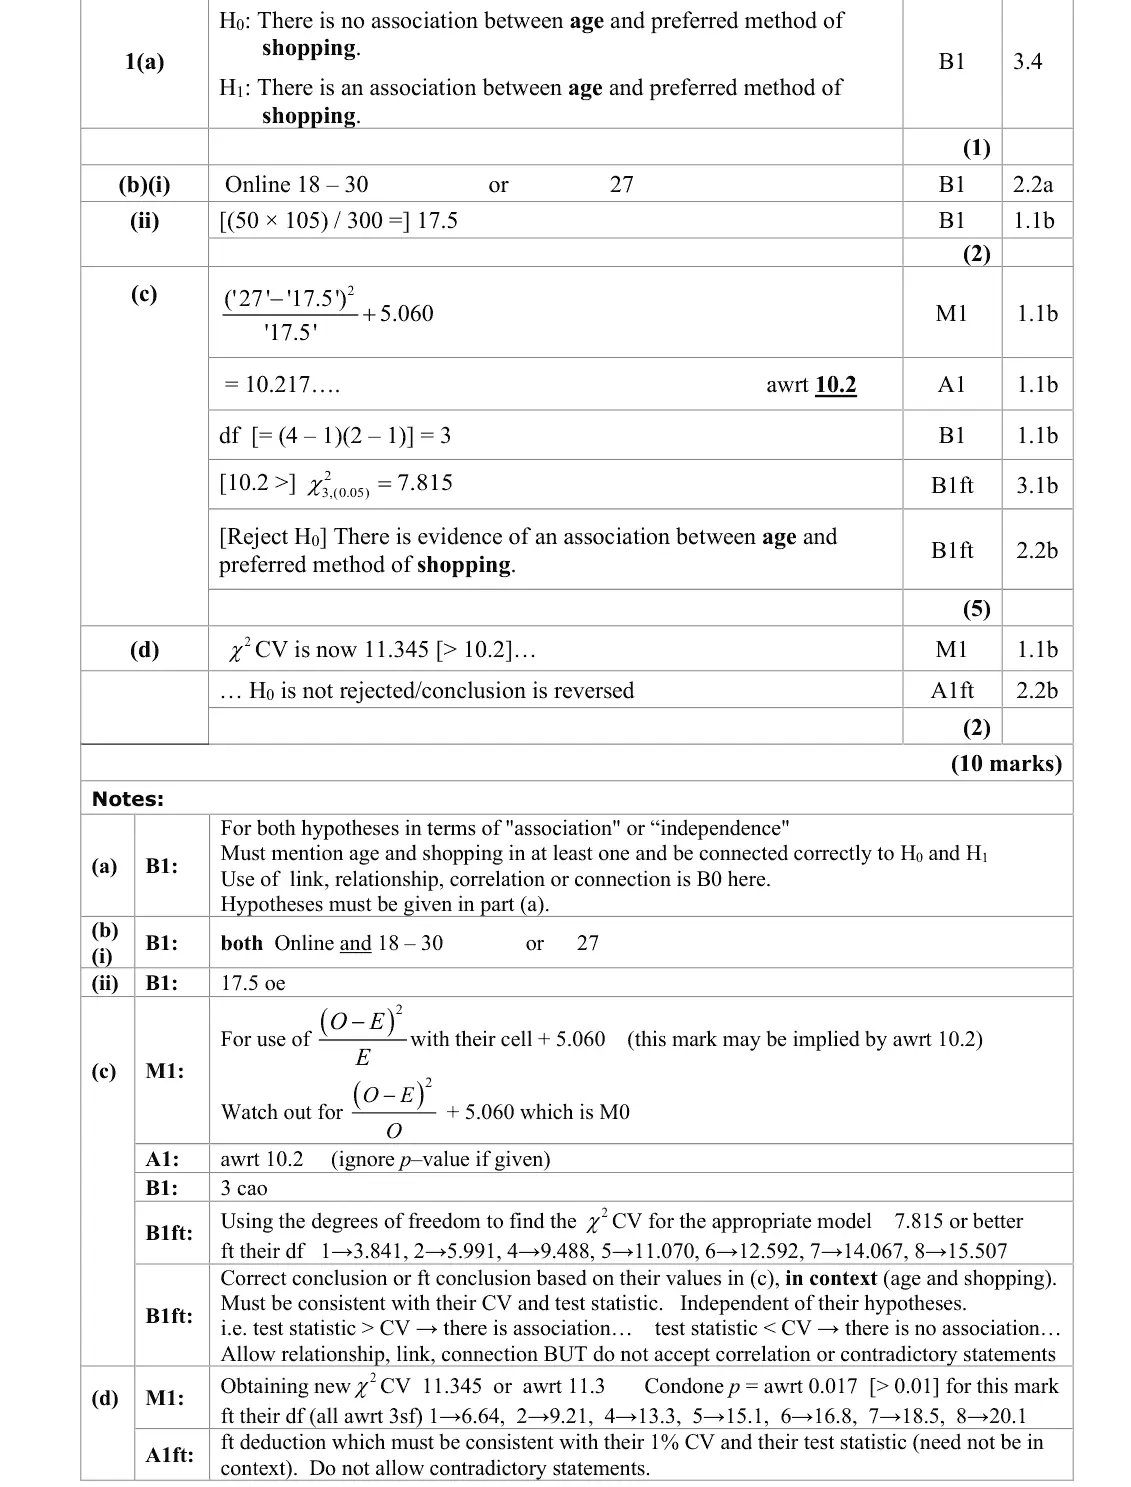
1(a) Chi-squared tests: goodness of fit and contingency tables 1 —
1(b) Chi-squared tests: goodness of fit and contingency tables 2 —
1(c) Chi-squared tests: goodness of fit and contingency tables 5 —
1(d) Chi-squared tests: goodness of fit and contingency tables 2 —
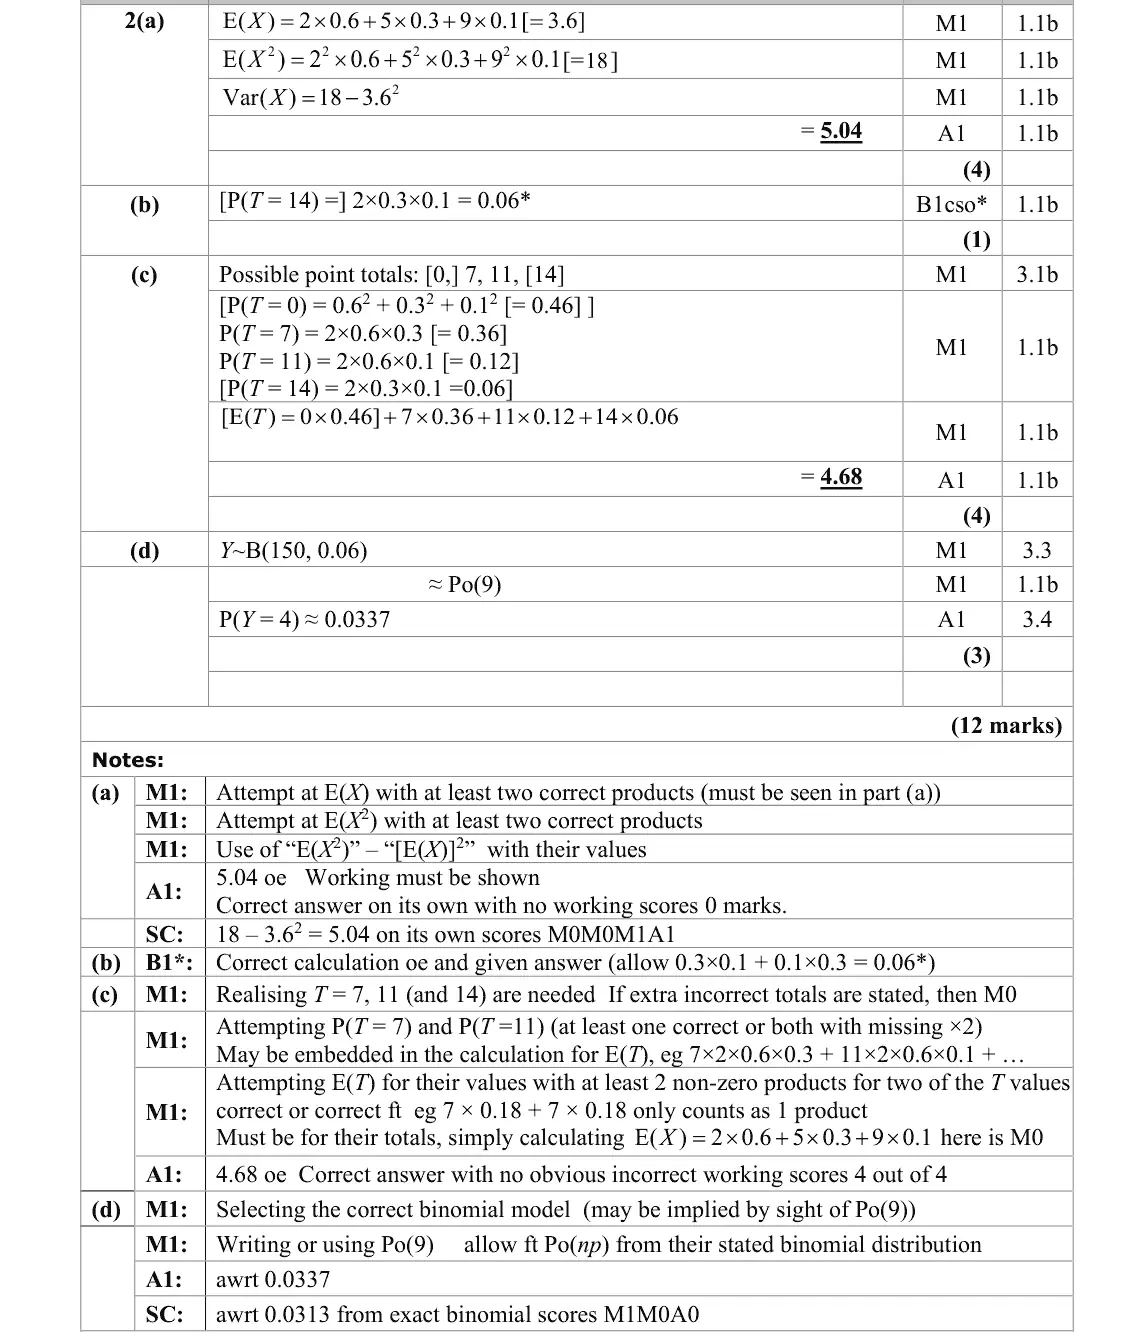
2(a) Discrete random variables: mean and variance 4 —
2(b) Discrete random variables: mean and variance 1 —
2(c) Discrete random variables: mean and variance 4 —
2(d) Poisson and binomial distributions 3 —
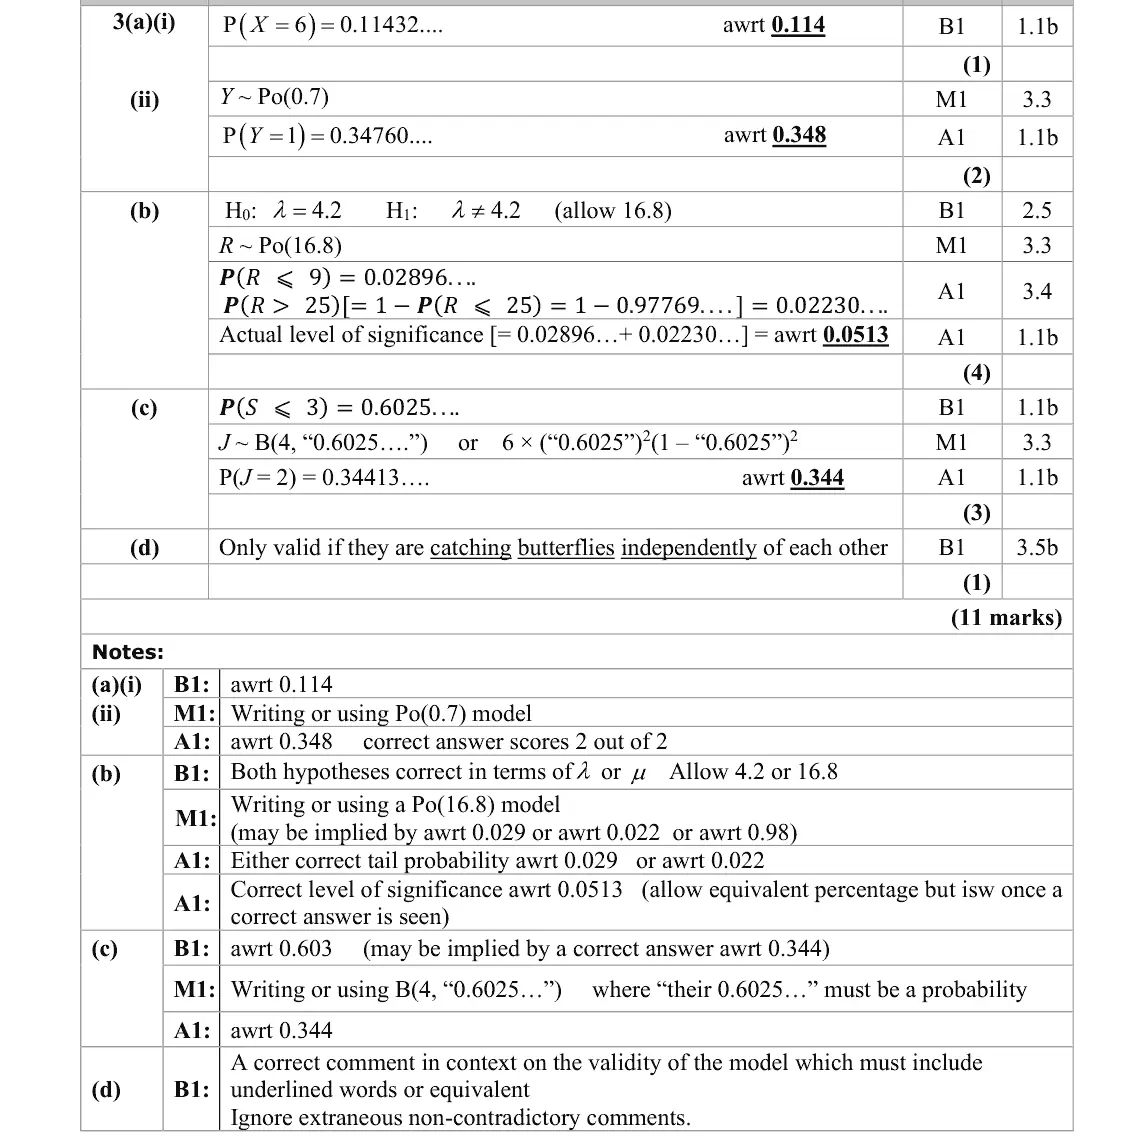
3(a)(i) Poisson and binomial distributions 1 —
3(a)(ii) Poisson and binomial distributions 2 —
3(b) Hypothesis tests: Poisson, binomial and geometric 4 —
3(c) Poisson and binomial distributions 3 —
3(d) Poisson and binomial distributions 1 —
4(a) Chi-squared tests: goodness of fit and contingency tables, Poisson and binomial distributions 2 —
4(b) Chi-squared tests: goodness of fit and contingency tables 3 —
4(c) Chi-squared tests: goodness of fit and contingency tables 2 —

The questions

1(a)1(b)1(c)1(d)2(a)2(b)2(c)2(d)3(a)(i)3(a)(ii)3(b)3(c)3(d)4(a)4(b)4(c)
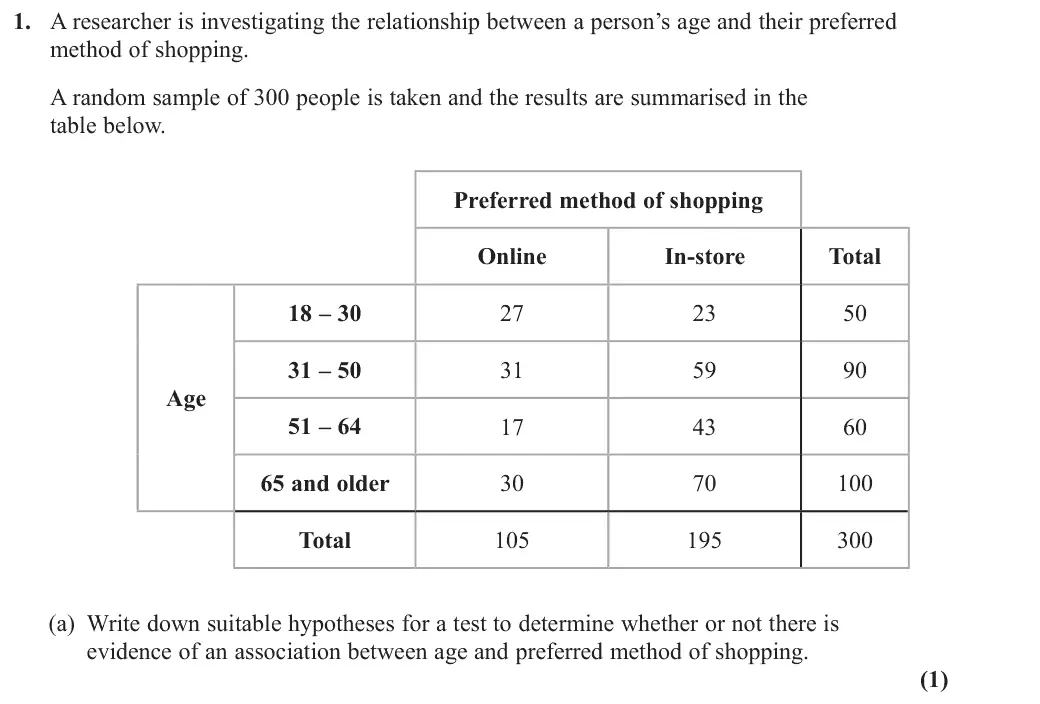
June 2025 · AS Paper 2 (Further Statistics 1) · Q1(a) 1 mark chi squared tests
1. A researcher is investigating the relationship between a person’s age and their preferred method of shopping. A random sample of 300 people is taken and the results are summarised in the table below. Preferred method of shopping Online In-store Total 18 – 30 31 – 50 Age 51 – 64 65 and older Total (a) Write down suitable hypotheses for a test to determine whether or not there is evidence of an association between age and preferred method of shopping. (1)
June 2025 · AS Paper 2 (Further Statistics 1) · Q1(b) 2 marks chi squared tests
The researcher assumes that the null hypothesis is true and uses the data in the table to find expected values. (b) (i) Identify the cell which would have the smallest expected value. (ii) Calculate the expected value for this cell. (2)
June 2025 · AS Paper 2 (Further Statistics 1) · Q1(c) 5 marks chi squared tests
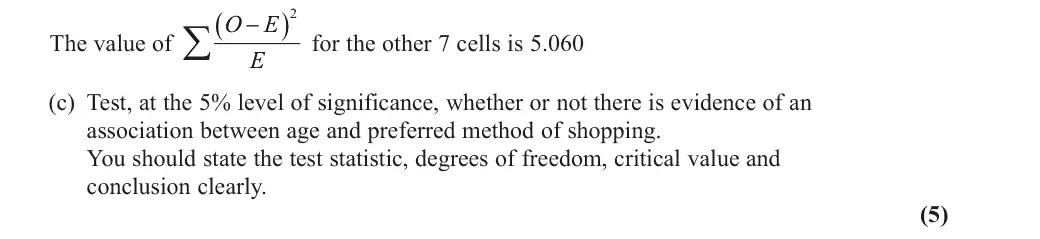
/ E The value of for the other 7 cells is 5.060 E (c) Test, at the 5% level of significance, whether or not there is evidence of an association between age and preferred method of shopping. You should state the test statistic, degrees of freedom, critical value and conclusion clearly. (5)
June 2025 · AS Paper 2 (Further Statistics 1) · Q1(d) 2 marks chi squared tests
(d) Explain whether or not your conclusion to part (c) would be the same if the test was carried out at a 1% level of significance. (2)
June 2025 · AS Paper 2 (Further Statistics 1) · Q2(a) 4 marks discrete random variables
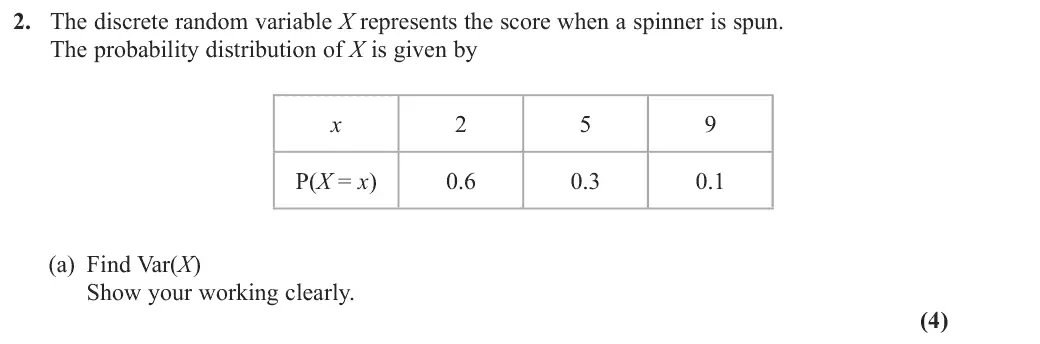
2. The discrete random variable X represents the score when a spinner is spun. The probability distribution of X is given by x P(X = x) 0.6 0.3 0.1 (a) Find Var(X) Show your working clearly. (4)
June 2025 · AS Paper 2 (Further Statistics 1) · Q2(b) 1 mark discrete random variables
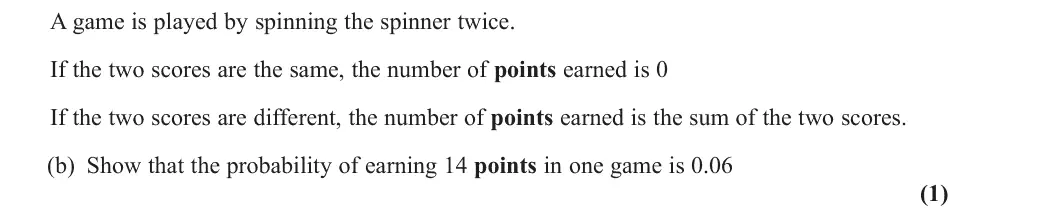
A game is played by spinning the spinner twice. If the two scores are the same, the number of points earned is 0 If the two scores are different, the number of points earned is the sum of the two scores. (b) Show that the probability of earning 14 points in one game is 0.06 (1)
June 2025 · AS Paper 2 (Further Statistics 1) · Q2(c) 4 marks discrete random variables
(c) Find the expected number of points earned when the game is played once. (4)
June 2025 · AS Paper 2 (Further Statistics 1) · Q2(d) 3 marks poisson distribution
Mehmet plays the game 150 times. (d) Using a Poisson approximation, find the probability that Mehmet earns 14 points in exactly 4 of the games. (3)
June 2025 · AS Paper 2 (Further Statistics 1) · Q3(a)(i) 1 mark poisson distribution
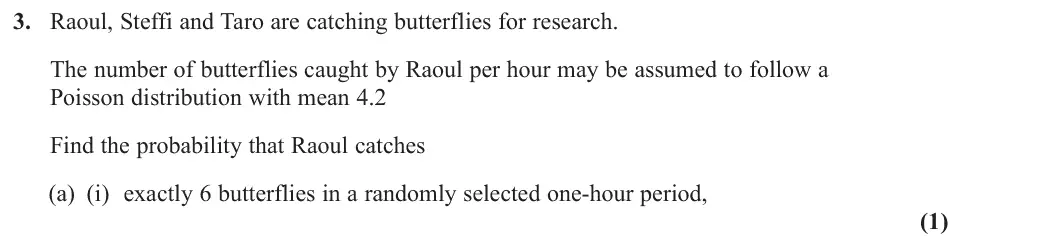
3. Raoul, Steffi and Taro are catching butterflies for research. The number of butterflies caught by Raoul per hour may be assumed to follow a Poisson distribution with mean 4.2 Find the probability that Raoul catches (a) (i) exactly 6 butterflies in a randomly selected one‑hour period, (1)
June 2025 · AS Paper 2 (Further Statistics 1) · Q3(a)(ii) 2 marks poisson distribution
(ii) exactly 1 butterfly in a randomly selected 10‑minute period. (2)
June 2025 · AS Paper 2 (Further Statistics 1) · Q3(b) 4 marks hypothesis tests fs1
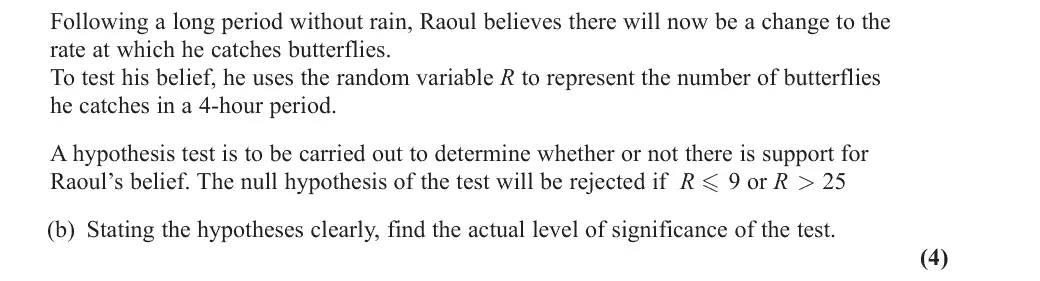
Following a long period without rain, Raoul believes there will now be a change to the rate at which he catches butterflies. To test his belief, he uses the random variable R to represent the number of butterflies he catches in a 4‑hour period. A hypothesis test is to be carried out to determine whether or not there is support for Raoul’s belief. The null hypothesis of the test will be rejected if R 9 or R > 25 (b) Stating the hypotheses clearly, find the actual level of significance of the test. (4)
June 2025 · AS Paper 2 (Further Statistics 1) · Q3(c) 3 marks poisson distribution
The number of butterflies caught by Steffi per hour may be assumed to follow a Poisson distribution with mean 3.2 (c) Find the probability that in exactly 2 of the next 4 hours, Steffi catches less than or equal to 3 butterflies each hour. (3)
June 2025 · AS Paper 2 (Further Statistics 1) · Q3(d) 1 mark poisson distribution
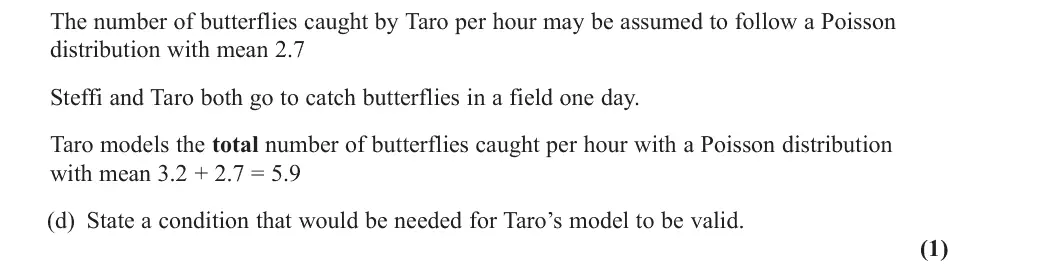
The number of butterflies caught by Taro per hour may be assumed to follow a Poisson distribution with mean 2.7 Steffi and Taro both go to catch butterflies in a field one day. Taro models the total number of butterflies caught per hour with a Poisson distribution with mean 3.2 + 2.7 = 5.9 (d) State a condition that would be needed for Taro’s model to be valid. (1)
June 2025 · AS Paper 2 (Further Statistics 1) · Q4(a) 2 marks chi squared testspoisson distribution
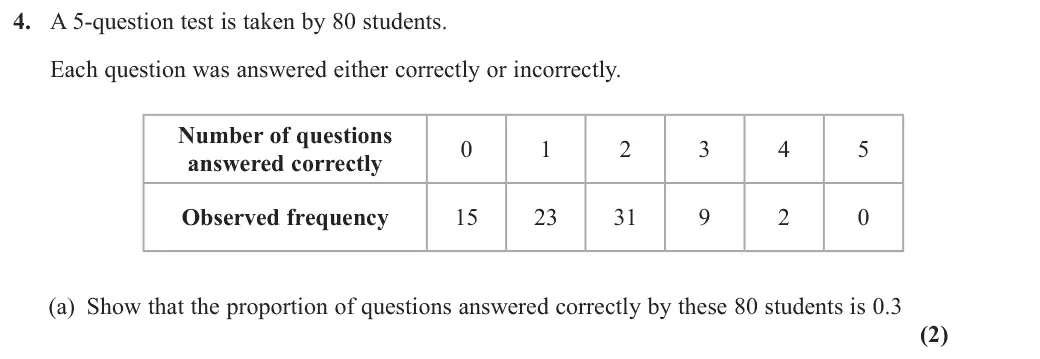
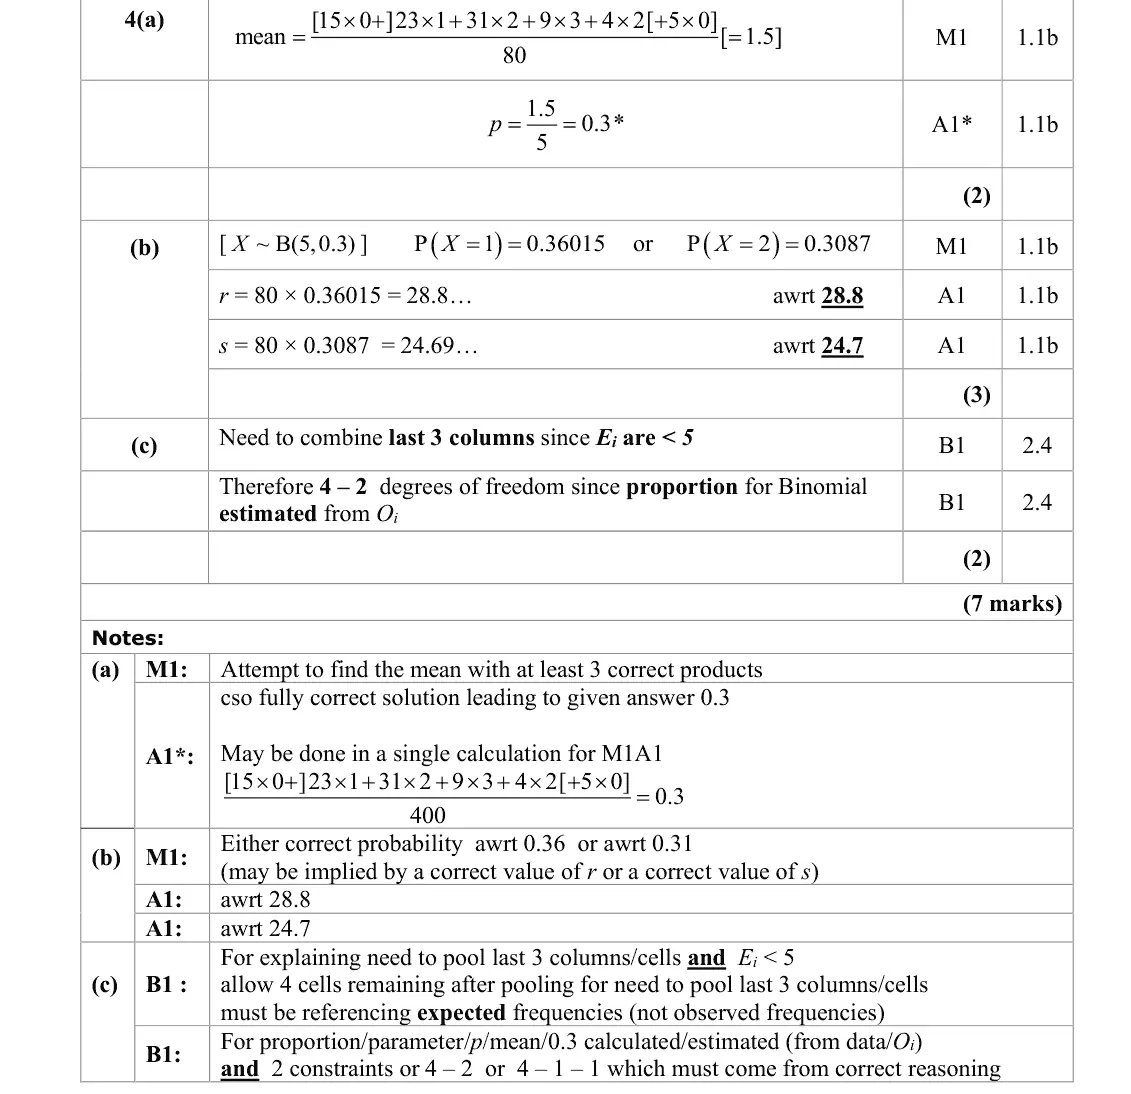
4. A 5‑question test is taken by 80 students. Each question was answered either correctly or incorrectly. Number of questions answered correctly Observed frequency (a) Show that the proportion of questions answered correctly by these 80 students is 0.3 (2)
June 2025 · AS Paper 2 (Further Statistics 1) · Q4(b) 3 marks chi squared tests
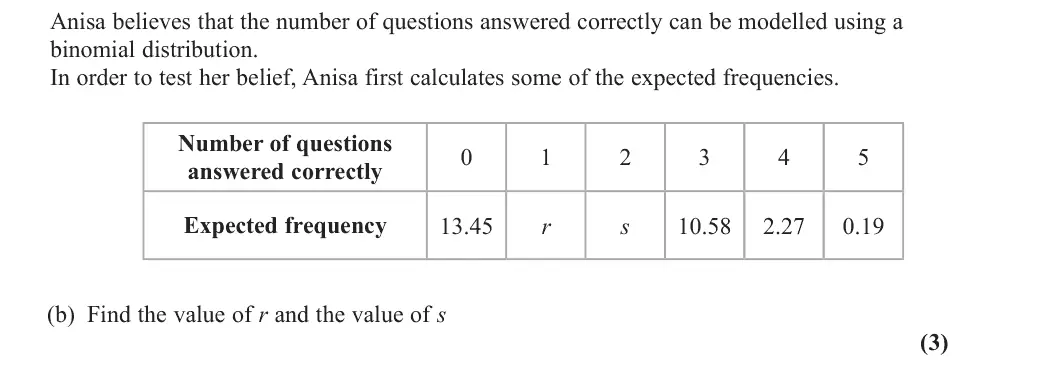
Anisa believes that the number of questions answered correctly can be modelled using a binomial distribution. In order to test her belief, Anisa first calculates some of the expected frequencies. Number of questions answered correctly Expected frequency 13.45 r s 10.58 2.27 0.19 (b) Find the value of r and the value of s (3)
June 2025 · AS Paper 2 (Further Statistics 1) · Q4(c) 2 marks chi squared tests
(c) Explain fully why there are 2 degrees of freedom for the test of Anisa’s belief. (2)

Find an Edexcel Further Maths tutor

Want this paper marked and gone through with a Further Maths tutor? Message us.

Prefer email? Send an enquiry

If you are under 18, please include a parent's contact details. Enquiries go to enquiries@alevelfurthermathstutor.com and are deleted once handled.