FS2.5.1 Concepts of standard error, estimator, bias. Quality of estimators
Section
FS2.5 Estimation, confidence intervals and tests using a normal distribution
Level
A level only
Statement
Concepts of standard error, estimator, bias. Quality of estimators
Guidance
The sample mean, x̄, and the sample variance, s² = (1/(n − 1)) Σ(xᵢ − x̄)², as unbiased estimates of the corresponding population parameters. Candidates will be expected to compare estimators and look for features such as unbiasedness and small variance.
June 2025 · Paper 4B (Further Statistics 2) · Q4(b)6 marks
Mark scheme (whole question; this part is marked with the orange bar)
Examiner's comment
This question was more demanding and required candidates to carry out a hypothesis test on the variance, as well as constructing a confidence interval. Candidates found this question more demanding, but they were still able to score a high number of the available marks. In part (b), candidates were usually successful in setting the correct null and alternative hypotheses. It was unfortunate that sigma and 6 looked very similar in some responses, although this was condoned (rather than it being regarded as test for the difference between two variances). Candidates usually found a correct unbiased estimate for the variance, although some used an incorrect formula, or divided by n instead of 1 n -. The critical value found was sometimes found for the wrong tail (instead of the lower required tail). Some candidates also not realising that the test statistic was lower than the critical value in this case meant that there was sufficient evidence that the variance of the weights was lower. Giving a correct conclusion in context also resulted in a mark lost with the word ‘weight’ omitted in some cases.
Key points from the mark scheme and examiner's report
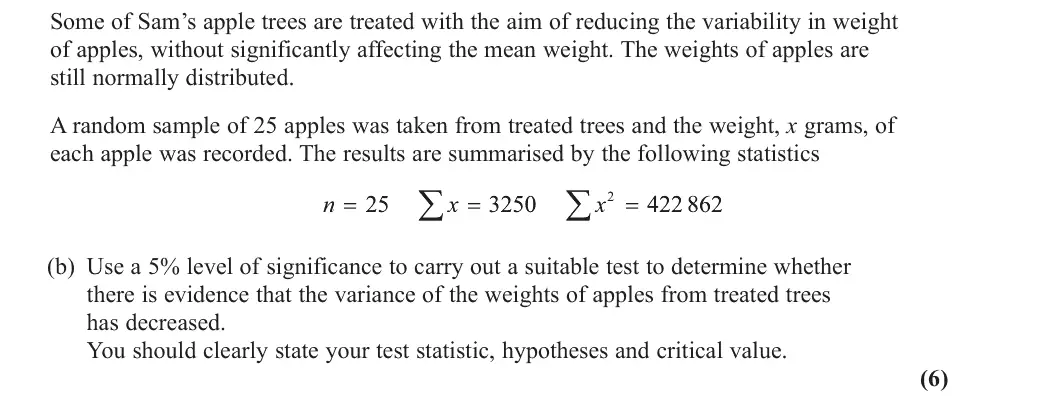
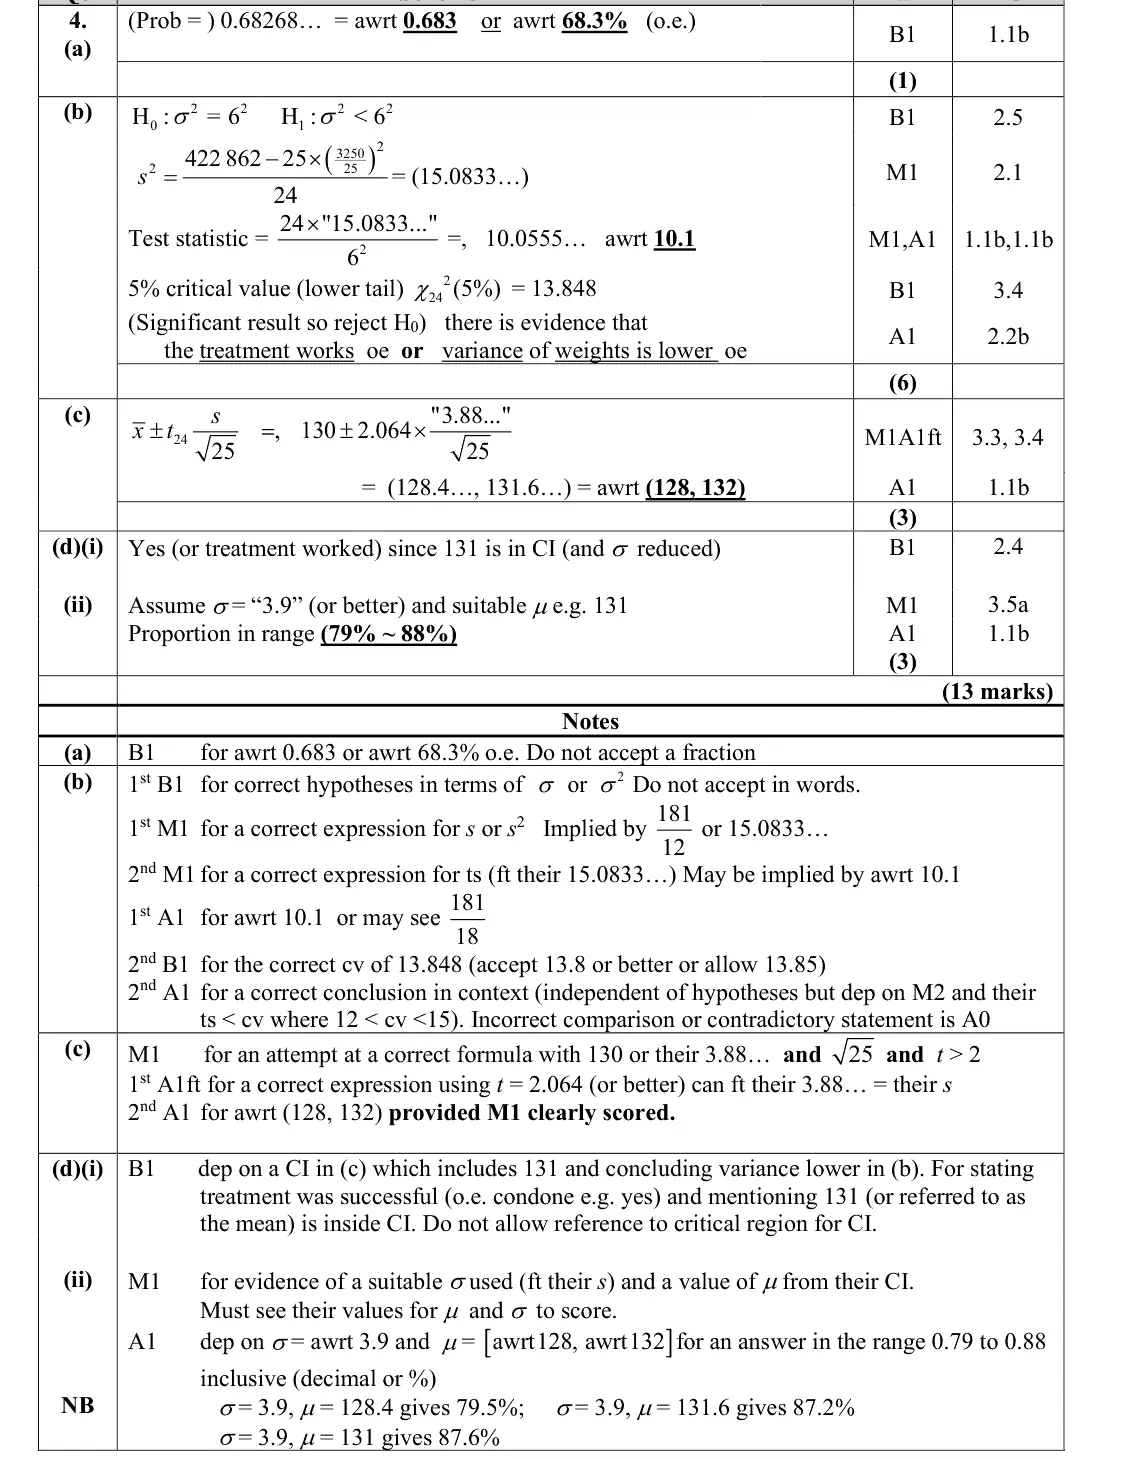
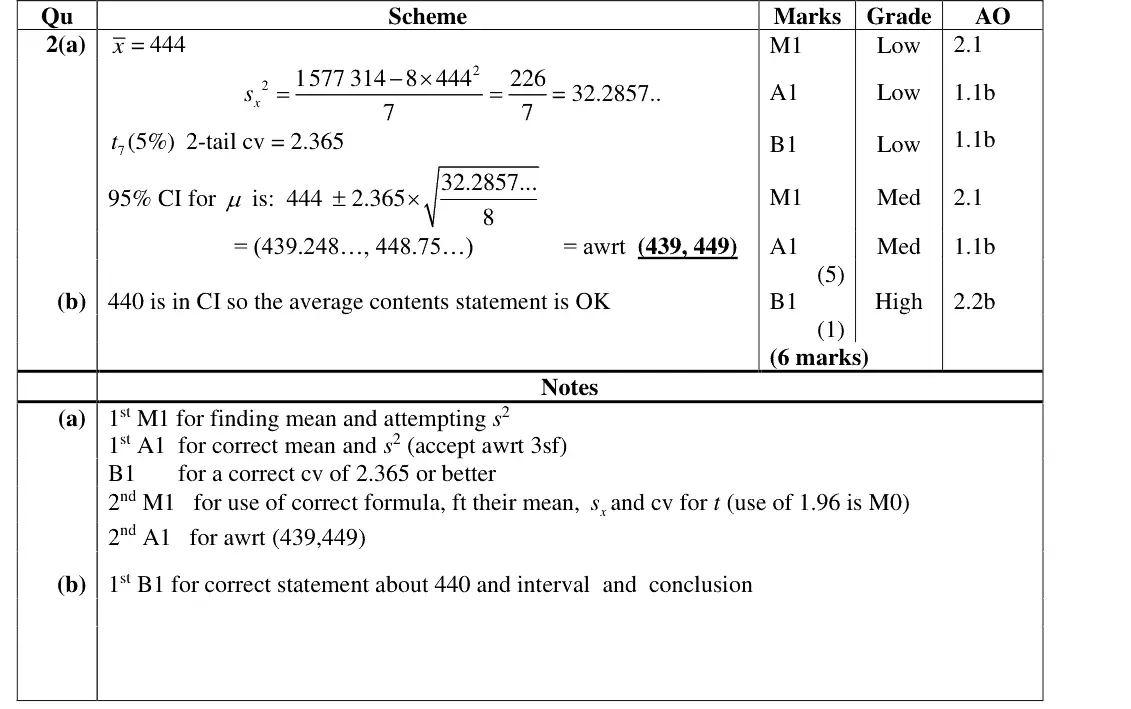
H₀: σ² = 36, H₁: σ² < 36
s² = (422862 − 25 × 130²)/24 = 15.08 (divide by n − 1)
24s²/36 = 10.06 < lower 5% χ²₂₄ value 13.848, so evidence the variance of weights has decreased
wrong tail was common
June 2025 · Paper 4B (Further Statistics 2) · Q6(a)3 marks
Mark scheme (whole question; this part is marked with the orange bar)
Examiner's comment
This 17-mark question on delivery rates was very demanding for candidates as it involved two different hypothesis tests. It was very rare for full marks to be scored, although it was pleasing to see most candidates scoring the majority of them. Candidates usually successfully answered part (a), although the method to find the unbiased estimate for the variance was incorrect.
Key points from the mark scheme and examiner's report
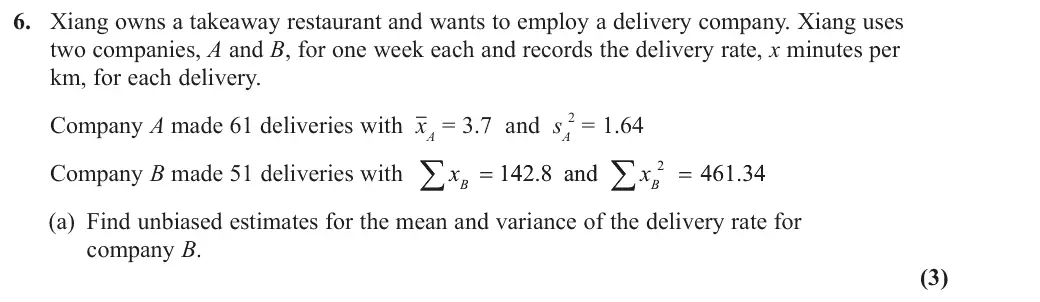
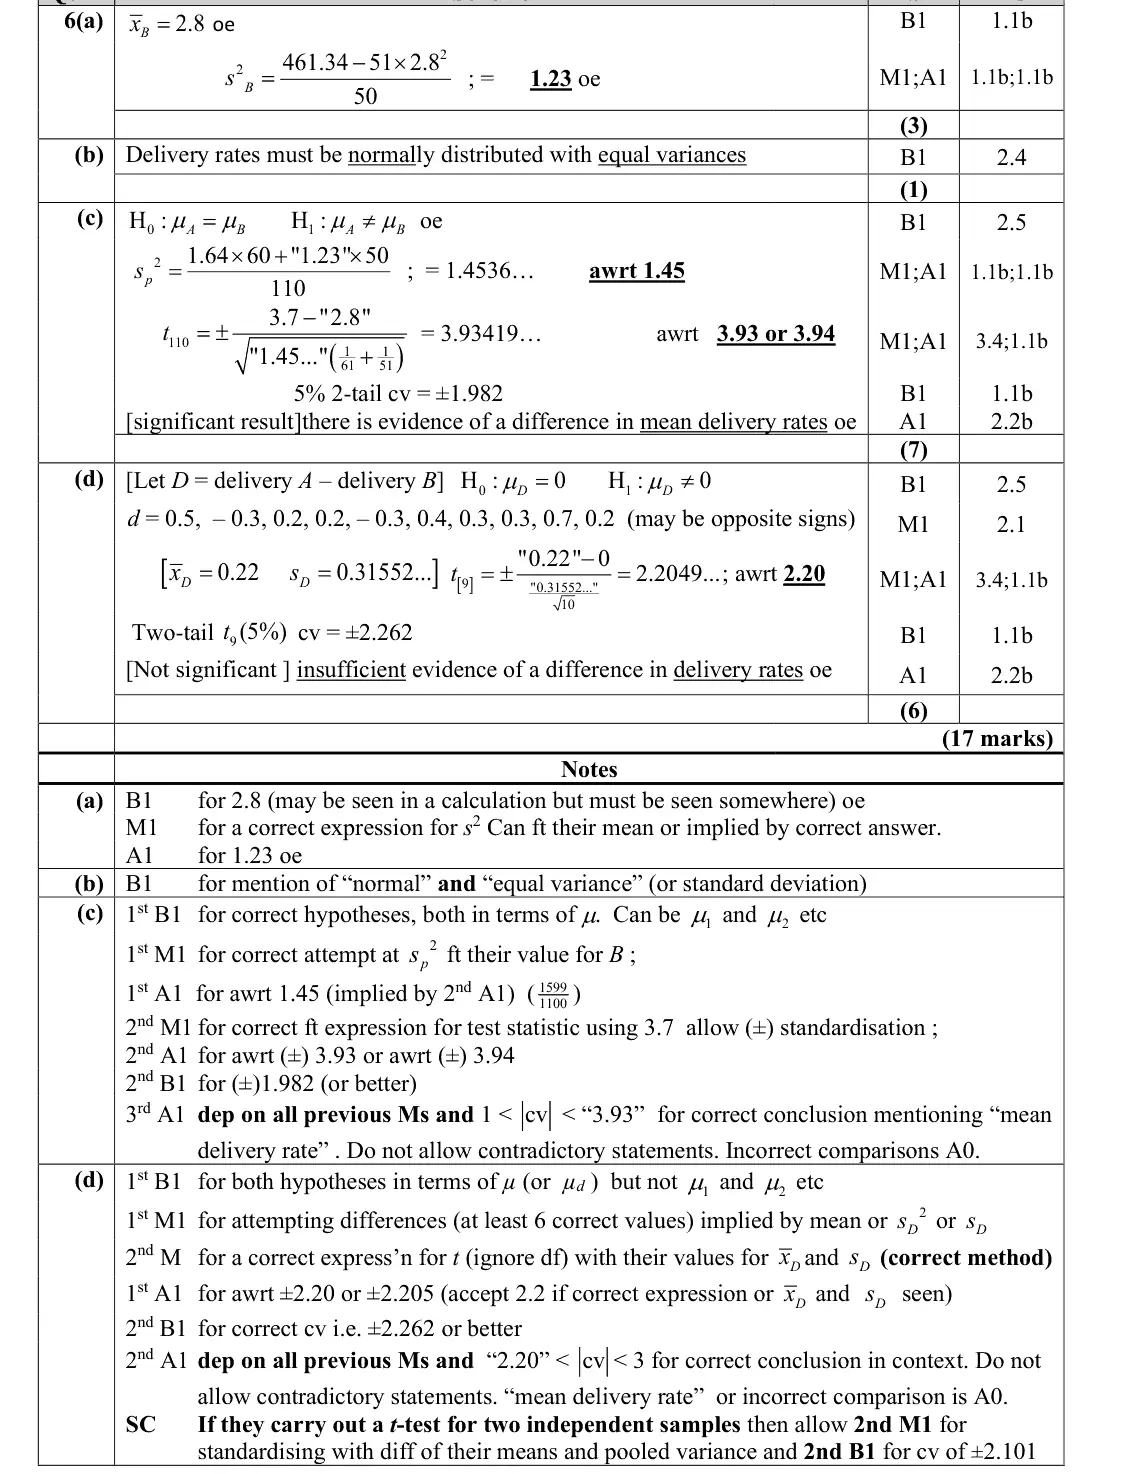
x̄B = 142.8/51 = 2.8
sB² = (461.34 − 51 × 2.8²)/50 = 1.23
June 2025 · Paper 4B (Further Statistics 2) · Q7(a)7 marks
Mark scheme (whole question; this part is marked with the orange bar)
Examiner's comment
This was the most demanding question on the paper and it was extremely rare to see any meaningful progress made in part (a). It was unusual to see more than half of the available marks scored for the question overall. In part (a) candidates were typically able to find the expected value for X , however in Y - most cases this was the only mark scored. Sometimes candidates did start to write an expression involving the individual values taken from the sample but made no attempt to simplify the expression or appreciate that some of the observations were the same (and so remove/combine some of the repeats). This meant that no further marks were scored. Despite the difficulties encountered in part (a), a pleasing number of candidates made good progress in the final part of this question. Usually, they were able to form a valid equation
Key points from the mark scheme and examiner's report
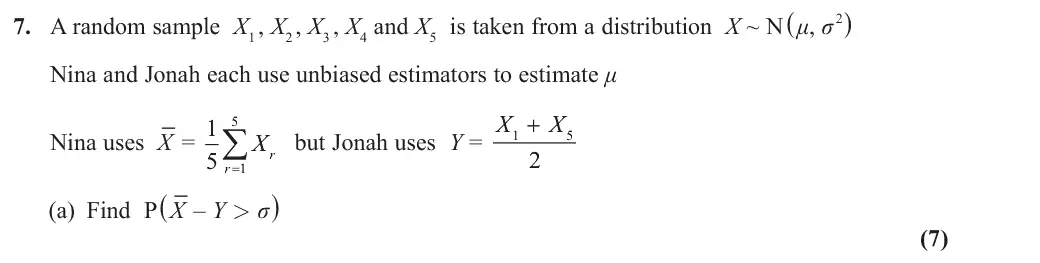
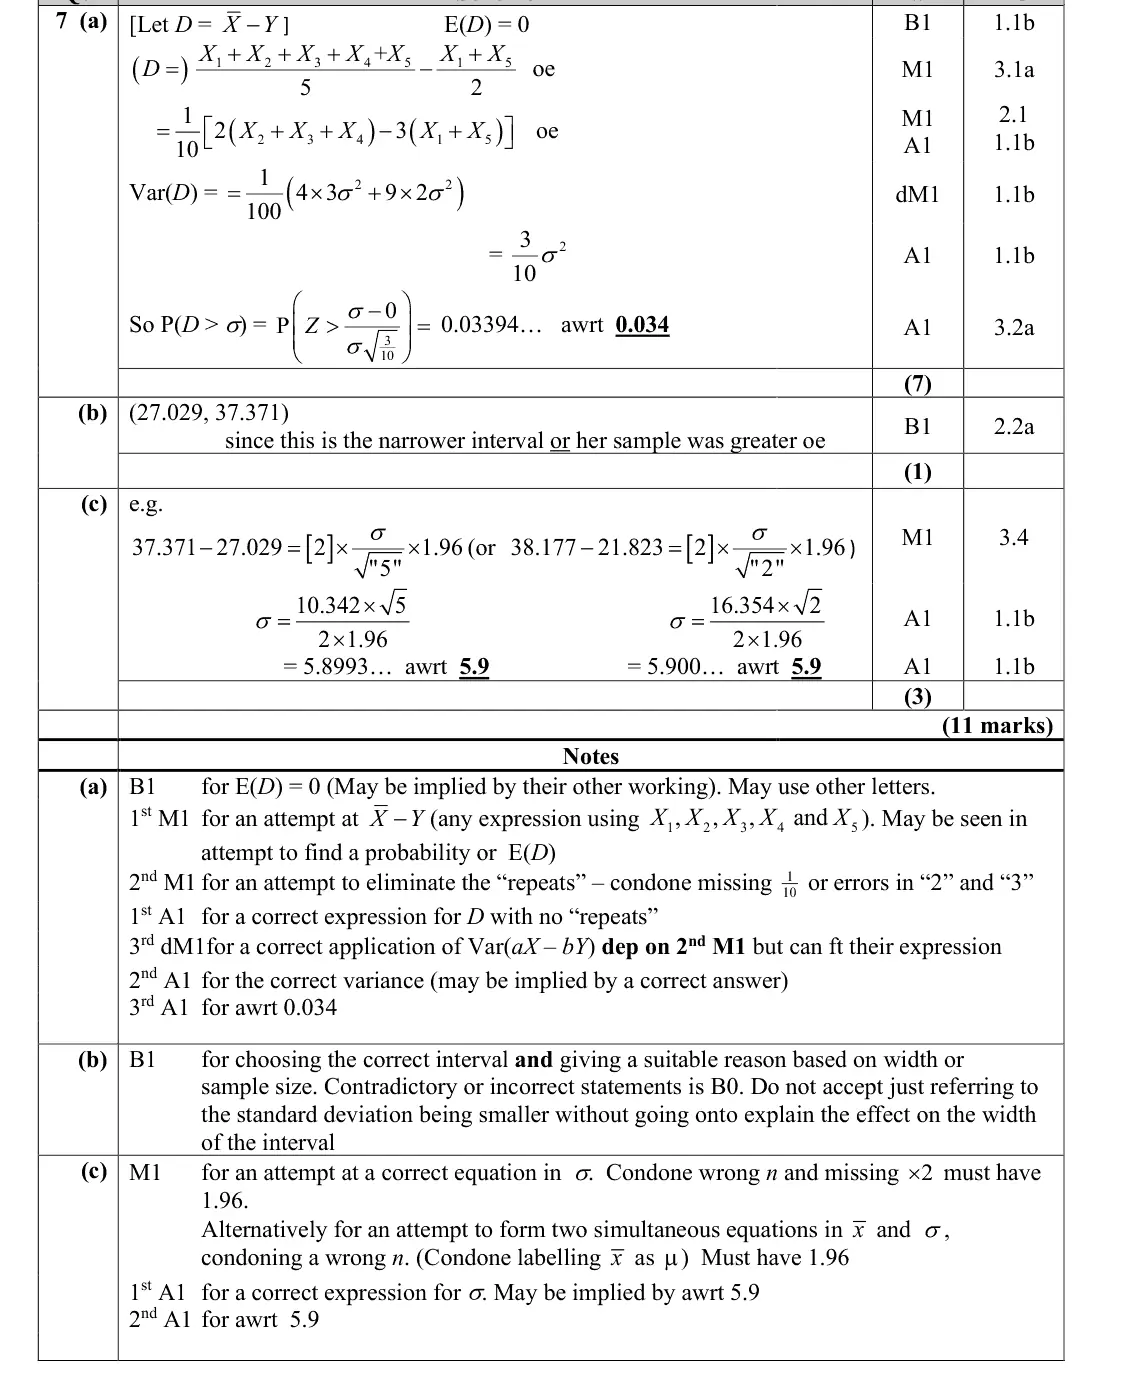
D = X̄ − Y = (1/10)[2(X₂ + X₃ + X₄) − 3(X₁ + X₅)] (collect the repeated X₁, X₅ first)
E(D) = 0, Var(D) = (12 + 18)σ²/100 = 0.3σ²
P(D > σ) = P(Z > 1/√0.3) = 0.034
very few progressed beyond E(D)
June 2025 · Paper 4B (Further Statistics 2) · Q7(b)1 mark
Mark scheme (whole question; this part is marked with the orange bar)
Examiner's comment
This was the most demanding question on the paper and it was extremely rare to see any In part (b), candidates usually selected the correct interval with a valid reason, although it was surprising to see a considerable number who explained that Nina’s estimator had a greater variance which was not correct. Despite the difficulties encountered in part (a), a pleasing number of candidates made good
Key points from the mark scheme and examiner's report
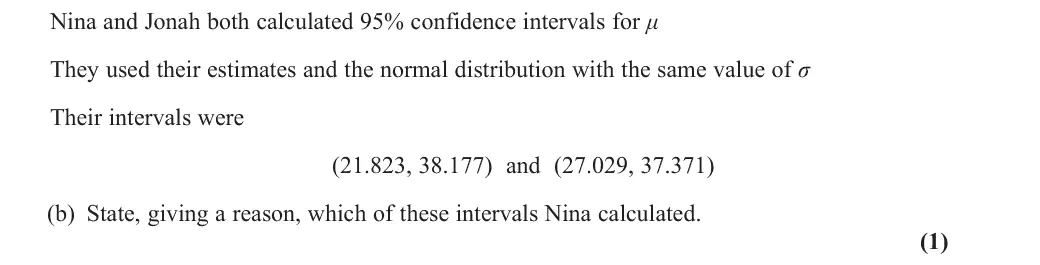
Nina's is (27.029, 37.371), the narrower interval, since X̄ uses 5 observations (smaller variance)
saying her estimator has greater variance is wrong
June 2024 · Paper 4B (Further Statistics 2) · Q7(a)2 marks
Mark scheme (whole question; this part is marked with the orange bar)
Examiner's comment
Those who were successful in part (a) were often able to proceed via a similar route in part (b) and achieve a further two marks. Sometimes the result in (b) was more obvious given that a candidates to go back and repeat part (a).
Key points from the mark scheme and examiner's report
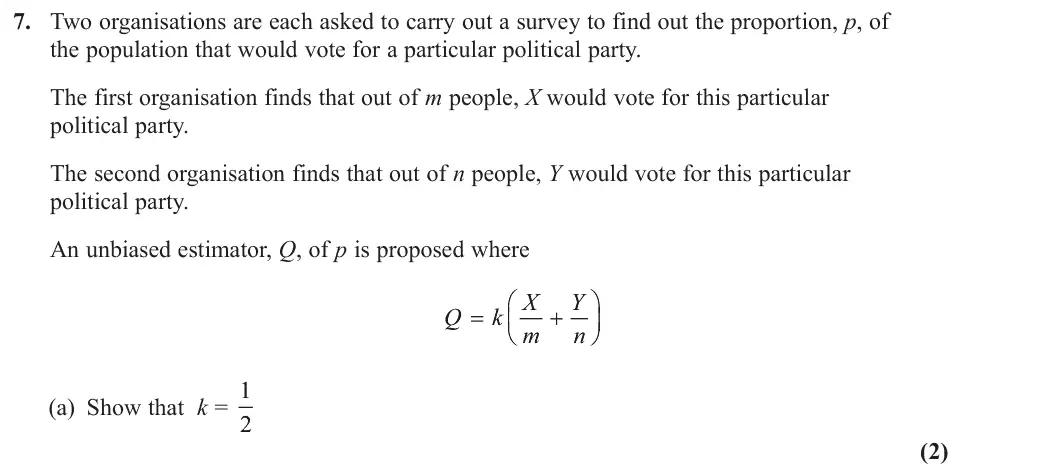
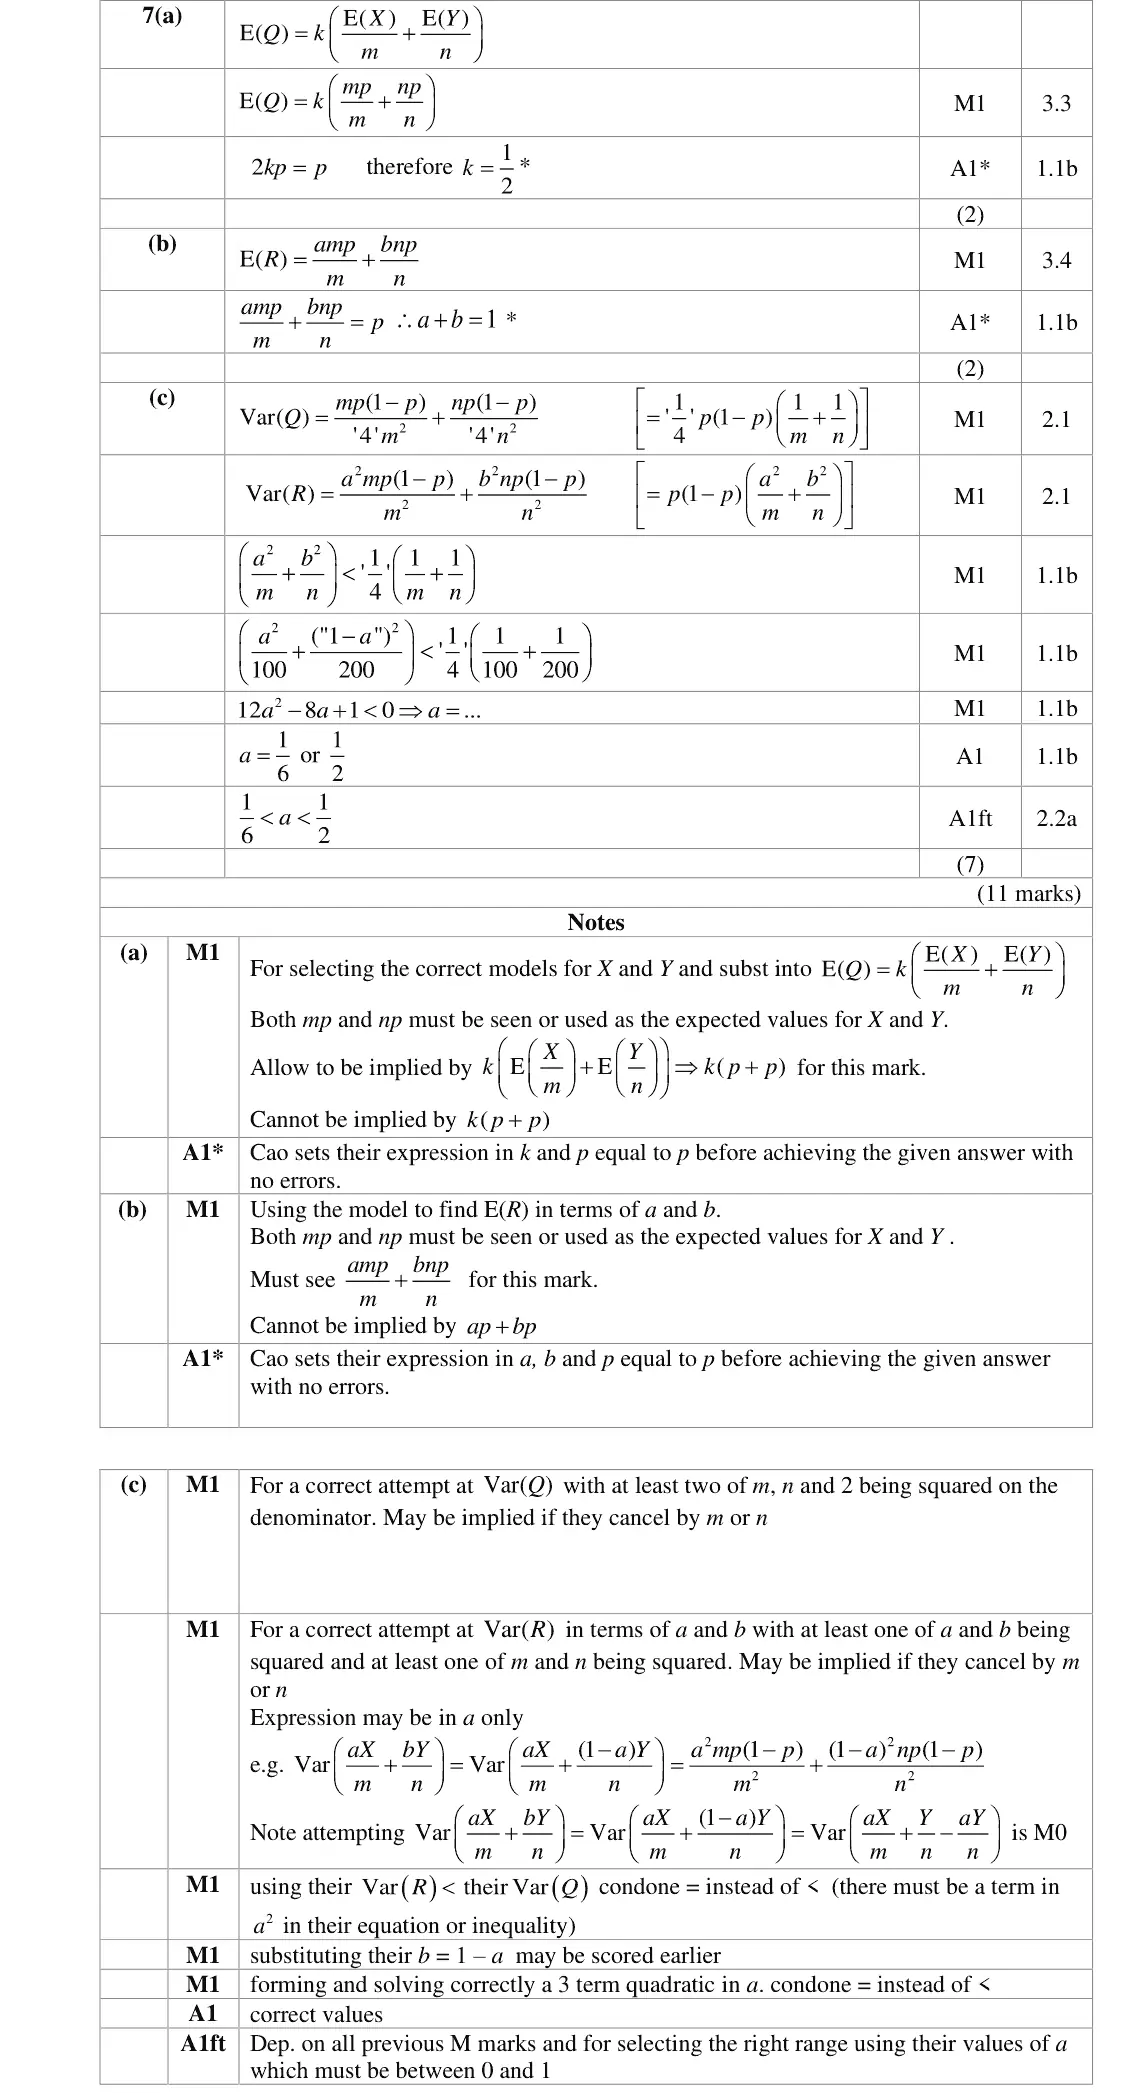
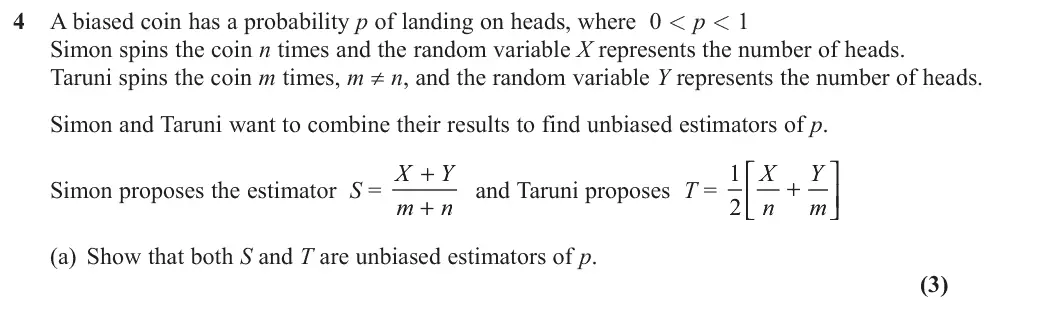
X ~ B(m, p), Y ~ B(n, p): E(Q) = k(mp/m + np/n) = 2kp = p so k = ½
June 2024 · Paper 4B (Further Statistics 2) · Q7(b)2 marks
Mark scheme (whole question; this part is marked with the orange bar)
Examiner's comment
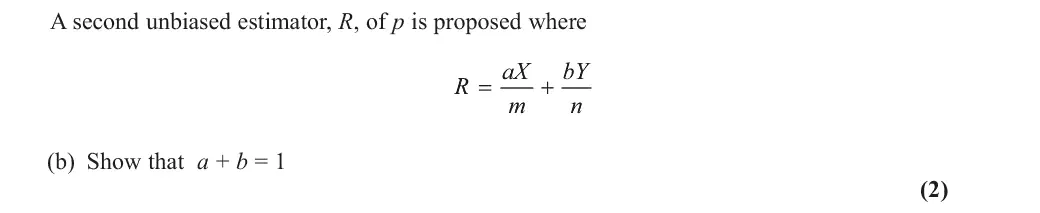
Those who were successful in part (a) were often able to proceed via a similar route in part (b) and achieve a further two marks. Sometimes the result in (b) was more obvious given that a and b were in the separate fractions and the expression needed to be set equal to p meant that the other parts of the fraction needed to equal p for them to cancel; this possibly helped candidates to go back and repeat part (a). - in part (b) made things more difficult for themselves by expanding (1 unnecessarily and p ) p substituting values of m and n before they needed to, or only partially, leading to more unwieldy expressions. Relatively few candidates were unable to make any progress at all with this question, however. A number did not start working with variances in part (c) when cued to by
Key points from the mark scheme and examiner's report
E(R) = amp/m + bnp/n = (a + b)p = p so a + b = 1
June 2024 · Paper 4B (Further Statistics 2) · Q7(c)7 marks
Mark scheme (whole question; this part is marked with the orange bar)
Examiner's comment
In part (c), a number of candidates failed to realise that Var(X) and Var(Y) were different, and meant that they were unable to 2 to express them in terms of n and p. Treating them both as gain credit for their attempts at Var(Q) and Var(R). Many candidates taking the right approach question, however. A number did not start working with variances in part (c) when cued to by 'R is a better estimator than Q', so were working in vain in other directions which did not yield any marks. Errors in (c) were not common but included those in manipulation of the fractions, erroneous attempts at simplifying the inequality, and several candidates dealt with the k incorrectly leading to a factor of 4 rather than 1 4 . A few candidates fell at the last hurdle, either writing 1 1 , or by failing to give the strict inequality that was required for R to be 'better'. a 2 6
Key points from the mark scheme and examiner's report
with b = 1 − a: 12a² − 8a + 1 < 0, 1/6 < a < 1/2 (strict)
Var(X) and Var(Y) differ
k² = ¼ not 4
June 2023 · Paper 4B (Further Statistics 2) · Q3(a)4 marks
Mark scheme (whole question; this part is marked with the orange bar)
Examiner's comment
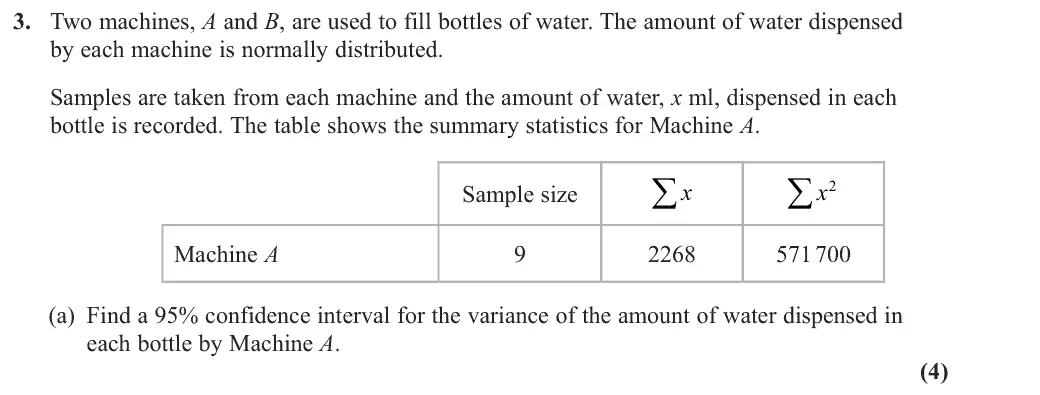
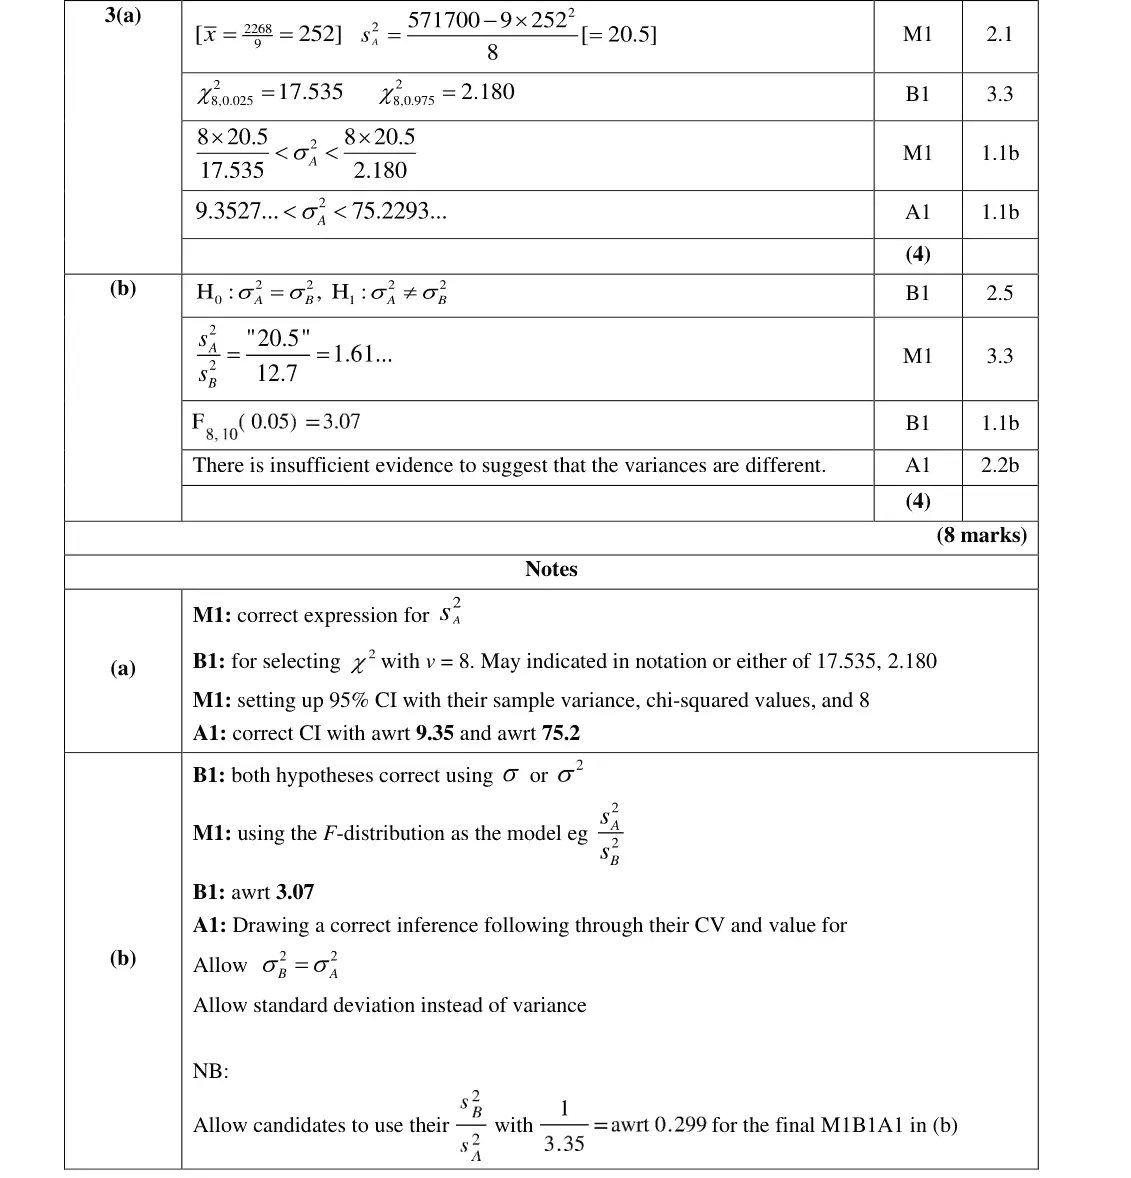
chi-squared distribution and gained at most 1 mark out of 4 in part (a). The vast majority did use the correct distribution and went on to gain all the marks in (a). Almost all candidates were able to gain the mark for a correct sample variance regardless of which distribution they used. Almost all candidates stated correct hypotheses in (b). Most were familiar with the process of
Key points from the mark scheme and examiner's report
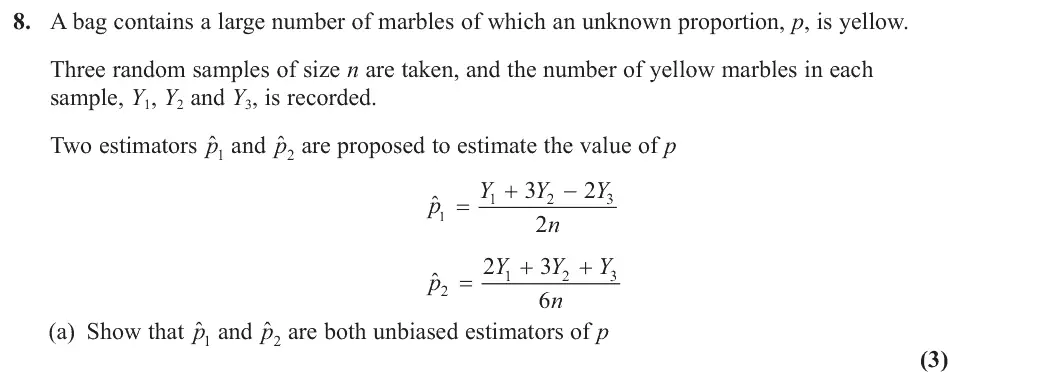
June 2023 · Paper 4B (Further Statistics 2) · Q8(a)3 marks
Mark scheme (whole question; this part is marked with the orange bar)
Examiner's comment
This question was understandably quite challenging and did a good job of testing the candidates’ knowledge and skill with estimators. There were a distinct minority of candidates who failed to realise a binomial distribution was required, and hence scored very few marks on this question. Part (a) was usually done well, with most candidates using the binomial to good effect to find the bias for both estimators. However, a fair few of these candidates did not state a clear conclusion and lost the final mark in (a).
Key points from the mark scheme and examiner's report
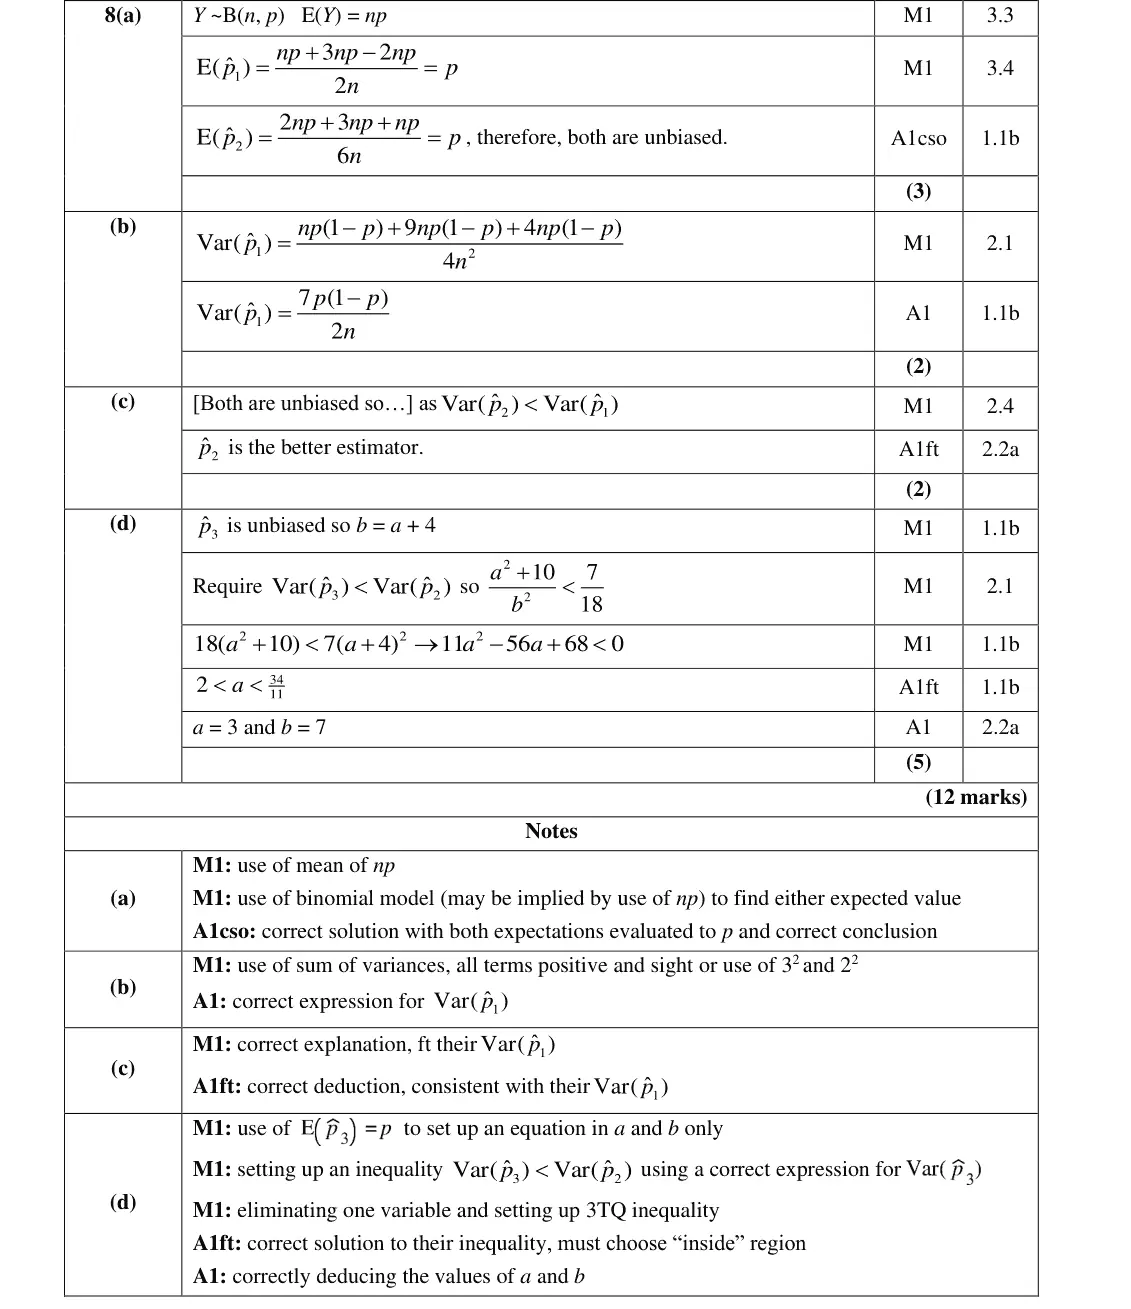
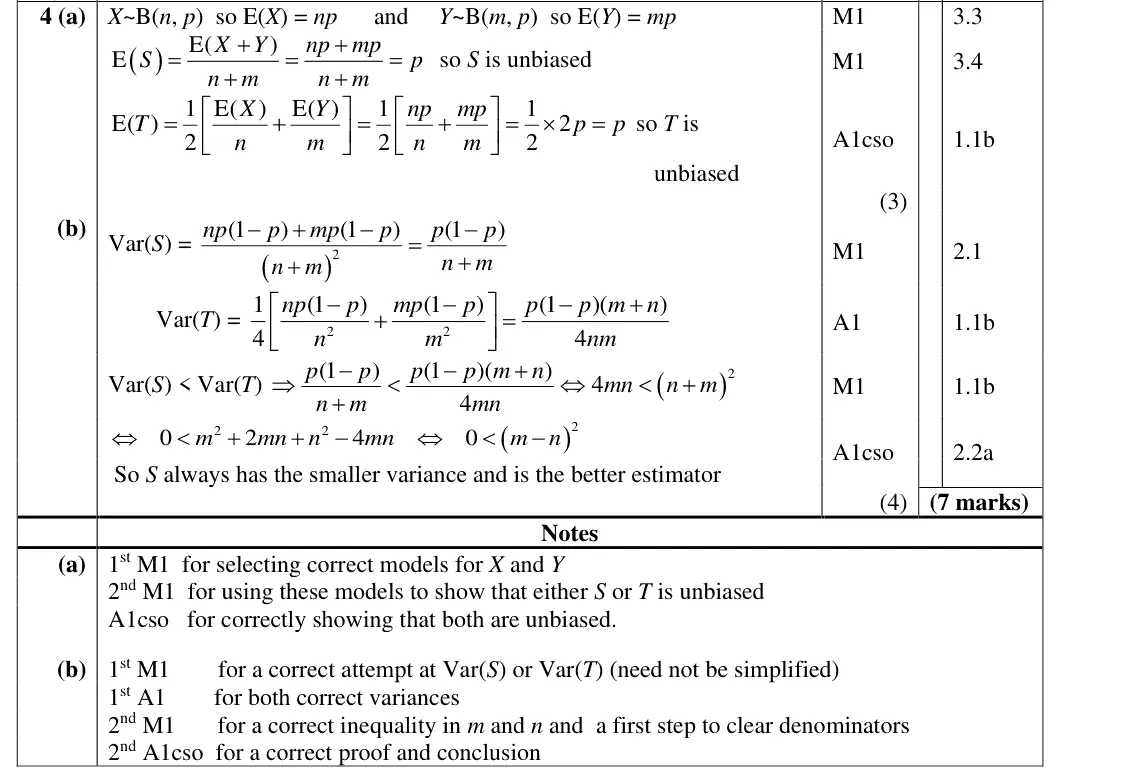
Y ~ B(n, p) so E(Y) = np
E(p̂₁) = (np + 3np − 2np)/(2n) = p and E(p̂₂) = (2np + 3np + np)/(6n) = p
conclusion needed
a minority did not use the binomial
June 2023 · Paper 4B (Further Statistics 2) · Q8(b)2 marks
Mark scheme (whole question; this part is marked with the orange bar)
Examiner's comment
This question was understandably quite challenging and did a good job of testing the candidates’ knowledge and skill with estimators. There were a distinct minority of candidates who failed to realise a binomial distribution was required, and hence scored very few marks on this question. Part (b) required the candidates to be able to find the variance of a combination of random variables. Most were able to do this, though a good number were not able to do so accurately and scored only one of the two marks for (b).
Key points from the mark scheme and examiner's report
June 2023 · Paper 4B (Further Statistics 2) · Q8(c)2 marks
Mark scheme (whole question; this part is marked with the orange bar)
Examiner's comment
This question was understandably quite challenging and did a good job of testing the candidates’ knowledge and skill with estimators. There were a distinct minority of candidates who failed to realise a binomial distribution was required, and hence scored very few marks on this question. Part (c) was well done on the whole. Most candidates knew to assess the relative validity of unbiased estimators by comparing the variance and seeking a low variance. As candidates were able to follow through their variance from (b) most scored both marks.
Key points from the mark scheme and examiner's report
both unbiased and Var(p̂₂) < Var(p̂₁), so p̂₂ is better
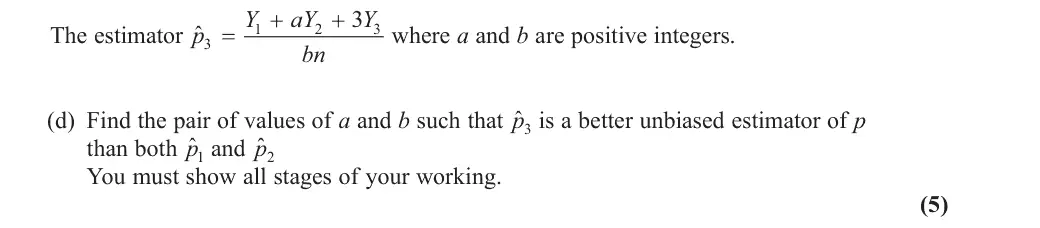
June 2023 · Paper 4B (Further Statistics 2) · Q8(d)5 marks
Mark scheme (whole question; this part is marked with the orange bar)
Examiner's comment
This question was understandably quite challenging and did a good job of testing the candidates’ knowledge and skill with estimators. There were a distinct minority of candidates who failed to realise a binomial distribution was required, and hence scored very few marks on this question. Part (d) was definitely the most challenging part of the paper. It required candidates to utilise two criteria for an estimator being valid. While a good number of candidates were able to complete this question well, a lot only used one criterion and hence were not able to form simultaneous equations. If candidates were able to form two equations in a and b there was still much to do. A decent amount of rigour was required to use a correct expression for the variance of the new estimator, combine it with a correct linear equation, form a 3TQ, solve this quadratic to state a range, and interpret the range correctly. This was an appropriate level of challenge to finish the paper, and this part of the question helped to discriminate between the differing ability levels of candidates.
Key points from the mark scheme and examiner's report
11a² − 56a + 68 < 0 gives 2 < a < 34/11, so a = 3, b = 7
many used only one of the two criteria
hardest part of the paper
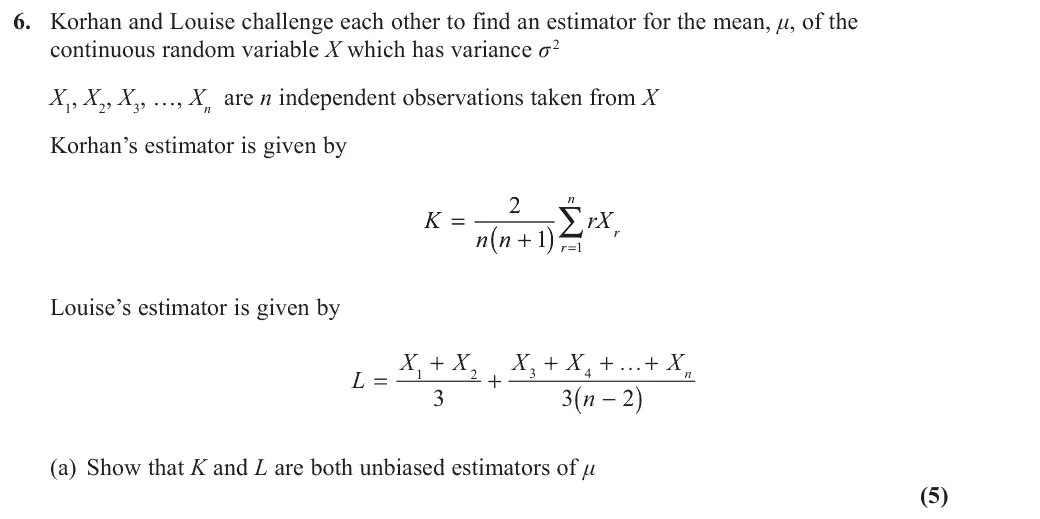
June 2022 · Paper 4B (Further Statistics 2) · Q6(a)5 marks
Mark scheme (whole question; this part is marked with the orange bar)
Examiner's comment
This was one of the most demanding questions on the paper and fully correct responses were only given by the most able candidates. Part (a) was a ‘show that’ meaning that candidates were supposed to show all stages of their working and give the conclusion that both of the estimators are unbiased. Many skipped steps in working out the expectation of K and did not make it clear they were using the sum of an arithmetic series. Poor notation was common as many did not use expectation notation until the end of their solution. 2 2 of the sum from part (a) was used. Some correctly factorised out but made no further n n + 2 2 ( 1) progress.
Key points from the mark scheme and examiner's report
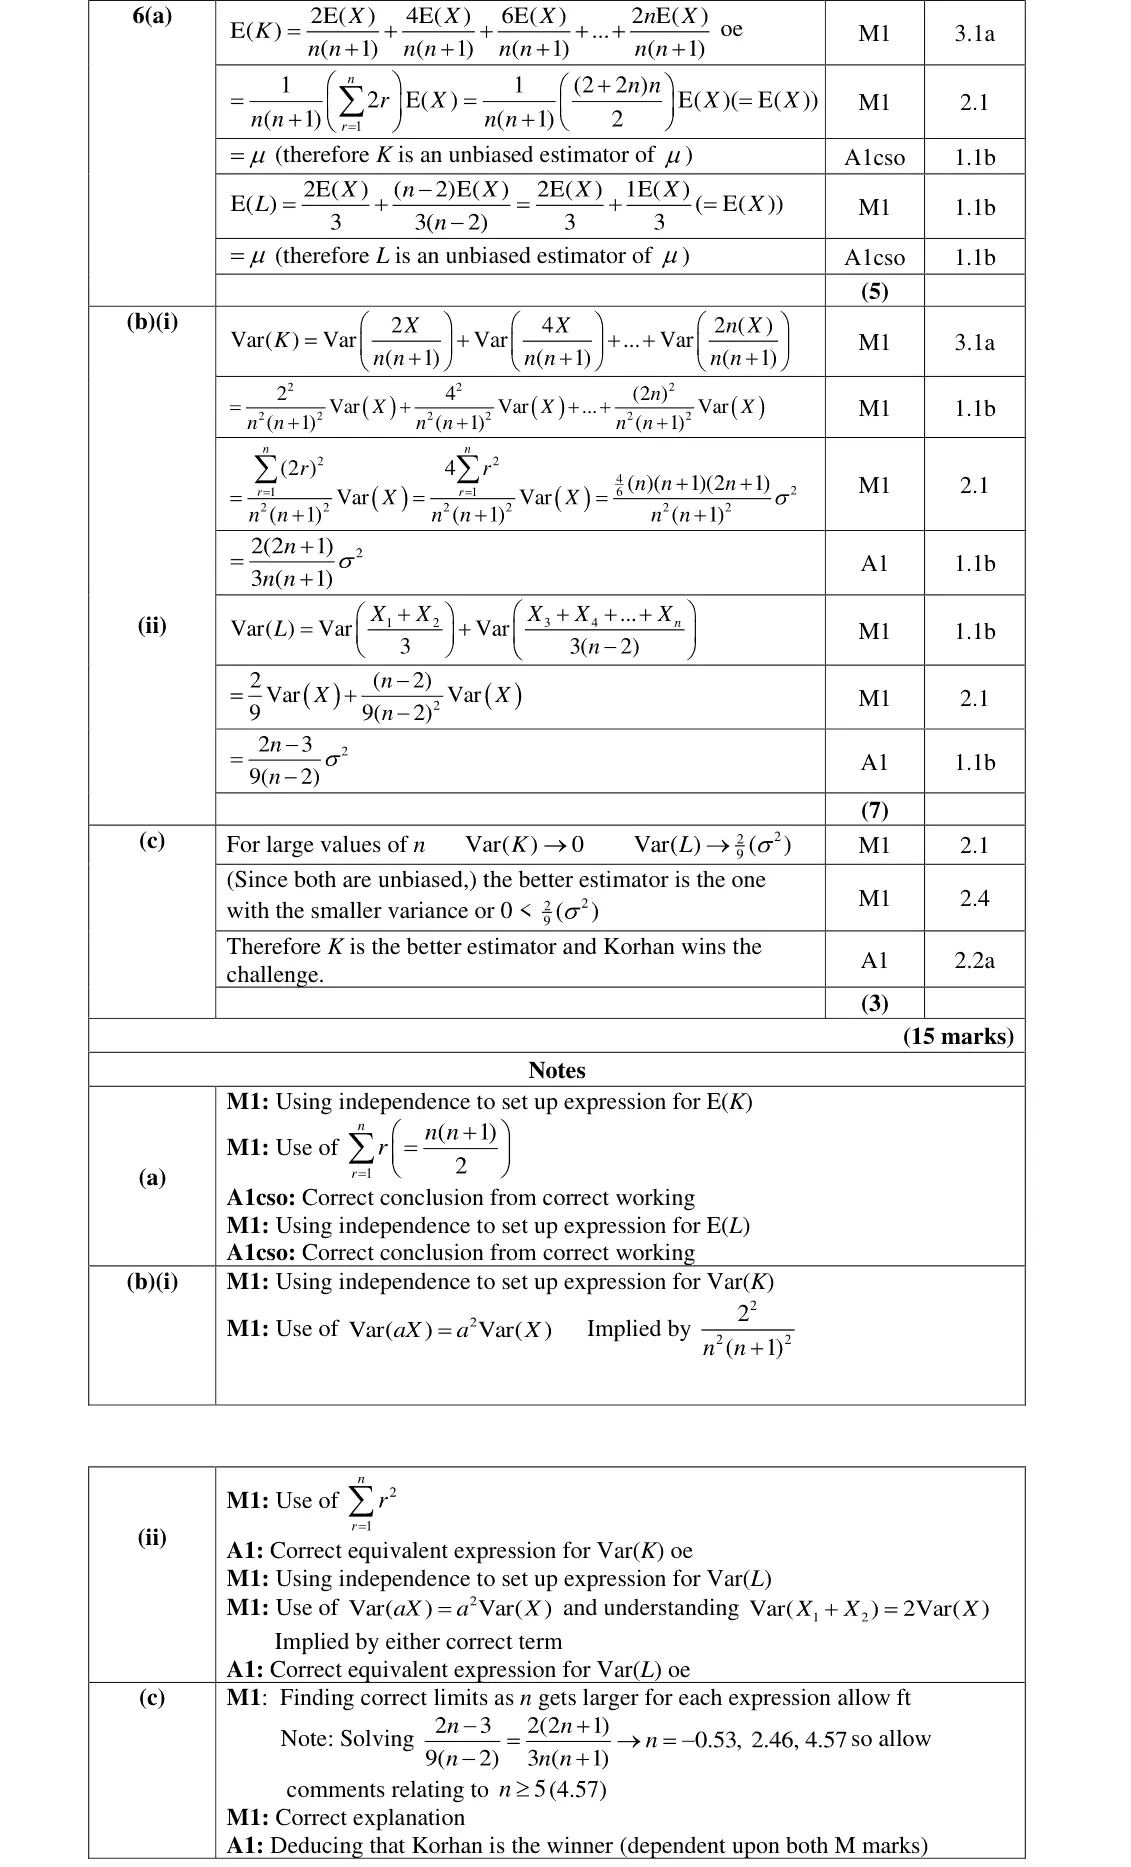
June 2022 · Paper 4B (Further Statistics 2) · Q6(b)7 marks
Mark scheme (whole question; this part is marked with the orange bar)
Examiner's comment
This was one of the most demanding questions on the paper and fully correct responses were (b)(i) was challenging for many. Many recognised that the sum of the variances was needed, but most did not recognise the need to use the sum of the squares. On some occasions the square 2 2 of the sum from part (a) was used. Some correctly factorised out but made no further n n + 2 2 ( 1) (b)(ii) had a higher success rate with most showing some understanding of both = + = and but some could not correctly simplify 2 Var( aX ) Var( a ) X Var( X ) X 2Var( ) X 1 2 their answer to a single term.
Key points from the mark scheme and examiner's report
Var(K) = 4Σr² σ²/(n²(n + 1)²) = 2(2n + 1)σ²/(3n(n + 1)) using Σr² (not the square of Σr)
June 2022 · Paper 4B (Further Statistics 2) · Q6(c)3 marks
Mark scheme (whole question; this part is marked with the orange bar)
Examiner's comment
This was one of the most demanding questions on the paper and fully correct responses were In part (c) many showed knowledge that the unbiased estimator with the smallest variance was the better estimator, but only a few were able to fully justify for large values of n the limit of each of the estimators. This part again discriminated the most able candidates on this paper. 5
Key points from the mark scheme and examiner's report
as n → ∞, Var(K) → 0 and Var(L) → 2σ²/9
both unbiased so smaller variance is better: Korhan wins
few justified the limits
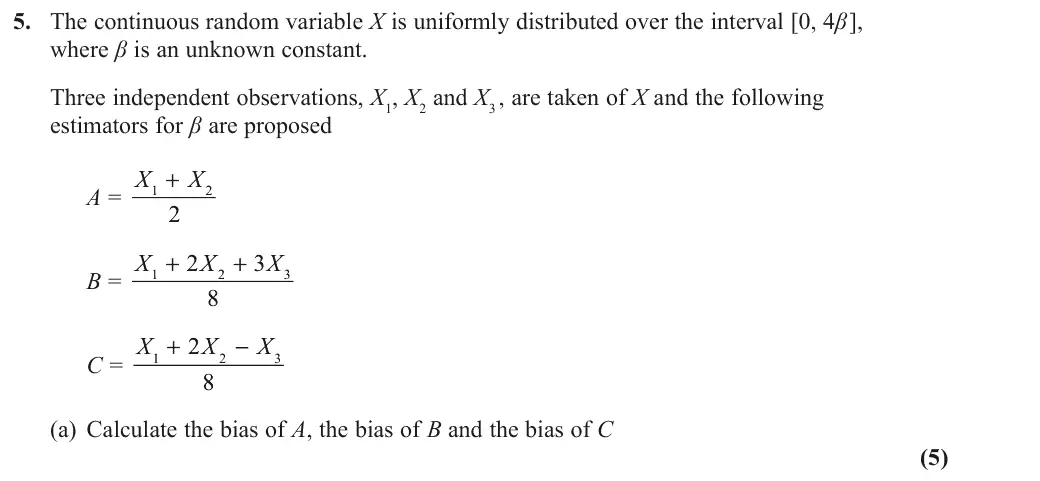
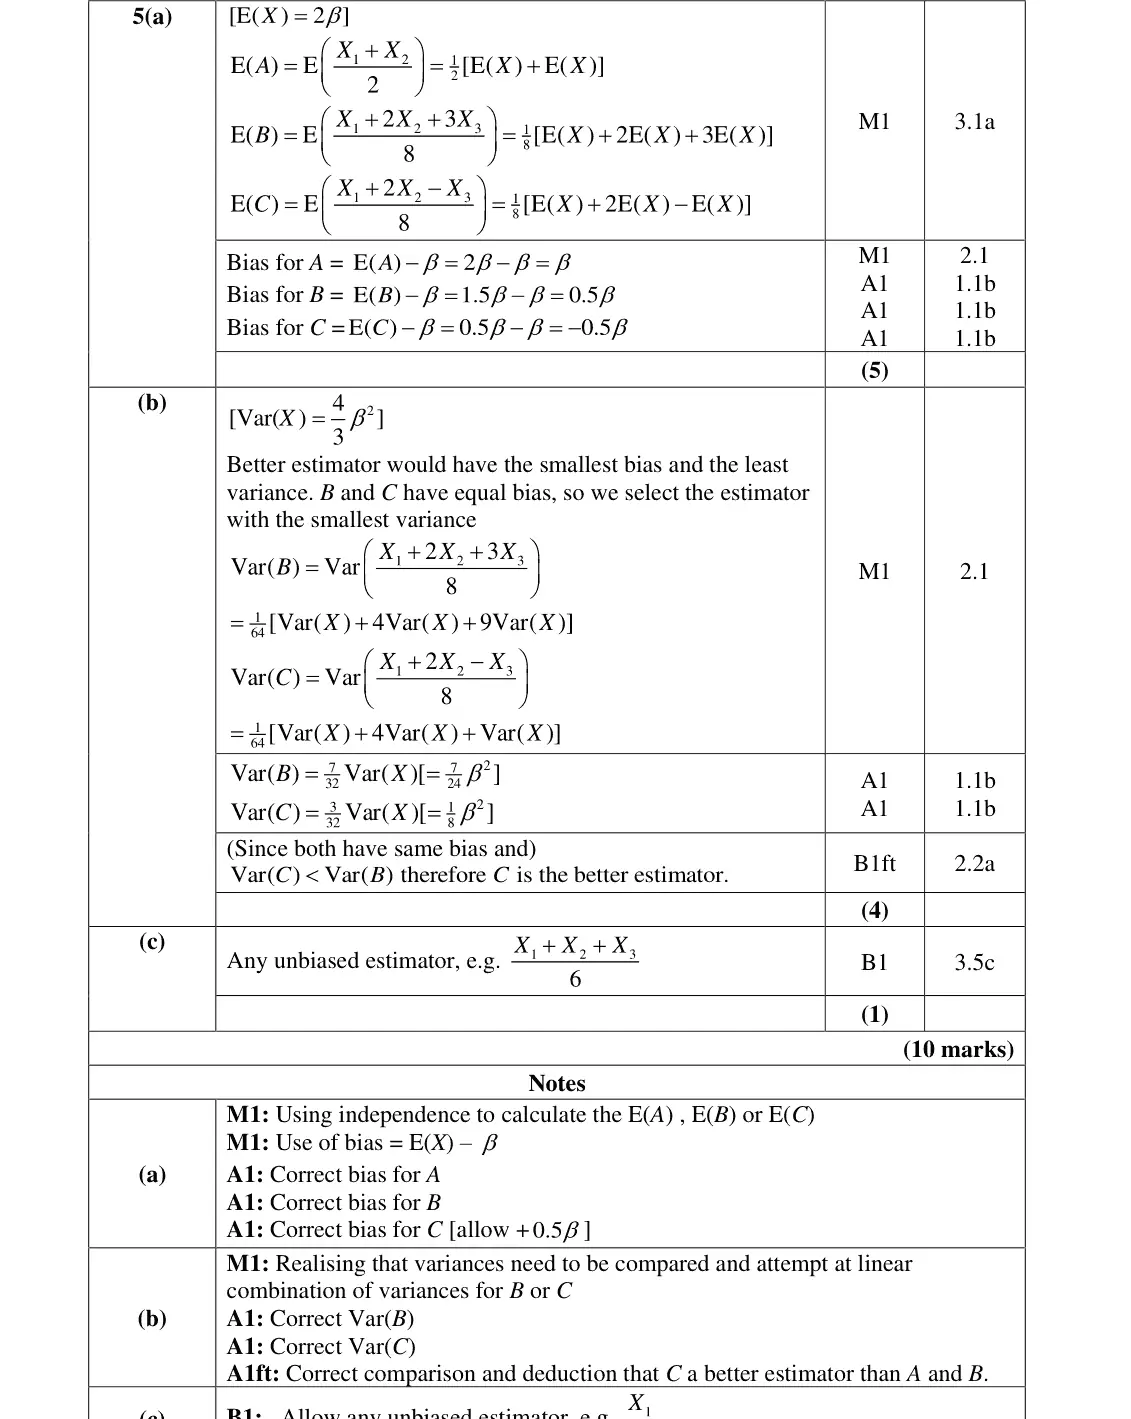
Nov 2021 · Paper 4B (Further Statistics 2) · Q5(a)5 marks
Mark scheme (whole question; this part is marked with the orange bar)
Key points from the mark scheme and examiner's report
E(X) = 2β
bias = E(estimator) − β: A gives β, B gives 0.5β, C gives −0.5β
Nov 2021 · Paper 4B (Further Statistics 2) · Q5(b)4 marks
Mark scheme (whole question; this part is marked with the orange bar)
Key points from the mark scheme and examiner's report
Var(S) < Var(T) reduces to (m − n)² > 0, true as m ≠ n, so S has smaller variance and is better
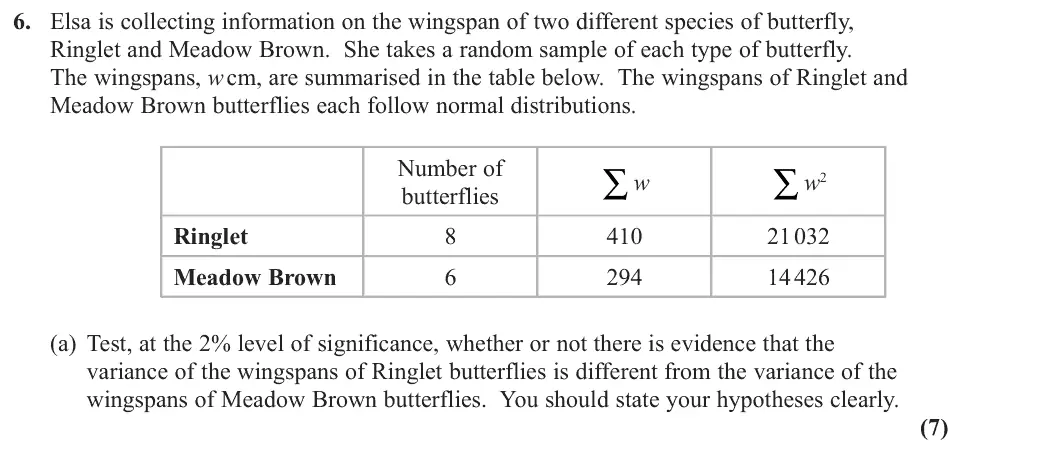
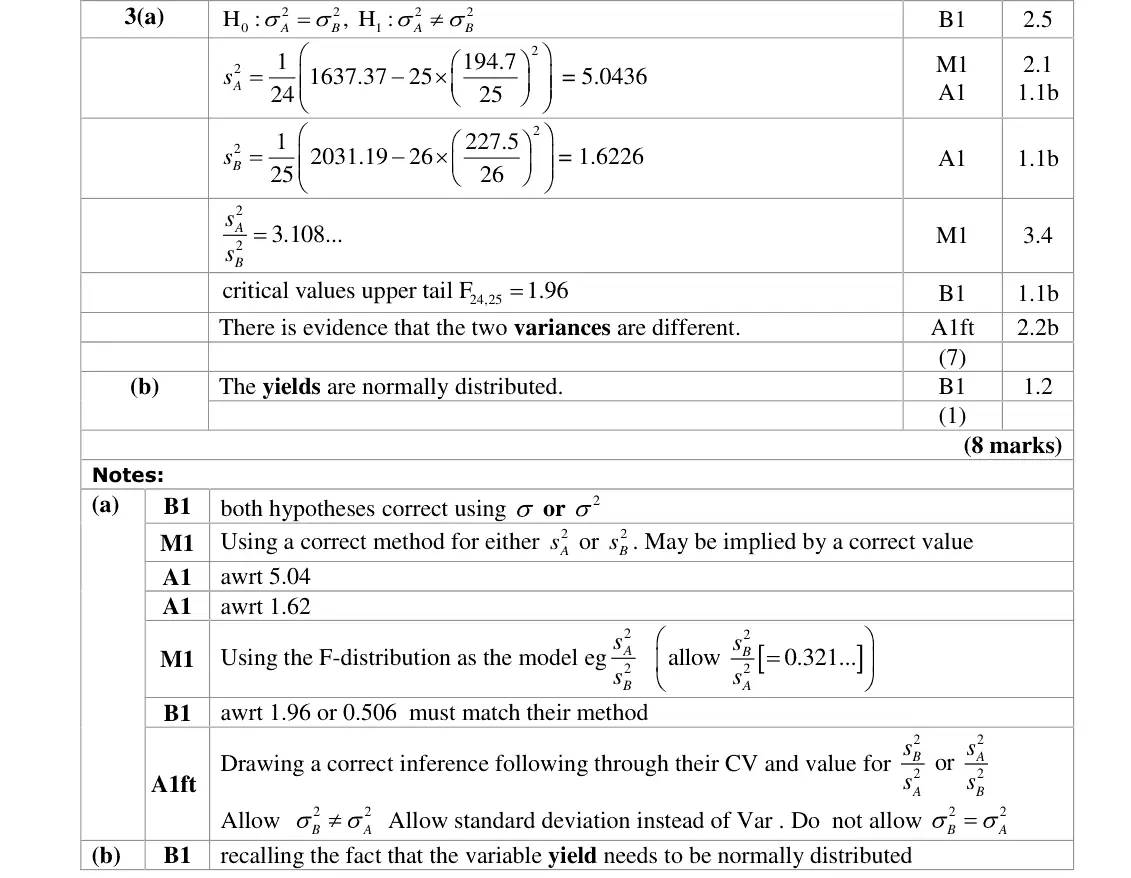
June 2019 · Paper 4B (Further Statistics 2) · Q3(a)7 marks
Mark scheme (whole question; this part is marked with the orange bar)
Examiner's comment
This question was well answered with the majority of candidates gaining the marks in part (a). The main error that occurred was writing the hypotheses in terms of the wrong parameter.
Key points from the mark scheme and examiner's report
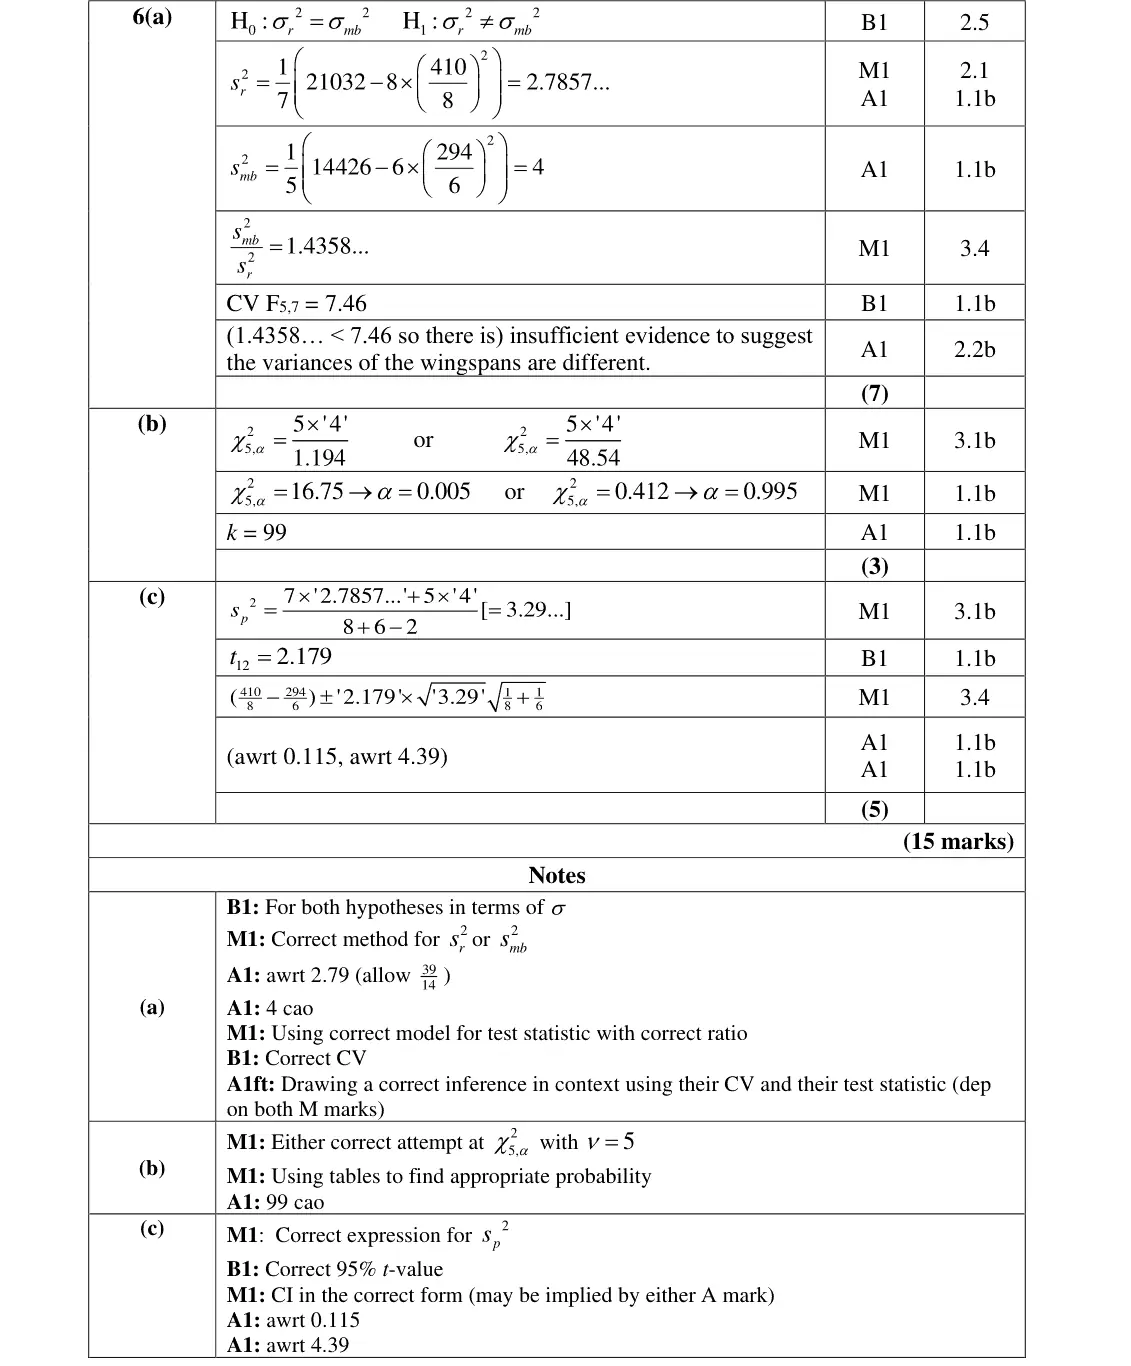
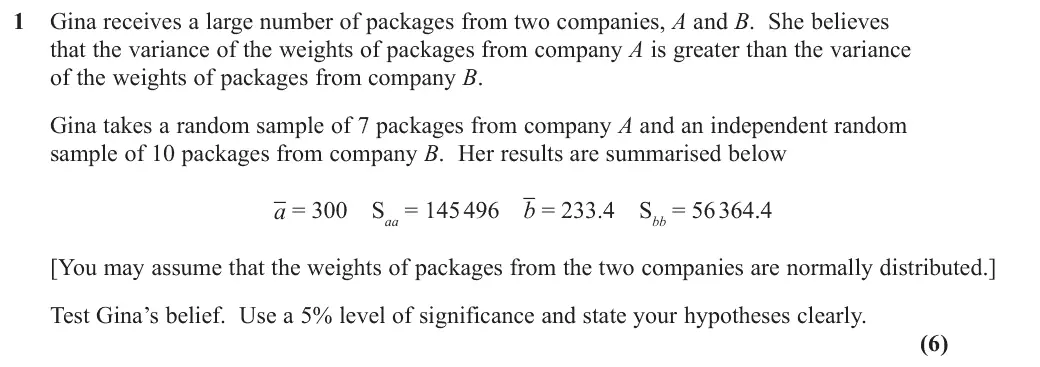
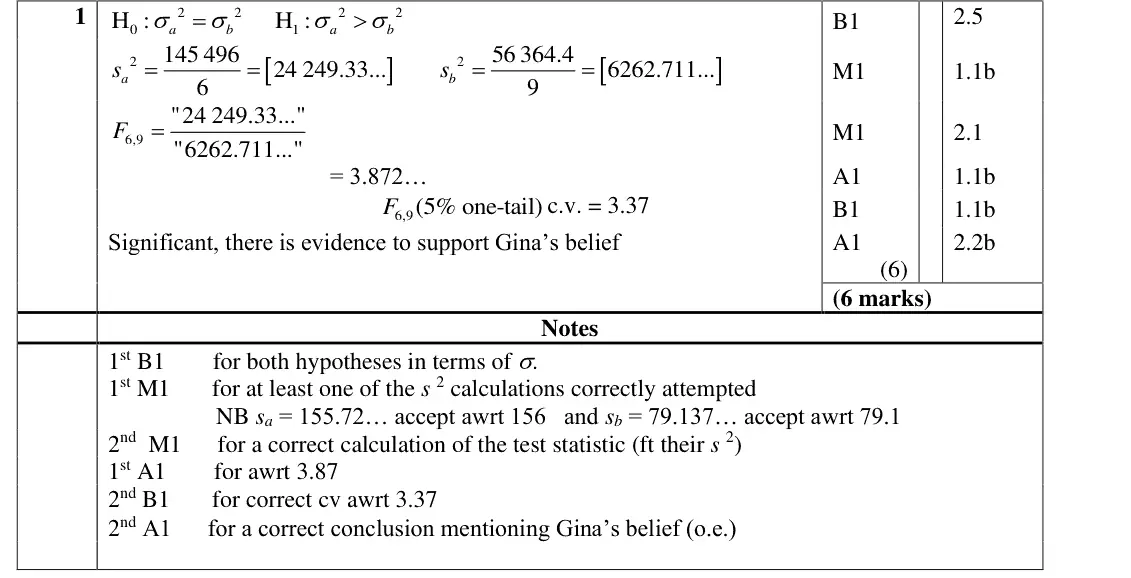
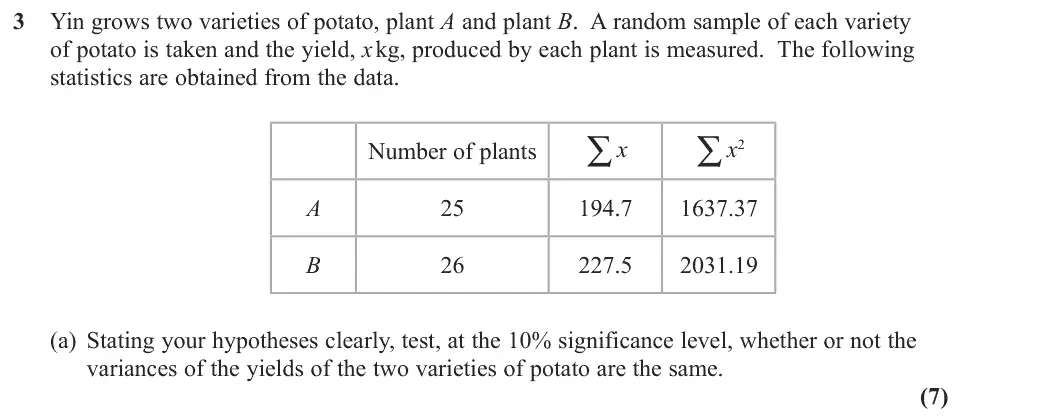
H₀: σA² = σB², H₁: σA² ≠ σB² (two-tailed)
sA² = 5.04, sB² = 1.62
F = 3.108 > F(24,25) upper 5% value 1.96, so variances differ
common error: hypotheses in terms of the wrong parameter
Find an Edexcel Further Maths tutor
Stuck on this? Book a trial lesson with our Further Maths tutor.