June 2019: A level Paper 4B: Further Statistics 2

75 marks · 22 question parts · Question paper, mark scheme and examiner's report on Pearson's site

Question by question

QTopicMarksDifficulty
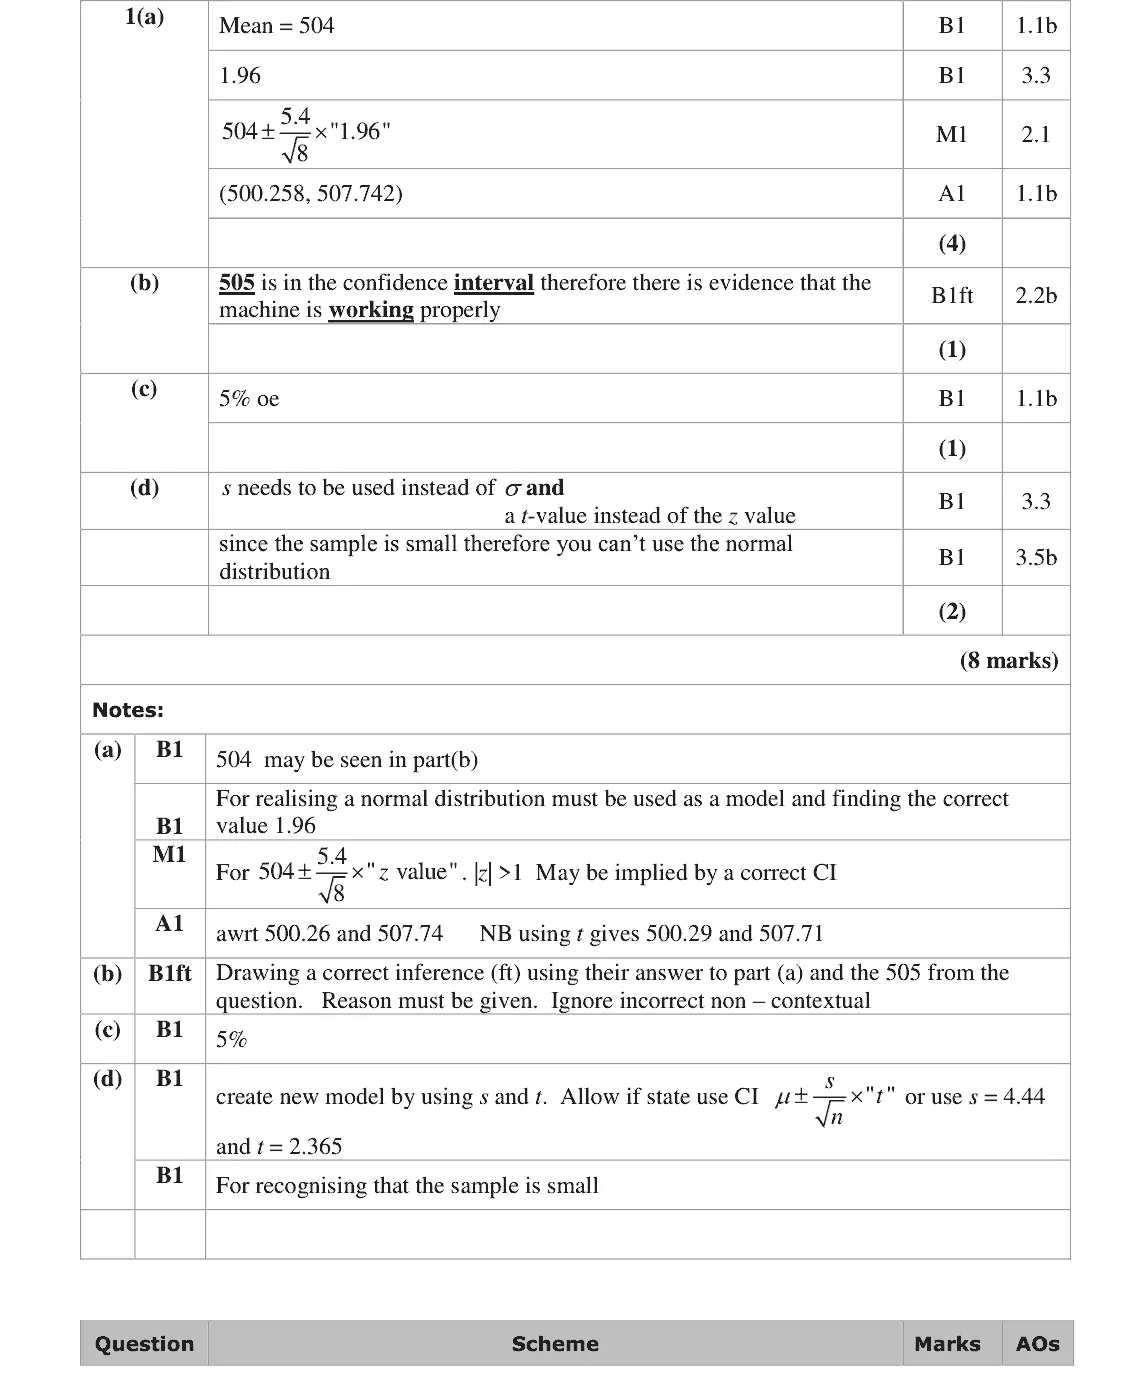
1(a) Estimators, confidence intervals and tests using the normal distribution 4 —
1(b) Estimators, confidence intervals and tests using the normal distribution 1 —
1(c) Estimators, confidence intervals and tests using the normal distribution 1 —
1(d) The t-distribution: t-tests and paired t-tests, Estimators, confidence intervals and tests using the normal distribution 2 —
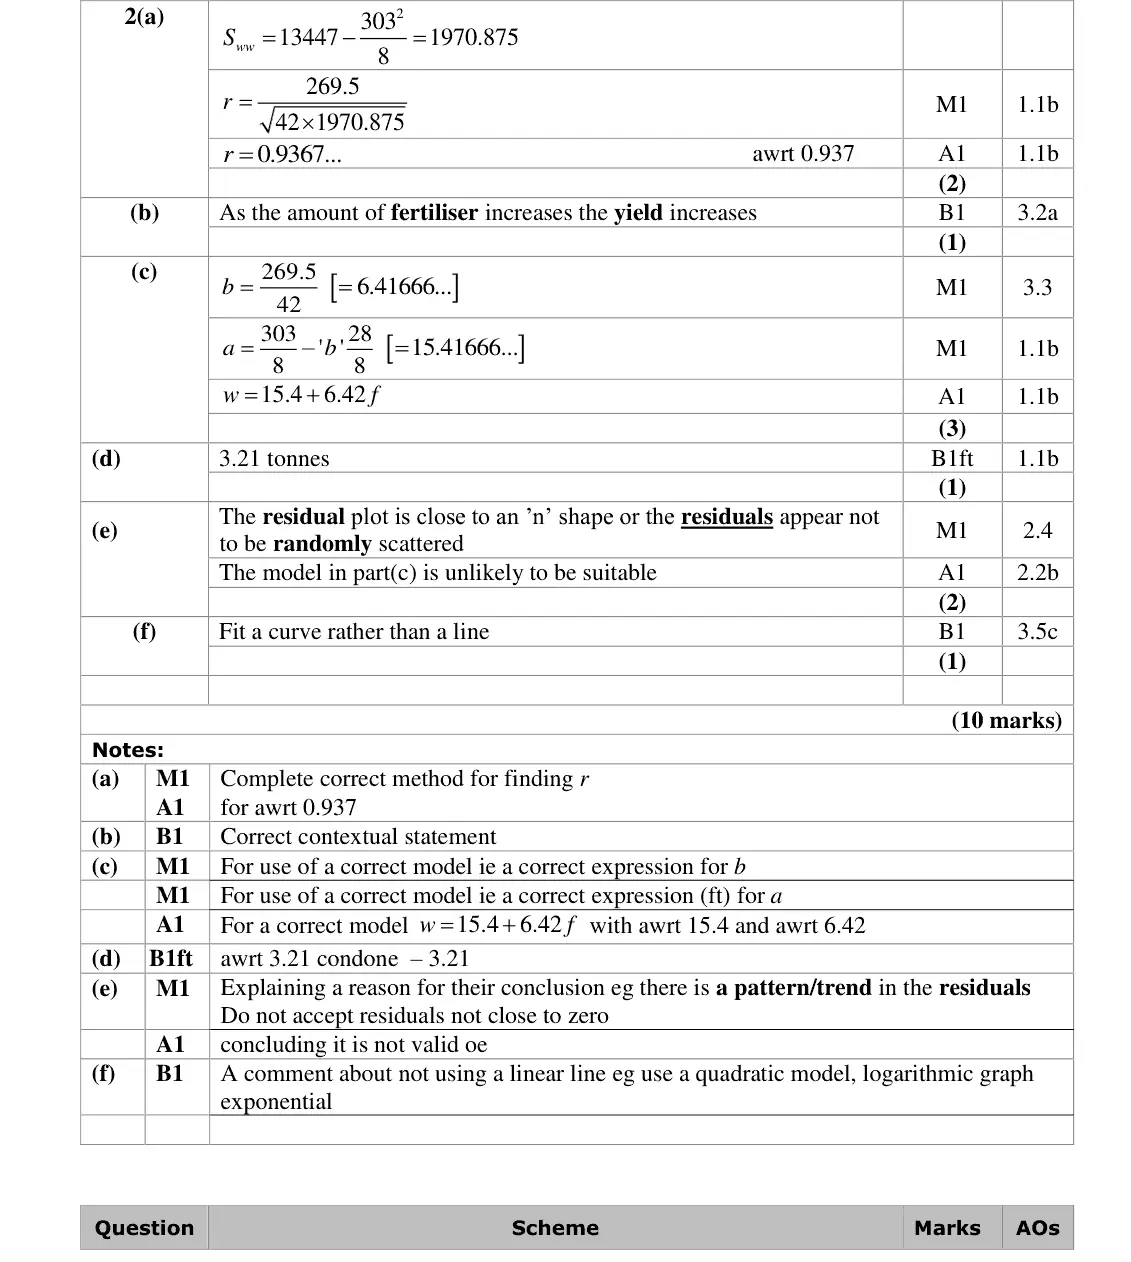
2(a) Correlation: PMCC, Spearman's rank and tests 2 —
2(b) Correlation: PMCC, Spearman's rank and tests 1 —
2(c) Linear regression and residuals 3 —
2(d) Linear regression and residuals 1 —
2(e) Linear regression and residuals 2 —
2(f) Linear regression and residuals 1 —
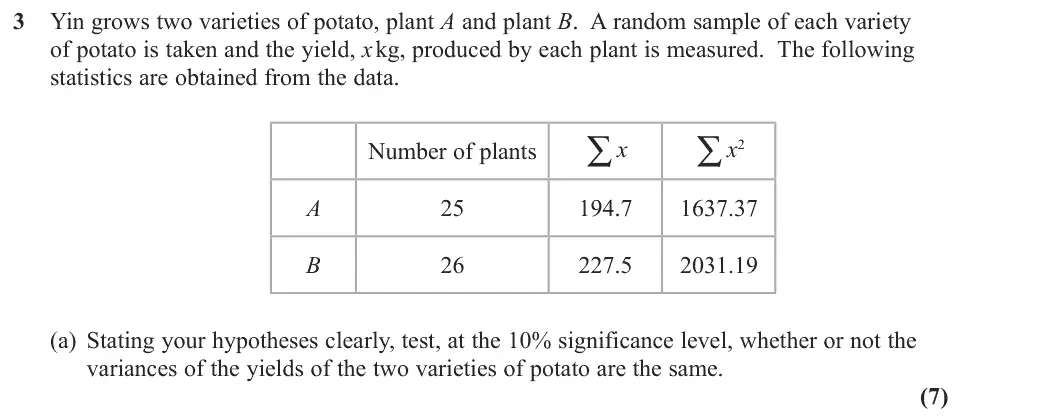
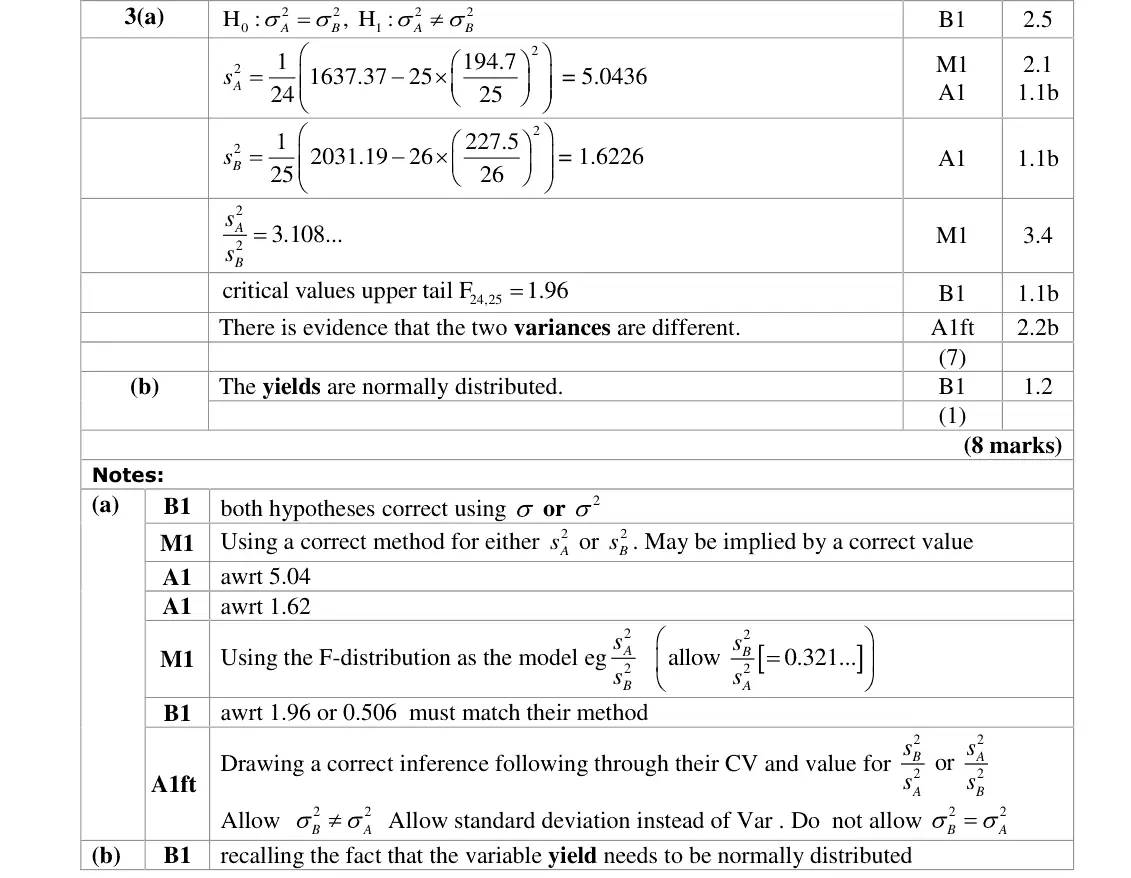
3(a) Variance tests: chi-squared and F-distribution 7 —
3(b) Variance tests: chi-squared and F-distribution 1 —
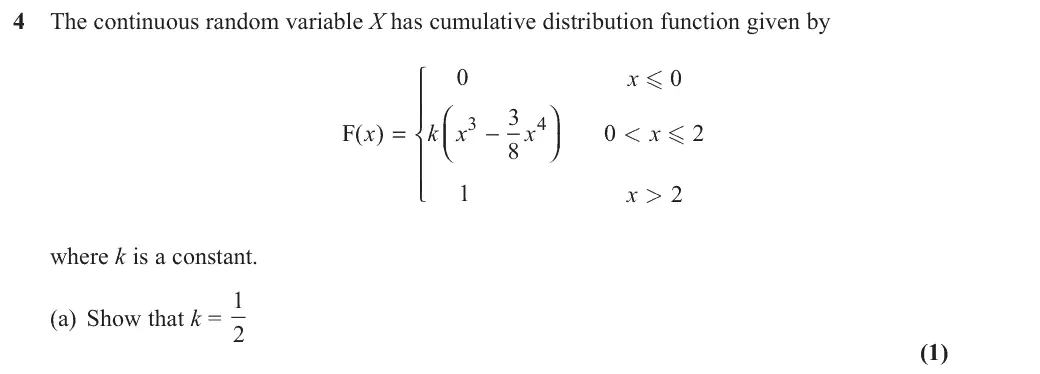
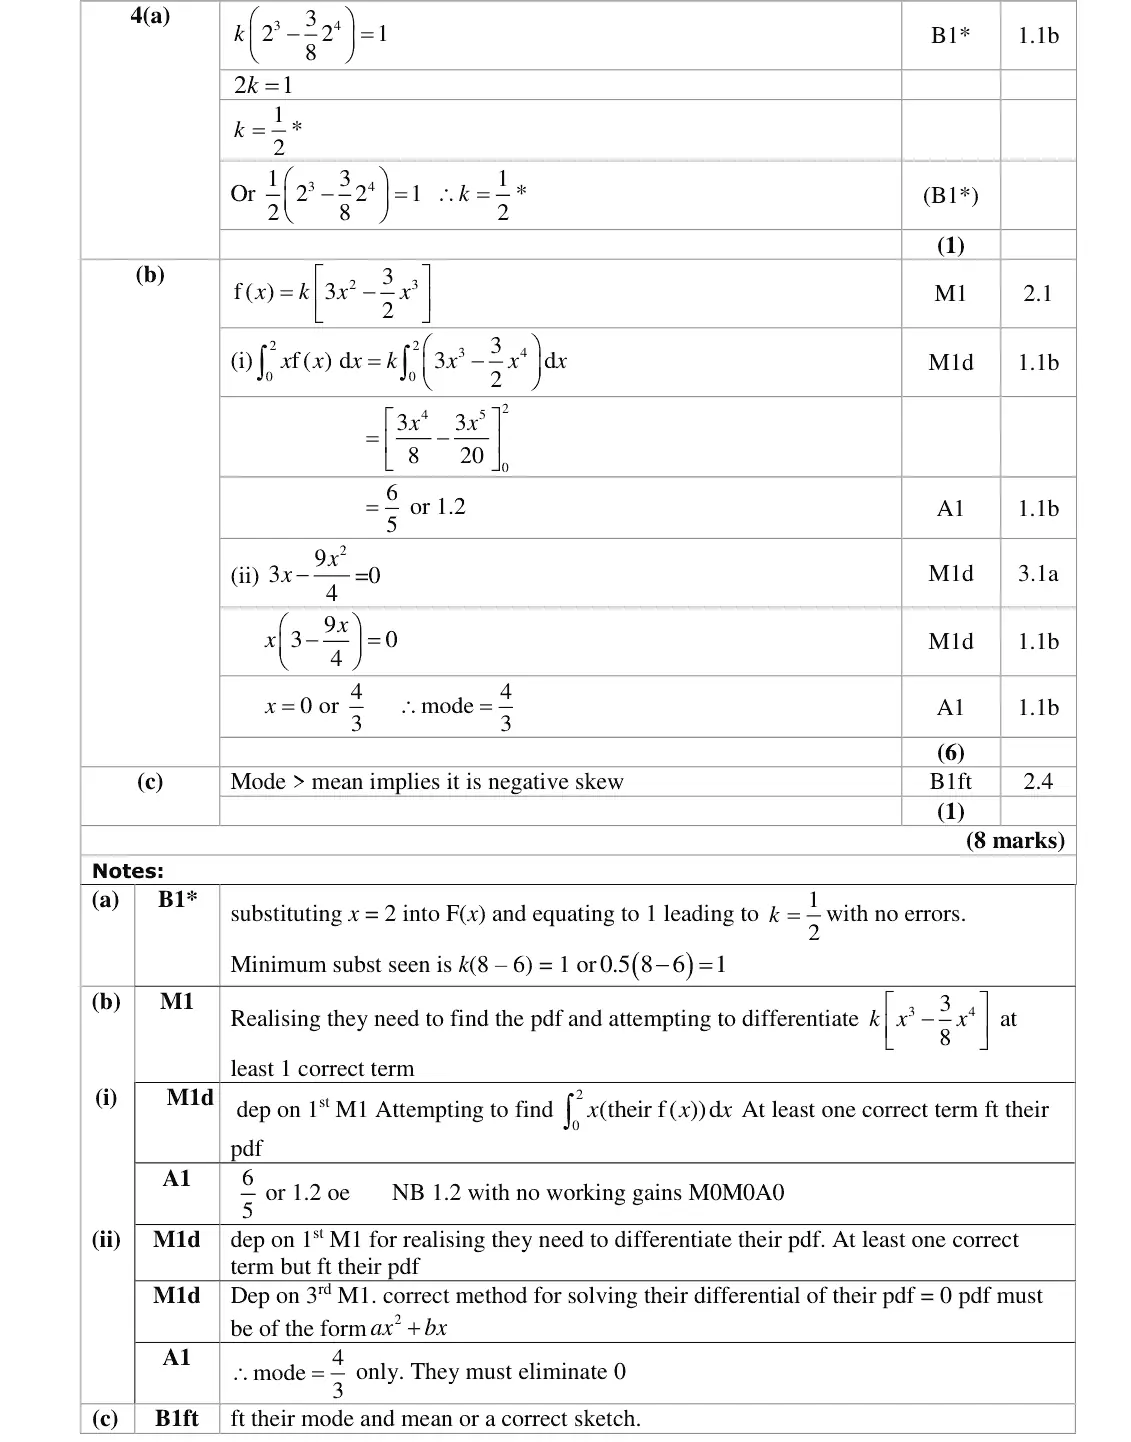
4(a) Continuous random variables and the uniform distribution 1 —
4(b) Continuous random variables and the uniform distribution 6 —
4(c) Continuous random variables and the uniform distribution 1 —
5 The t-distribution: t-tests and paired t-tests 7 —
6 Variance tests: chi-squared and F-distribution, The t-distribution: t-tests and paired t-tests 9 —
7(a) Combinations of random variables 6 —
7(b) Combinations of random variables 8 —
8(a) Correlation: PMCC, Spearman's rank and tests 4 —
8(b) Correlation: PMCC, Spearman's rank and tests 5 —
8(c) Correlation: PMCC, Spearman's rank and tests 2 —

The questions

1(a)1(b)1(c)1(d)2(a)2(b)2(c)2(d)2(e)2(f)3(a)3(b)4(a)4(b)4(c)567(a)7(b)8(a)8(b)8(c)
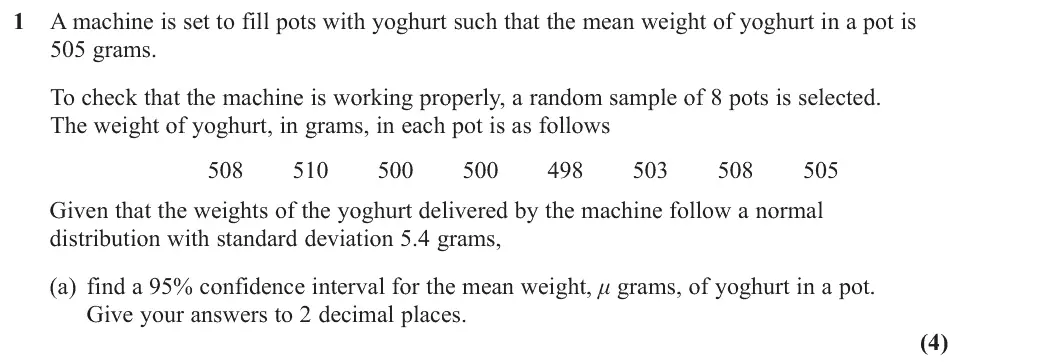
June 2019 · Paper 4B (Further Statistics 2) · Q1(a) 4 marks estimation and confidence intervals
1 A machine is set to fill pots with yoghurt such that the mean weight of yoghurt in a pot is 505 grams. To check that the machine is working properly, a random sample of 8 pots is selected. The weight of yoghurt, in grams, in each pot is as follows Given that the weights of the yoghurt delivered by the machine follow a normal distribution with standard deviation 5.4 grams, (a) find a 95% confidence interval for the mean weight, ȝ grams, of yoghurt in a pot. Give your answers to 2 decimal places. (4)
June 2019 · Paper 4B (Further Statistics 2) · Q1(b) 1 mark estimation and confidence intervals
(b) Comment on whether or not the machine is working properly, giving a reason for your answer. (1)
June 2019 · Paper 4B (Further Statistics 2) · Q1(c) 1 mark estimation and confidence intervals
(c) State the probability that a 95% confidence interval for ȝ will not contain ȝ grams. (1)
June 2019 · Paper 4B (Further Statistics 2) · Q1(d) 2 marks t testsestimation and confidence intervals
(d) Without carrying out any further calculations, explain the changes, if any, that would need to be made in calculating the confidence interval in part (a) if the standard deviation was unknown. Give a reason for your answer. You may assume that the weights of the yoghurt delivered by the machine still follow a normal distribution. (2)
June 2019 · Paper 4B (Further Statistics 2) · Q2(a) 2 marks correlation fs2
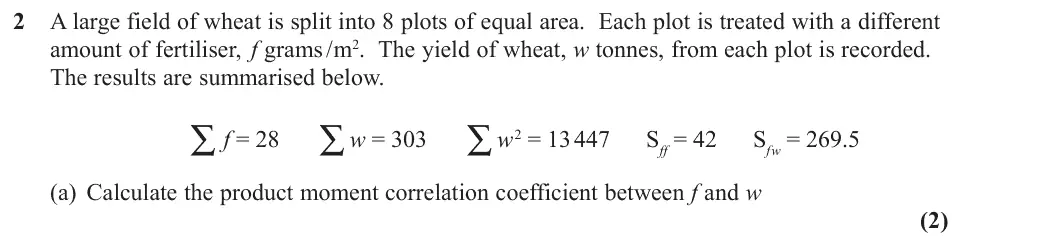
2 A large field of wheat is split into 8 plots of equal area. Each plot is treated with a different amount of fertiliser, f grams /m2. The yield of wheat, w tonnes, from each plot is recorded. The results are summarised below. ∑ f = 28 ∑w = 303 ∑w2 = 13 447 Sff = 42 Sfw = 269.5 (a) Calculate the product moment correlation coefficient between f and w (2)
June 2019 · Paper 4B (Further Statistics 2) · Q2(b) 1 mark correlation fs2
(b) Interpret the value of your product moment correlation coefficient. (1)
June 2019 · Paper 4B (Further Statistics 2) · Q2(c) 3 marks linear regression
(c) Find the equation of the regression line of w on f in the form w = a + bf (3)
June 2019 · Paper 4B (Further Statistics 2) · Q2(d) 1 mark linear regression
(d) Using your equation, estimate the decrease in yield when the amount of fertiliser decreases by 0.5 grams /m2 (1)
June 2019 · Paper 4B (Further Statistics 2) · Q2(e) 2 marks linear regression
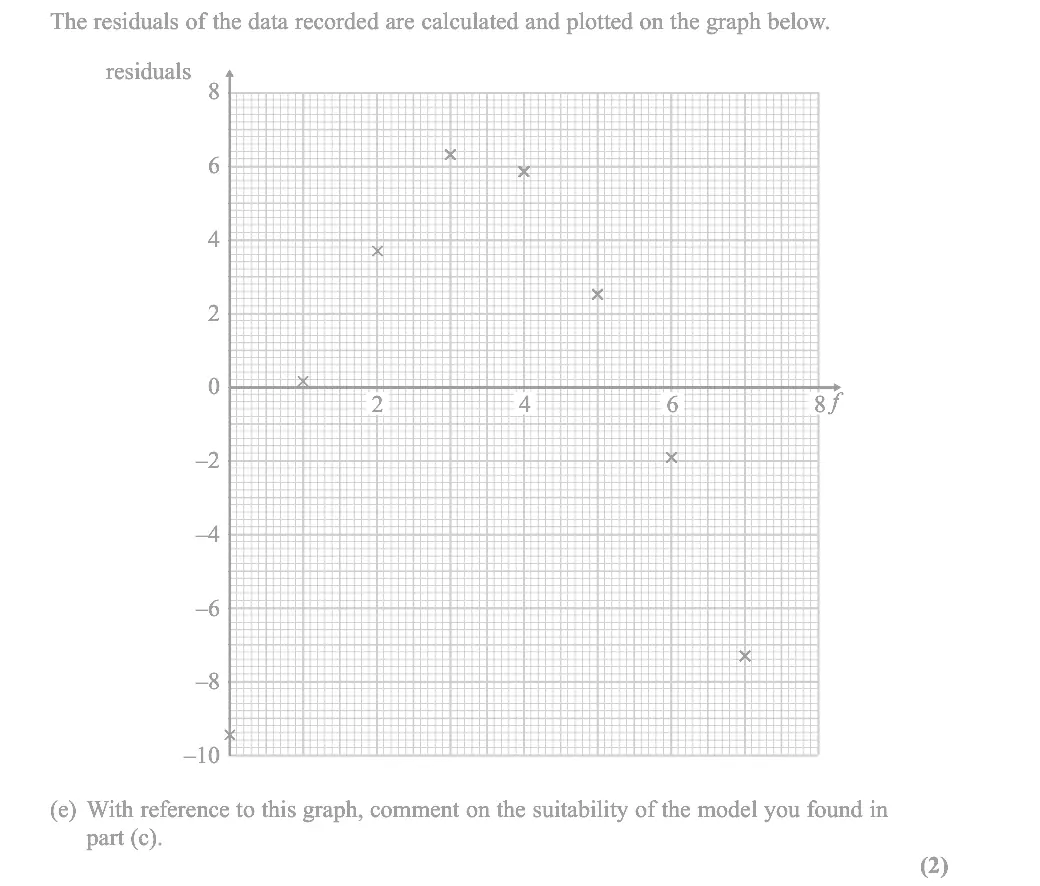
The residuals of the data recorded are calculated and plotted on the graph below. residuals 8 f –2 –4 –6 –8 –10 (e) With reference to this graph, comment on the suitability of the model you found in part (c). (2)
June 2019 · Paper 4B (Further Statistics 2) · Q2(f) 1 mark linear regression
(f) Suggest how you might be able to refine your model. (1)
June 2019 · Paper 4B (Further Statistics 2) · Q3(a) 7 marks chi squared and f tests
3 Yin grows two varieties of potato, plant A and plant B. A random sample of each variety of potato is taken and the yield, x kg, produced by each plant is measured. The following statistics are obtained from the data. ∑x ∑x2 Number of plants A 194.7 1637.37 B 227.5 2031.19 (a) Stating your hypotheses clearly, test, at the 10% significance level, whether or not the variances of the yields of the two varieties of potato are the same. (7)
June 2019 · Paper 4B (Further Statistics 2) · Q3(b) 1 mark chi squared and f tests
(b) State an assumption you have made in order to carry out the test in part (a). (1)
June 2019 · Paper 4B (Further Statistics 2) · Q4(a) 1 mark continuous random variables
4 The continuous random variable X has cumulative distribution function given by - x ⎧ ⎪⎪ ⎛ ⎞ - F( ) x = k x - x < x ⎨ ⎝⎜ ⎠⎟ ⎪ ⎪ ⎩ x > where k is a constant. (a) Show that k = 1 (1)
June 2019 · Paper 4B (Further Statistics 2) · Q4(b) 6 marks continuous random variables
(b) Showing your working clearly, use calculus to find (i) E(X) (ii) the mode of X (6)
June 2019 · Paper 4B (Further Statistics 2) · Q4(c) 1 mark continuous random variables
(c) Describe, giving a reason, the skewness of the distribution of X (1)
June 2019 · Paper 4B (Further Statistics 2) · Q5 7 marks t tests
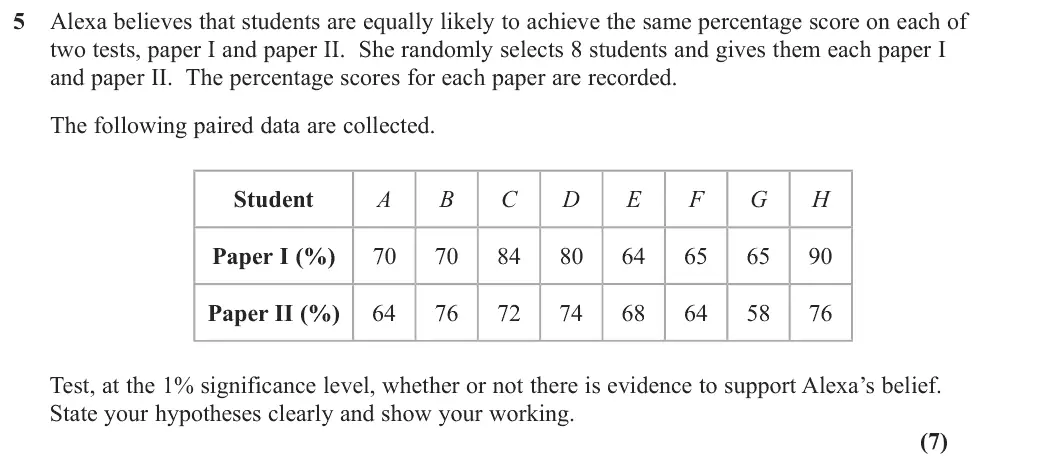
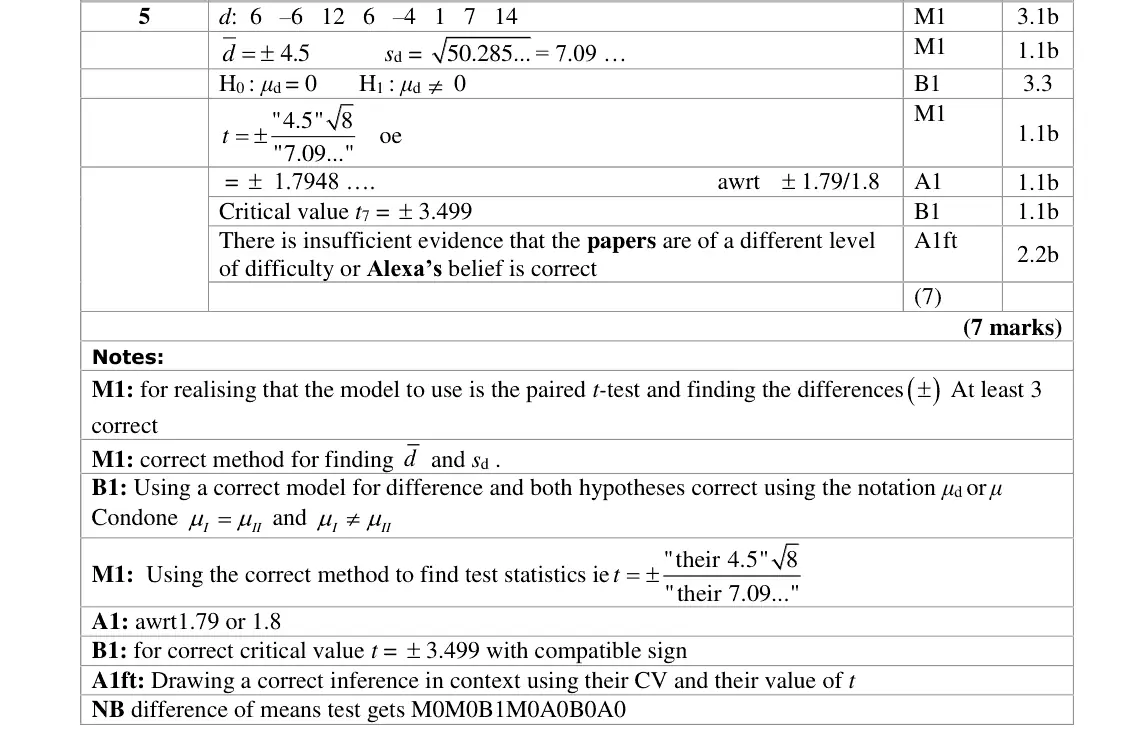
5 Alexa believes that students are equally likely to achieve the same percentage score on each of two tests, paper I and paper II. She randomly selects 8 students and gives them each paper I and paper II. The percentage scores for each paper are recorded. The following paired data are collected. Student A B C E F G H Paper I (%) Paper II (%) Test, at the 1% significance level, whether or not there is evidence to support Alexa’s belief. State your hypotheses clearly and show your working. (7)
June 2019 · Paper 4B (Further Statistics 2) · Q6 9 marks chi squared and f testst tests
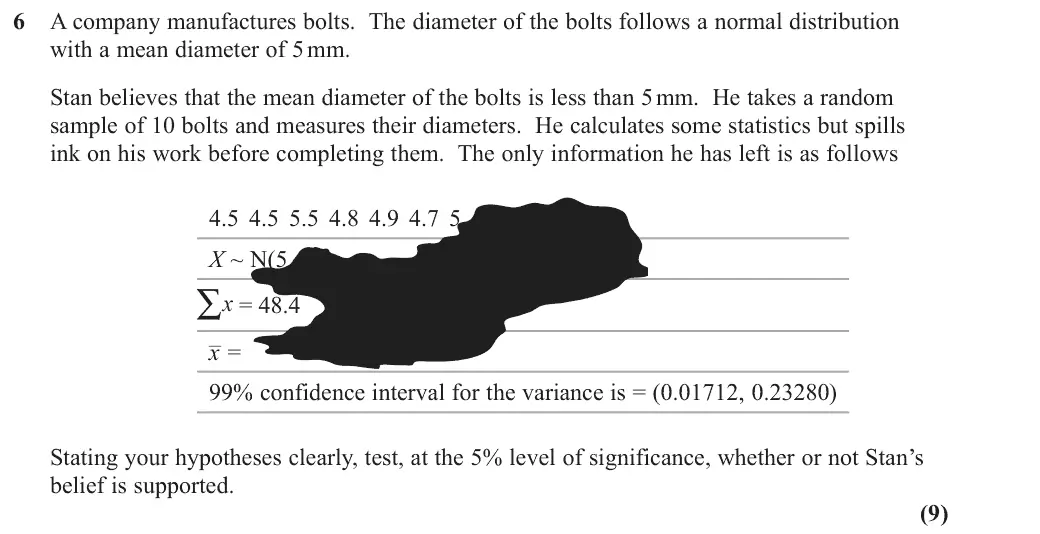
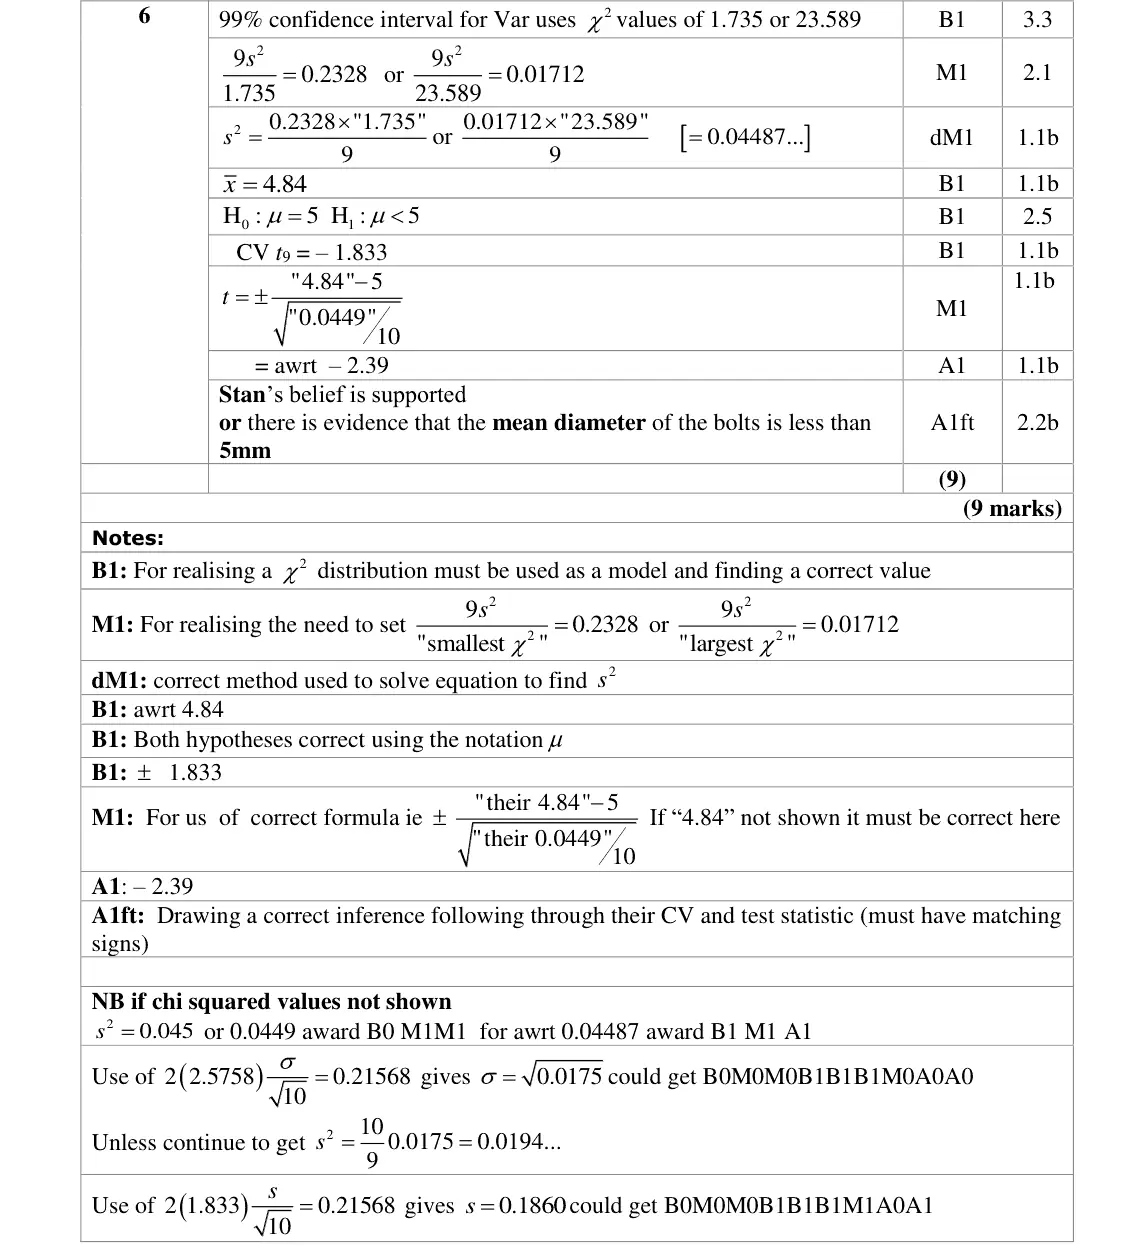
6 A company manufactures bolts. The diameter of the bolts follows a normal distribution with a mean diameter of 5 mm. Stan believes that the mean diameter of the bolts is less than 5 mm. He takes a random sample of 10 bolts and measures their diameters. He calculates some statistics but spills ink on his work before completing them. The only information he has left is as follows 4.5 4.5 5.5 4.8 4.9 4.7 5 X ~ N(5 2) ∑ x = 48.4 x– = 99% confidence interval for the variance is = (0.01712, 0.23280) Stating your hypotheses clearly, test, at the 5% level of significance, whether or not Stan’s belief is supported. (9)
June 2019 · Paper 4B (Further Statistics 2) · Q7(a) 6 marks combinations of random variables
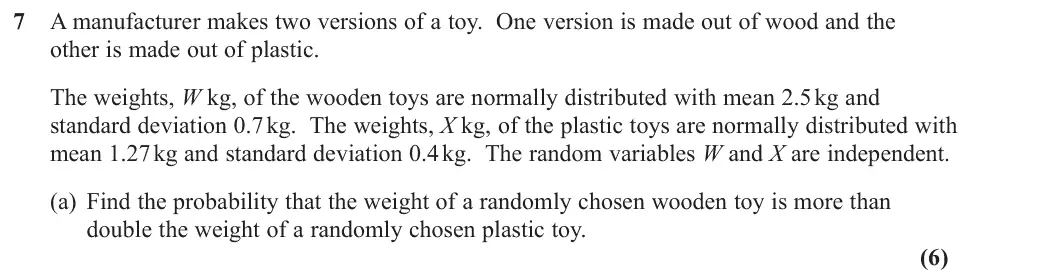
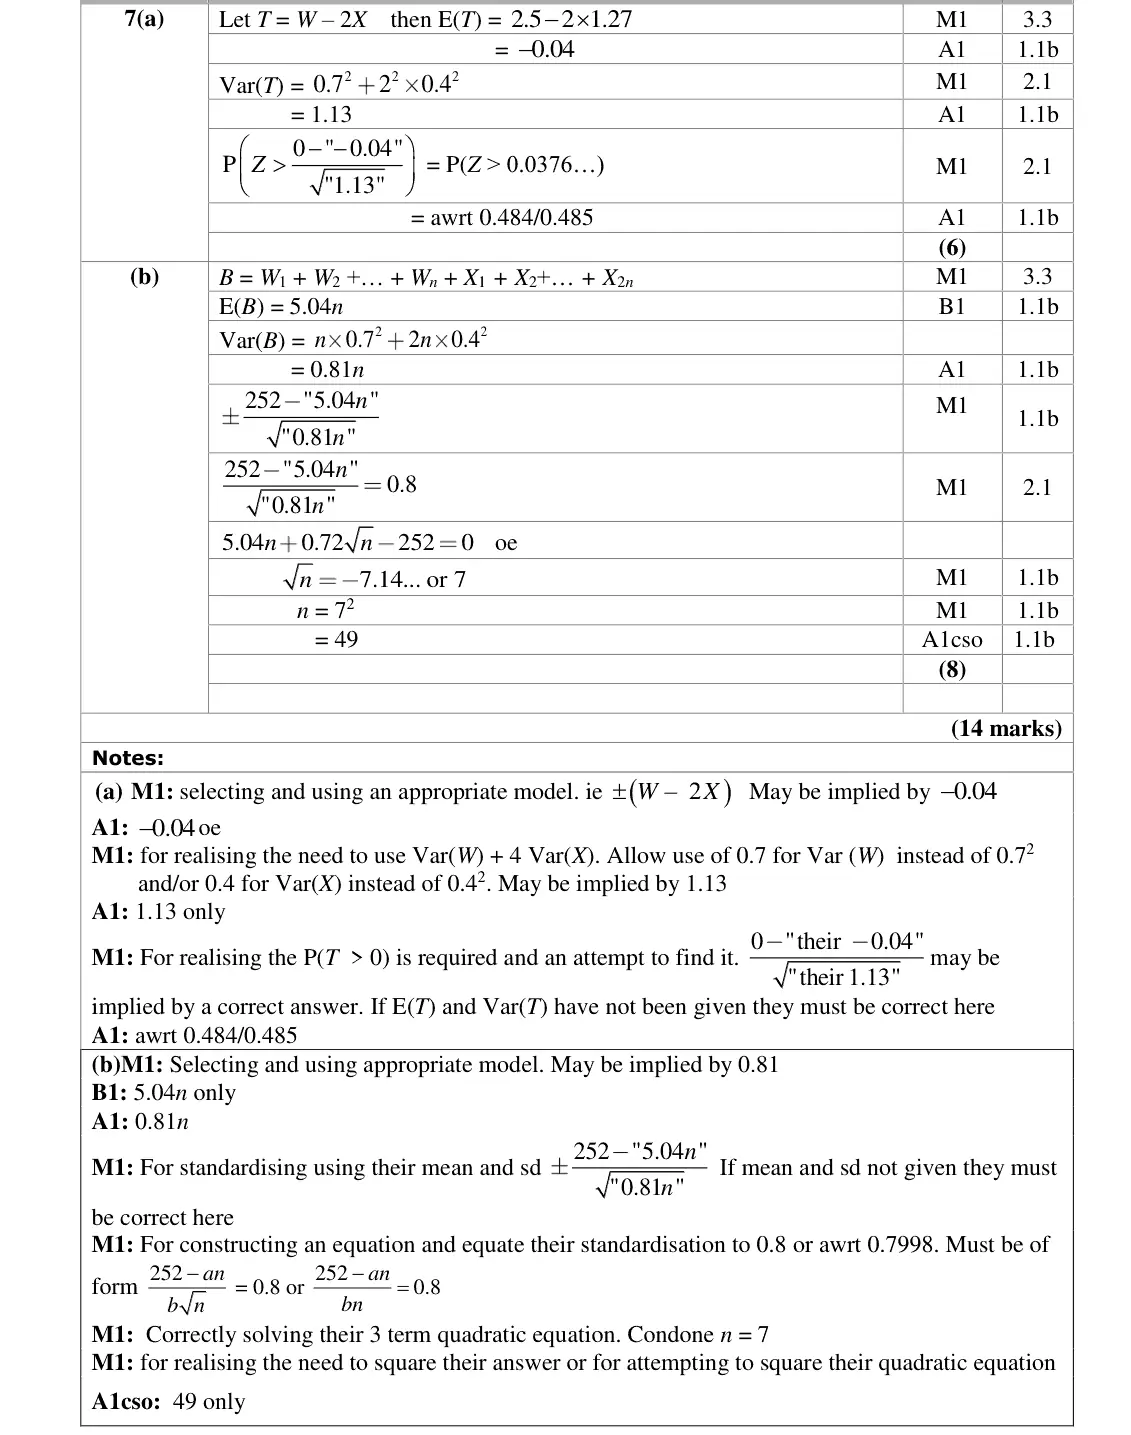
7 A manufacturer makes two versions of a toy. One version is made out of wood and the other is made out of plastic. The weights, W kg, of the wooden toys are normally distributed with mean 2.5 kg and standard deviation 0.7 kg. The weights, X kg, of the plastic toys are normally distributed with mean 1.27 kg and standard deviation 0.4 kg. The random variables W and X are independent. (a) Find the probability that the weight of a randomly chosen wooden toy is more than double the weight of a randomly chosen plastic toy. (6)
June 2019 · Paper 4B (Further Statistics 2) · Q7(b) 8 marks combinations of random variables
The manufacturer packs n of these wooden toys and 2n of these plastic toys into the same container. The maximum weight the container can hold is 252 kg. The probability of the contents of this container being overweight is 0.2119 to 4 decimal places. (b) Calculate the value of n. (8)
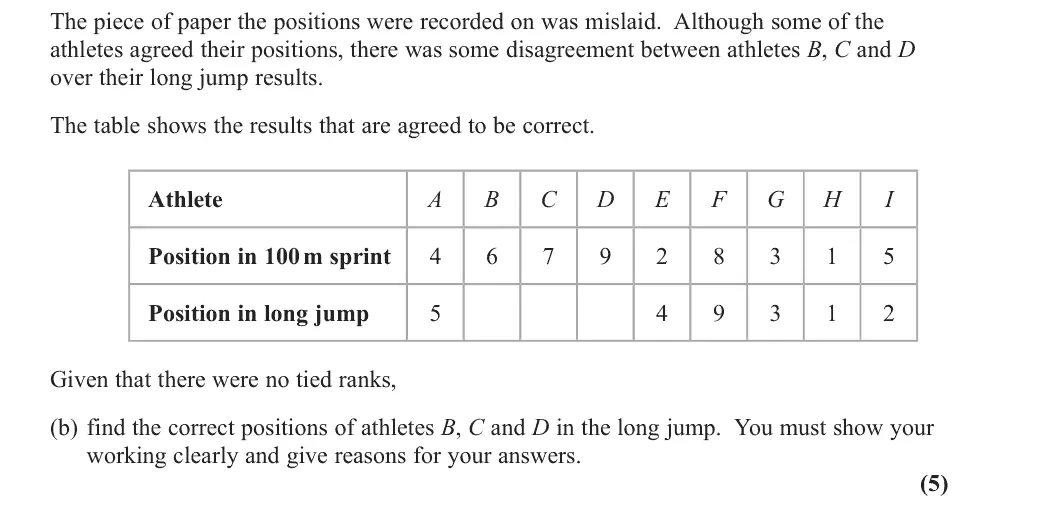
June 2019 · Paper 4B (Further Statistics 2) · Q8(a) 4 marks correlation fs2
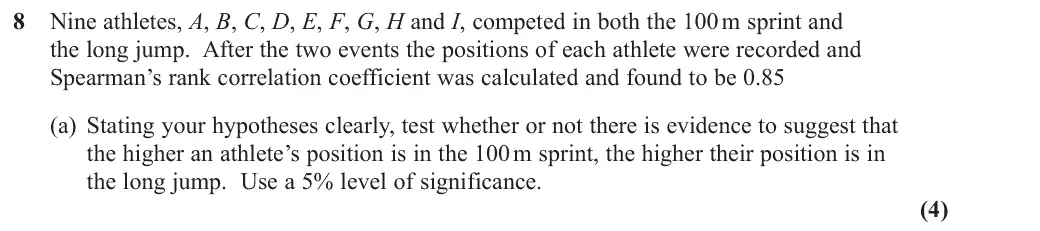
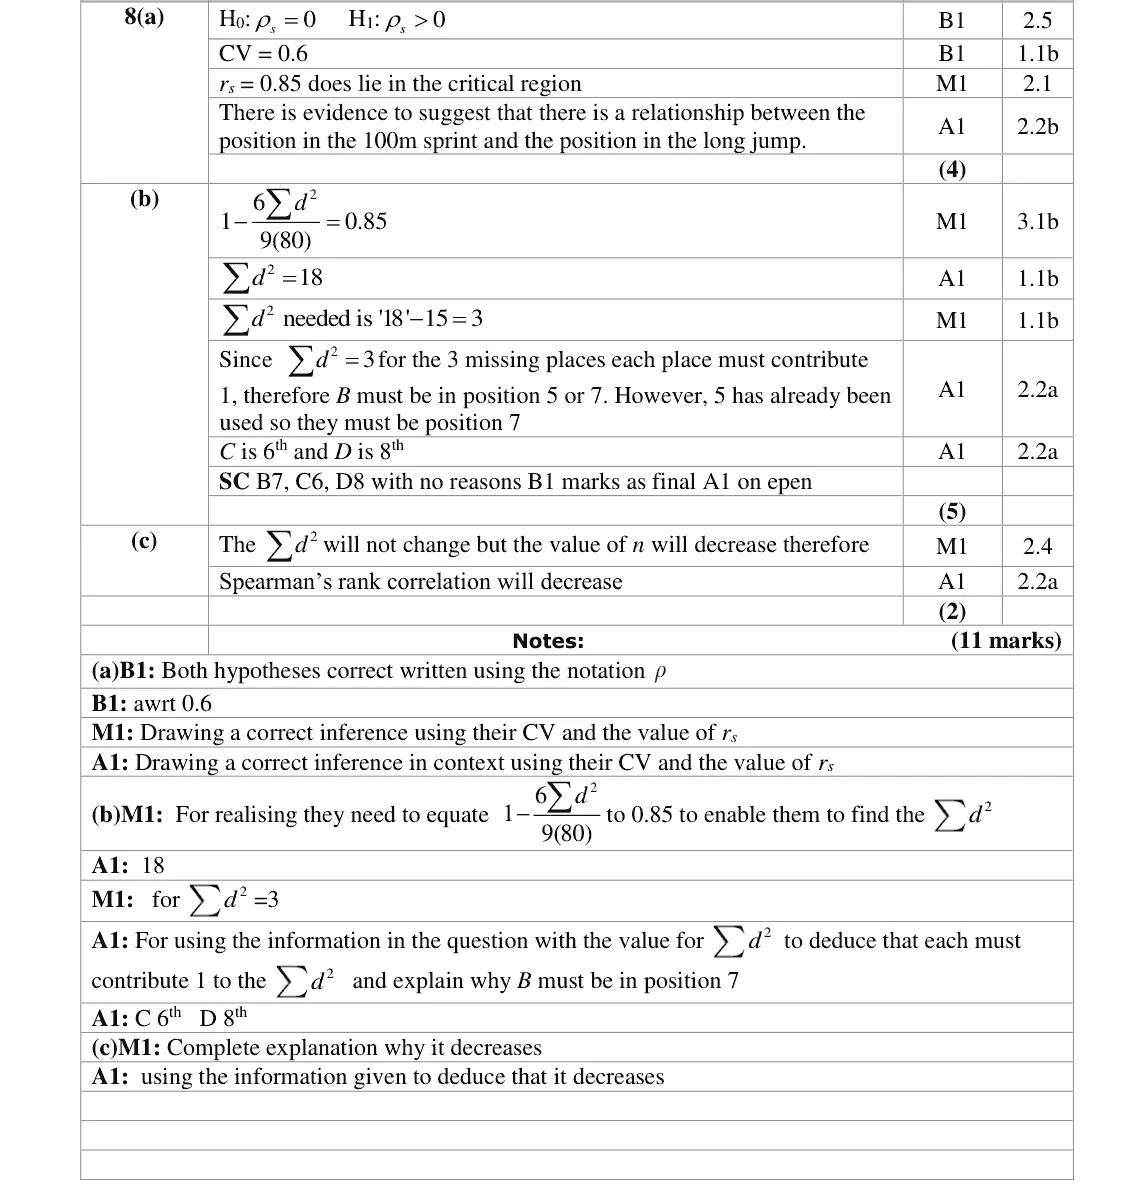
8 Nine athletes, A, B, C, D, E, F, G, H and I, competed in both the 100 m sprint and the long jump. After the two events the positions of each athlete were recorded and Spearman’s rank correlation coefficient was calculated and found to be 0.85 (a) Stating your hypotheses clearly, test whether or not there is evidence to suggest that the higher an athlete’s position is in the 100 m sprint, the higher their position is in the long jump. Use a 5% level of significance. (4)
June 2019 · Paper 4B (Further Statistics 2) · Q8(b) 5 marks correlation fs2
The piece of paper the positions were recorded on was mislaid. Although some of the athletes agreed their positions, there was some disagreement between athletes B, C and D over their long jump results. The table shows the results that are agreed to be correct. Athlete A B C E F G H , Position in 100 m sprint Position in long jump Given that there were no tied ranks, (b) find the correct positions of athletes B, C and D in the long jump. You must show your working clearly and give reasons for your answers. (5)
June 2019 · Paper 4B (Further Statistics 2) · Q8(c) 2 marks correlation fs2
(c) Without recalculating the coefficient, explain how Spearman’s rank correlation coefficient would change if athlete H was disqualified from both the 100 m sprint and the long jump. (2)

Find an Edexcel Further Maths tutor

Want this paper marked and gone through with a Further Maths tutor? Message us.

Prefer email? Send an enquiry

If you are under 18, please include a parent's contact details. Enquiries go to enquiries@alevelfurthermathstutor.com and are deleted once handled.