June 2022: A level Paper 4B: Further Statistics 2

75 marks · 23 question parts · Question paper, mark scheme and examiner's report on Pearson's site

Question by question

QTopicMarksDifficulty
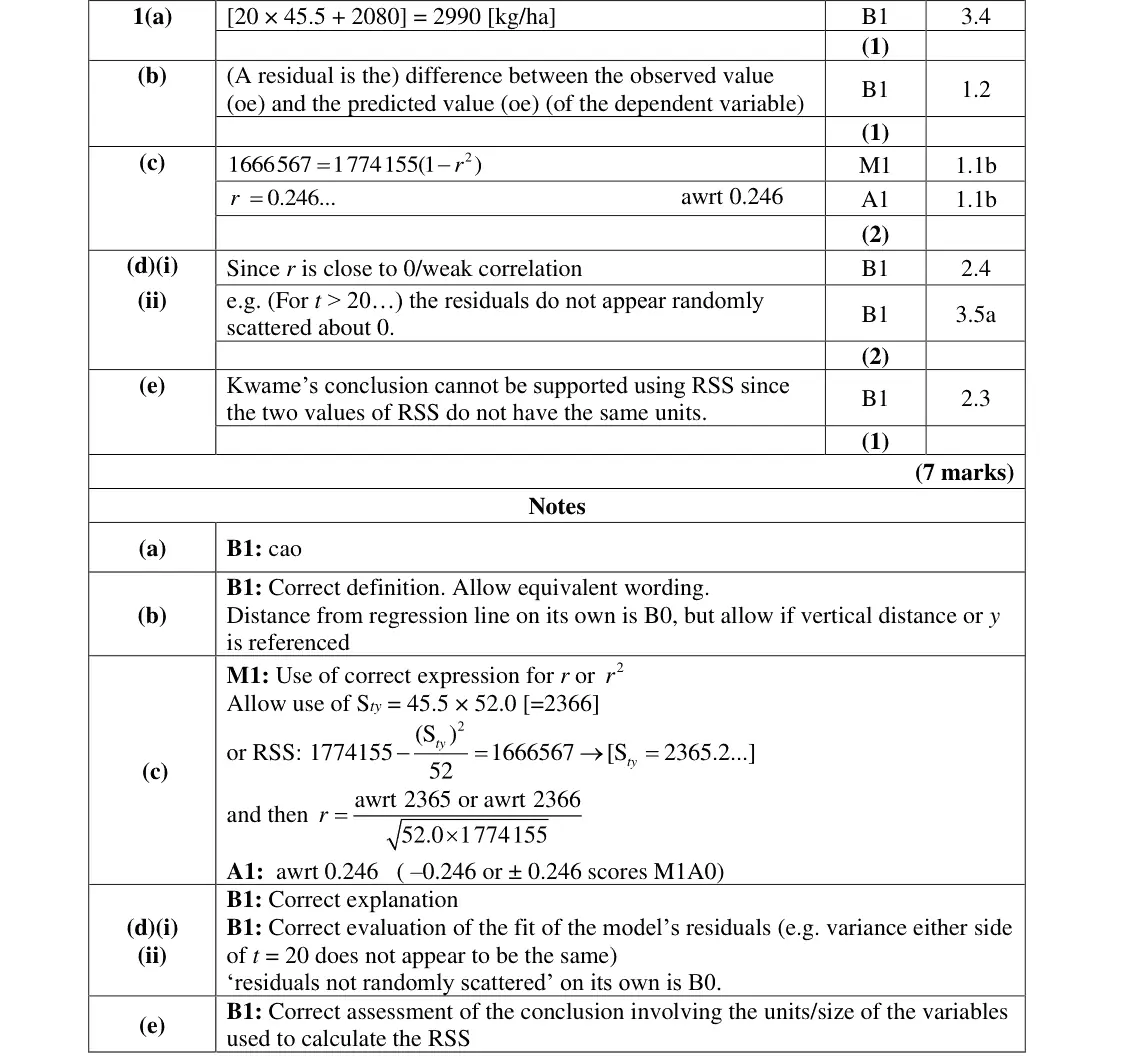
1(a) Linear regression and residuals 1 —
1(b) Linear regression and residuals 1 —
1(c) Correlation: PMCC, Spearman's rank and tests, Linear regression and residuals 2 —
1(d) Correlation: PMCC, Spearman's rank and tests, Linear regression and residuals 2 —
1(e) Linear regression and residuals 1 —
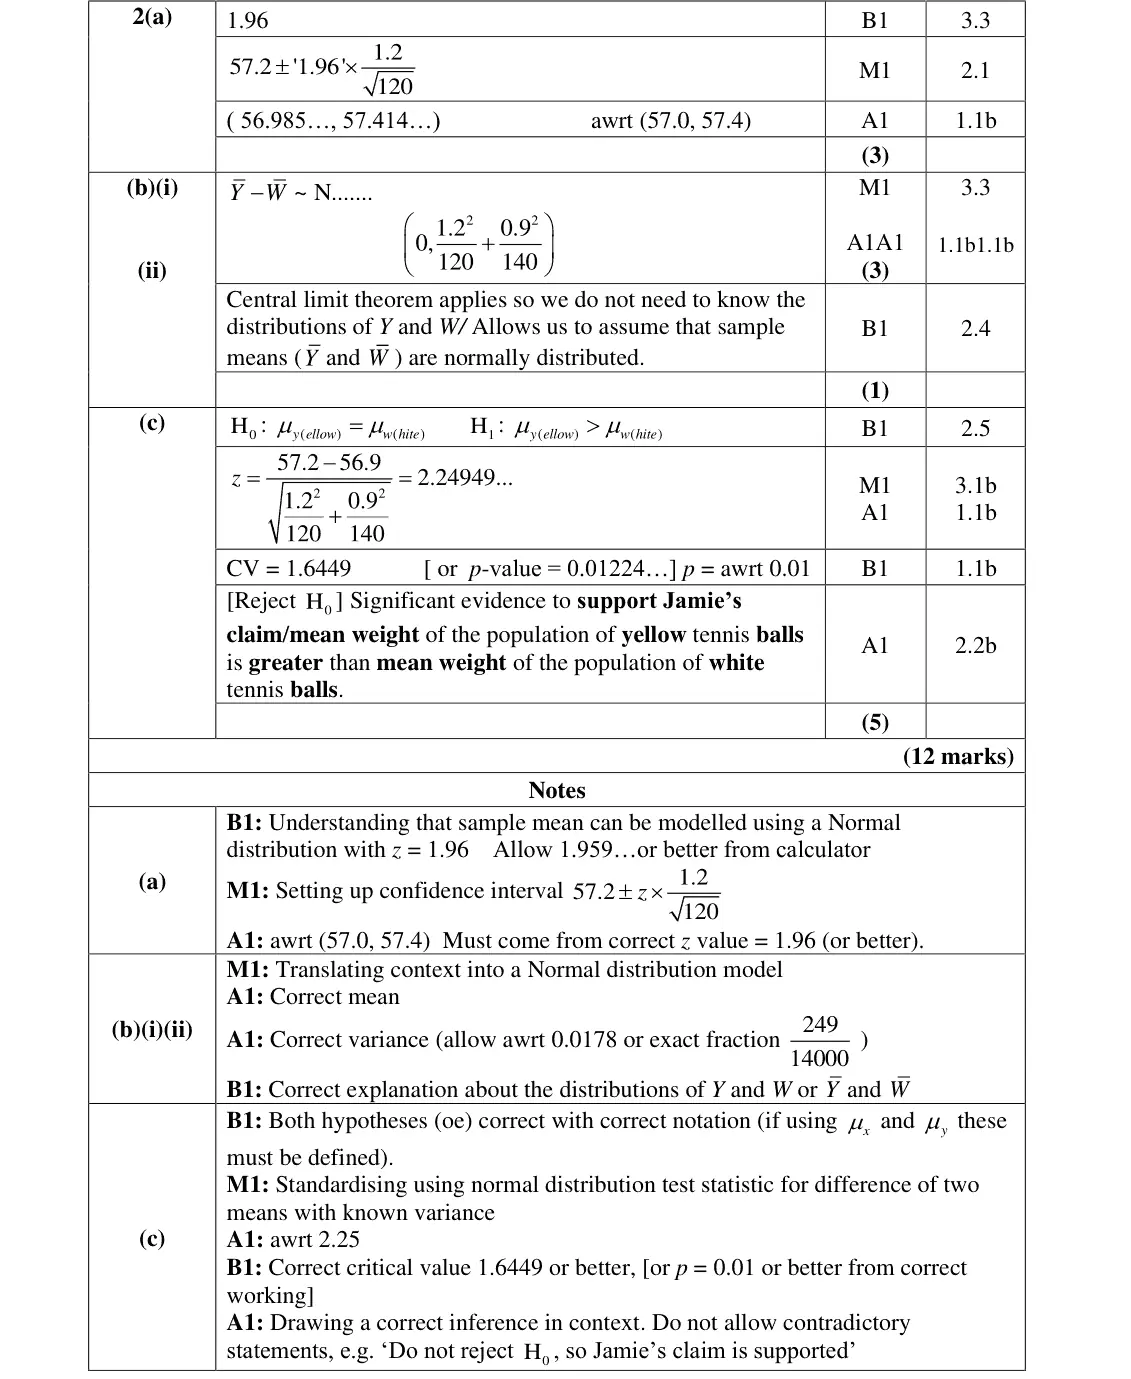
2(a) Estimators, confidence intervals and tests using the normal distribution 3 —
2(b)(i) Estimators, confidence intervals and tests using the normal distribution 3 —
2(b)(ii) Estimators, confidence intervals and tests using the normal distribution 1 —
2(c) Estimators, confidence intervals and tests using the normal distribution 5 —
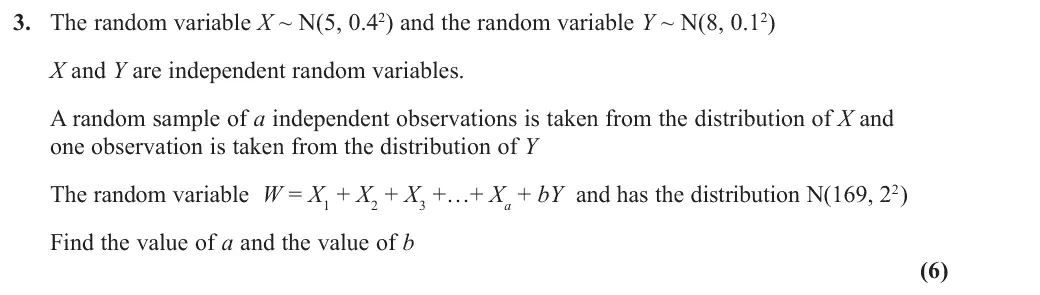
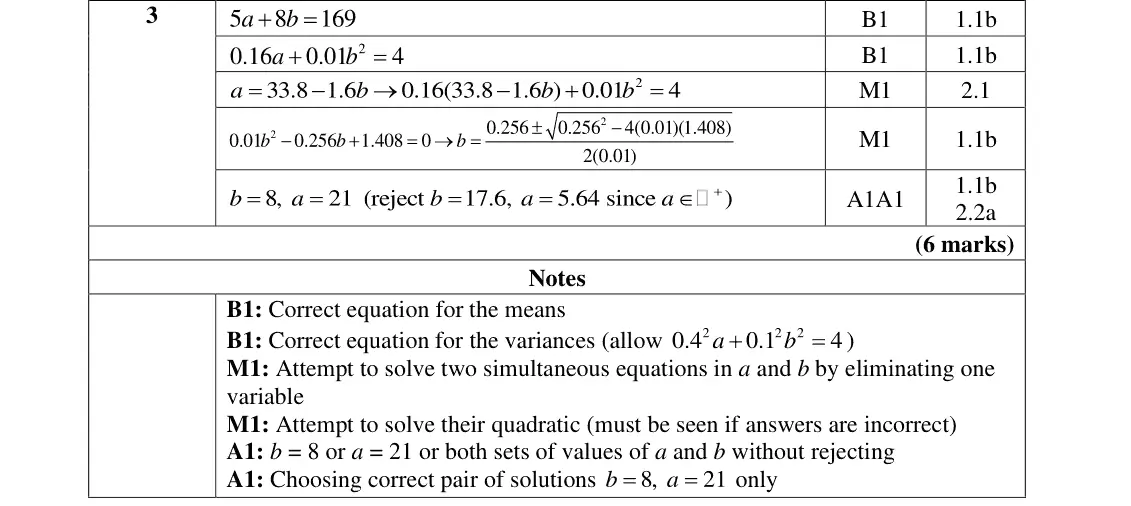
3 Combinations of random variables 6 —
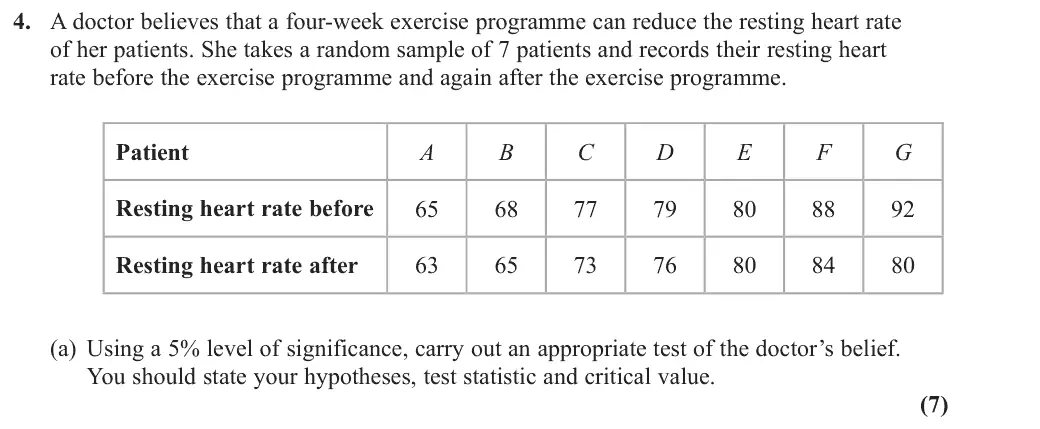
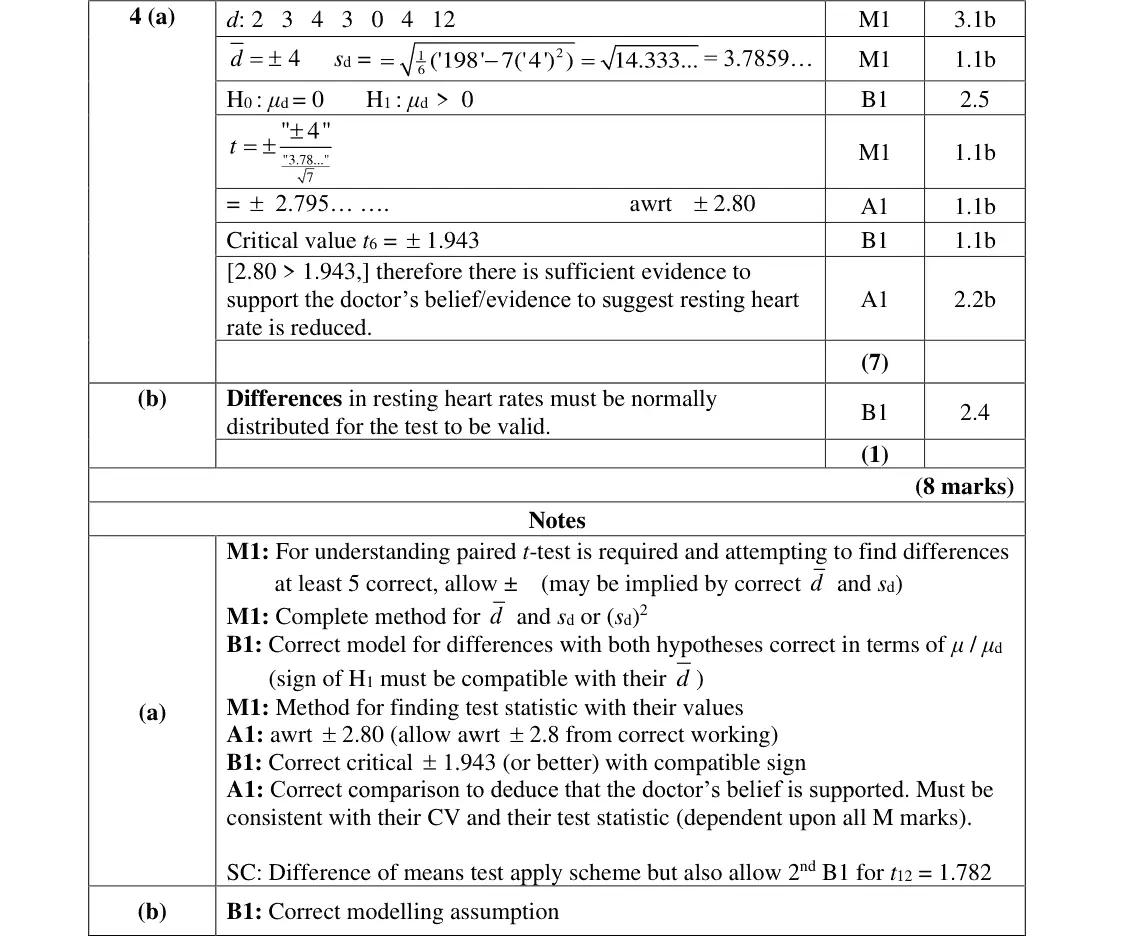
4(a) The t-distribution: t-tests and paired t-tests 7 —
4(b) The t-distribution: t-tests and paired t-tests 1 —
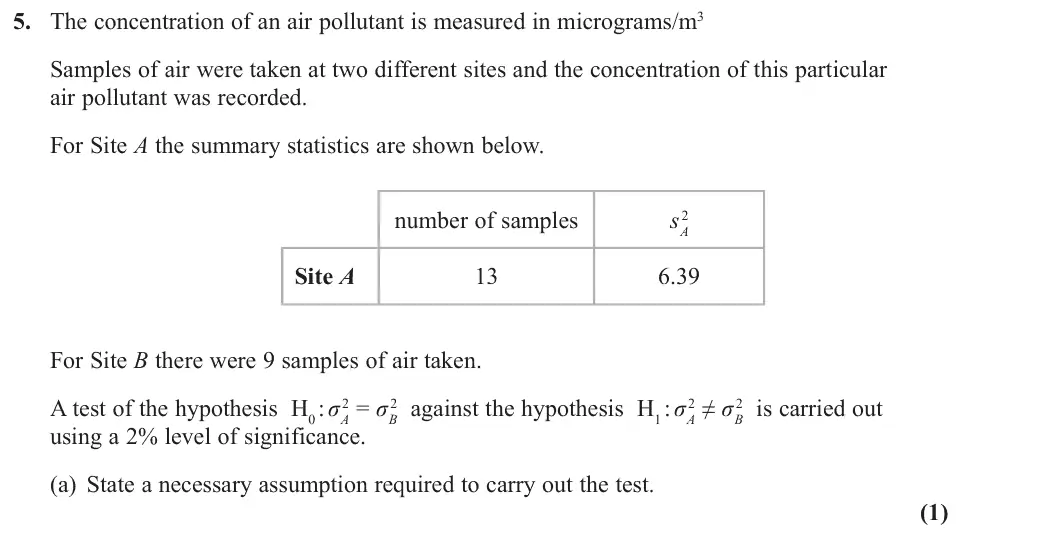
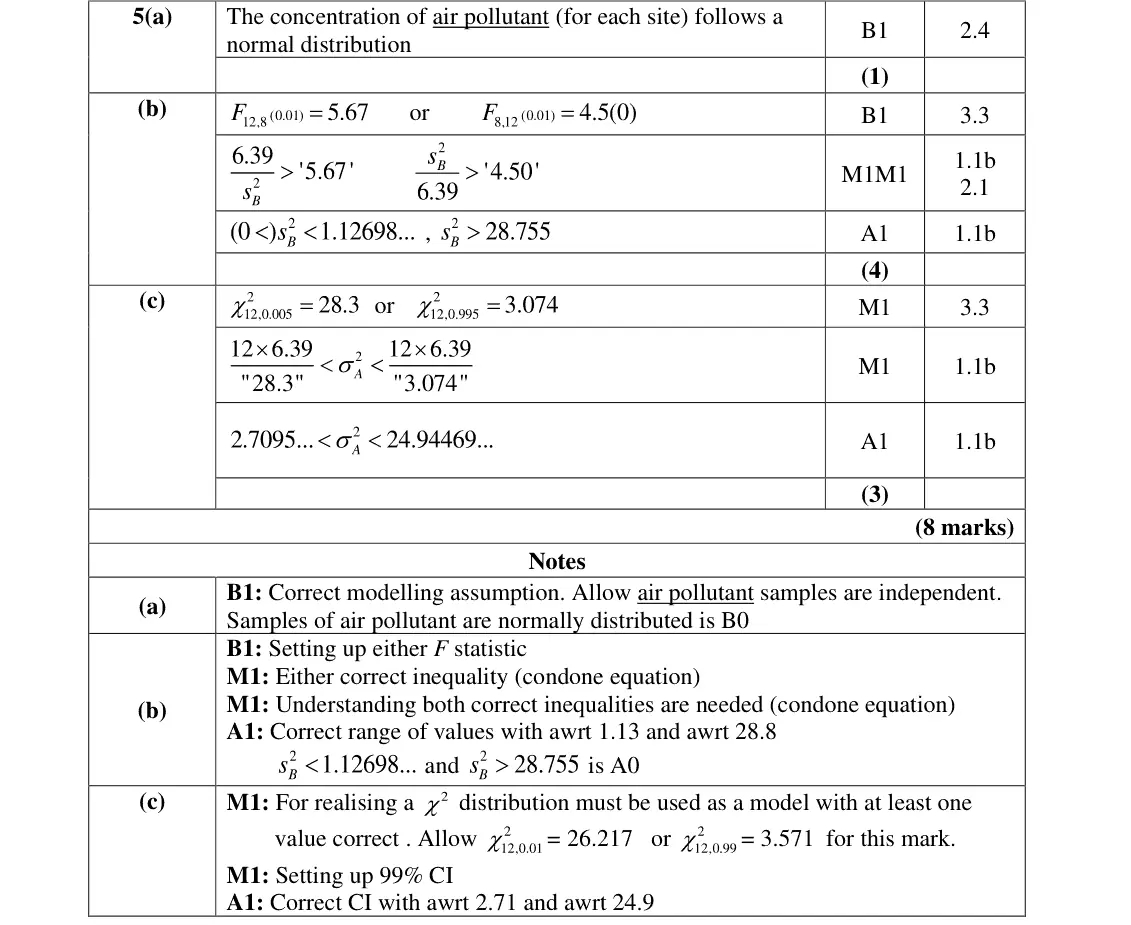
5(a) Variance tests: chi-squared and F-distribution 1 —
5(b) Variance tests: chi-squared and F-distribution 4 —
5(c) Variance tests: chi-squared and F-distribution 3 —
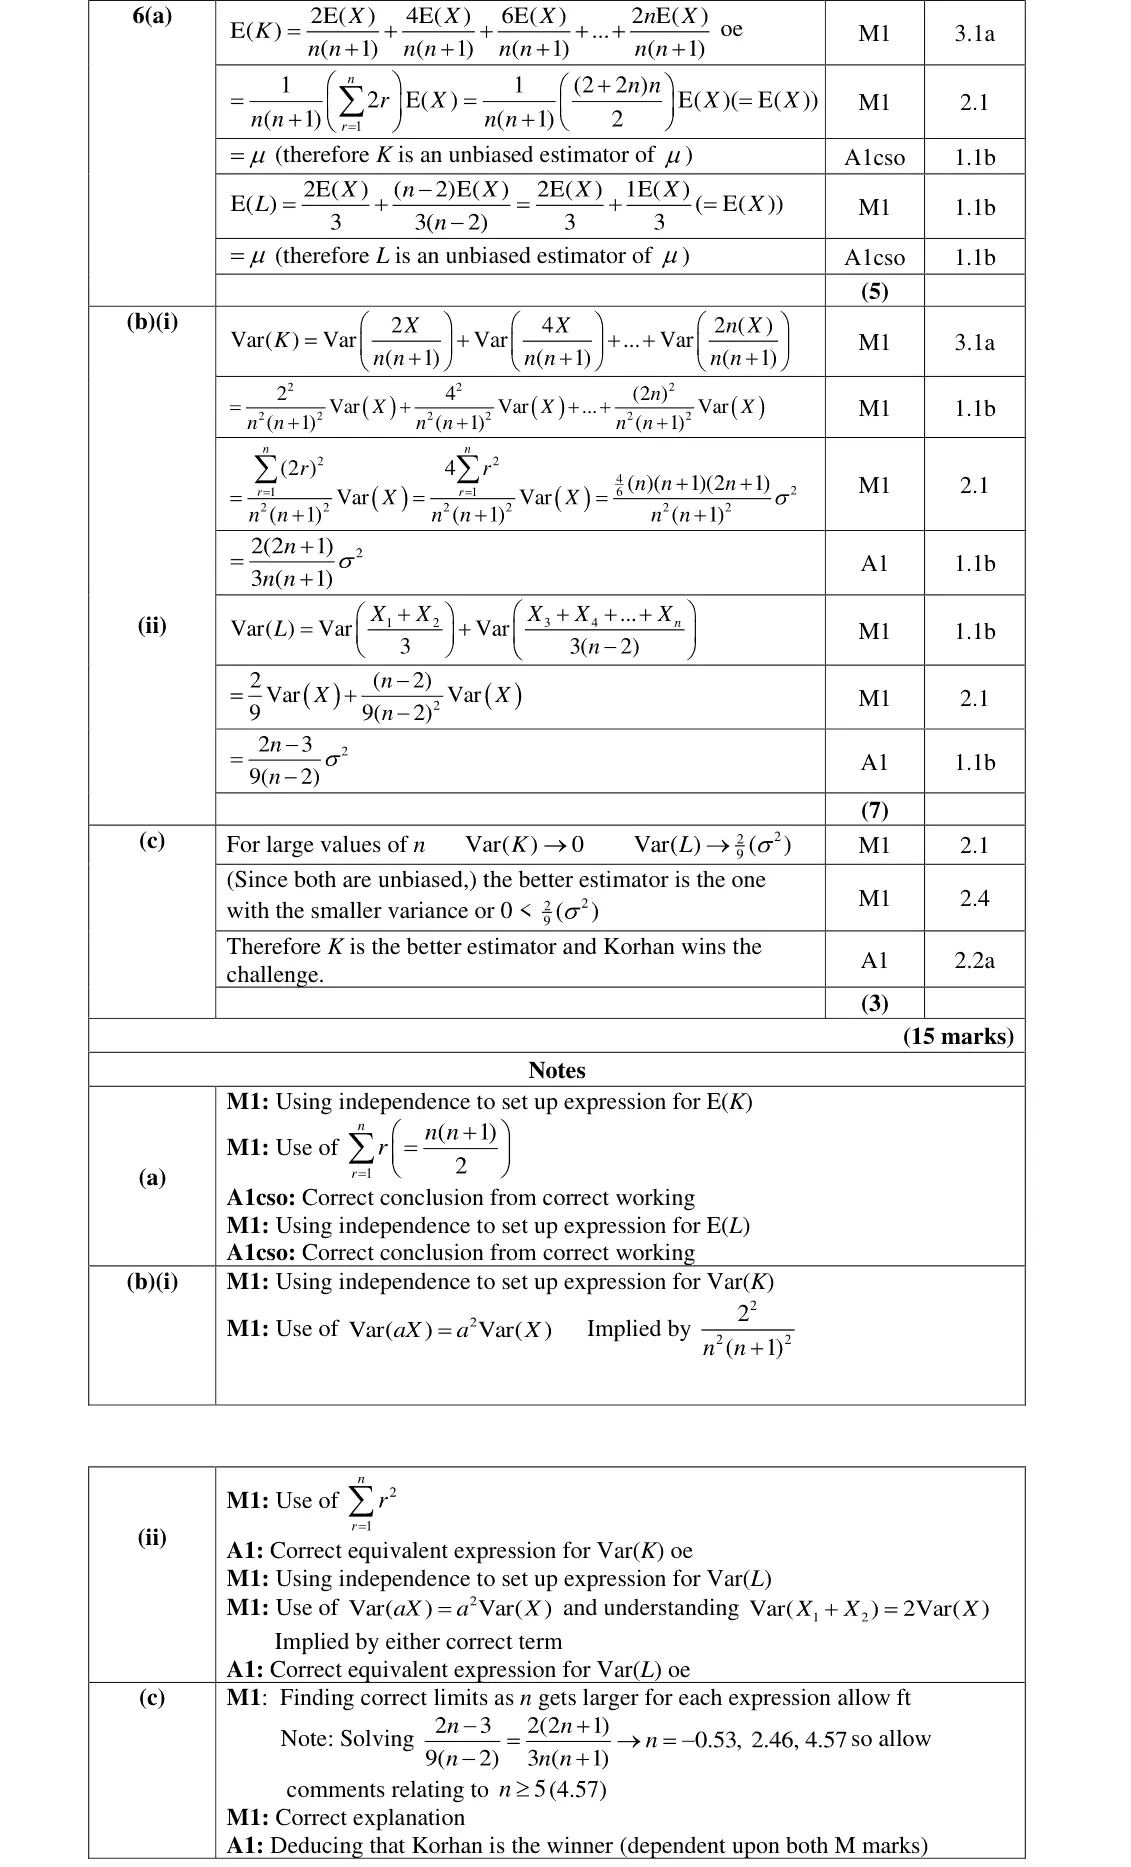
6(a) Estimators, confidence intervals and tests using the normal distribution 5 —
6(b) Estimators, confidence intervals and tests using the normal distribution 7 —
6(c) Estimators, confidence intervals and tests using the normal distribution 3 —
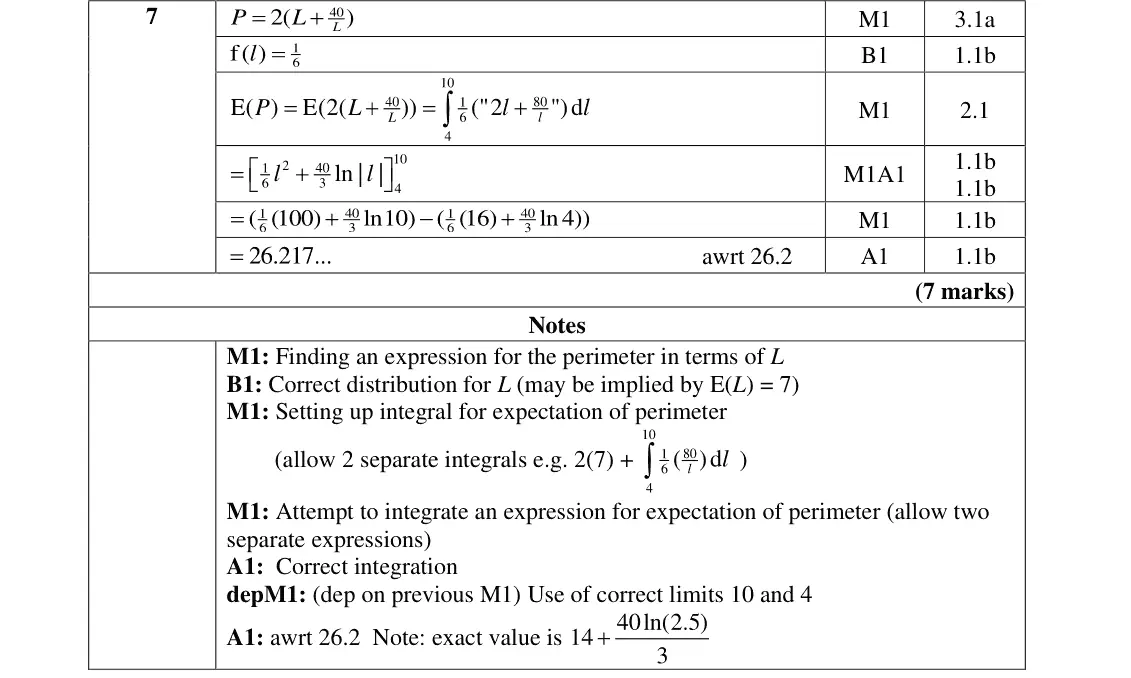
7 Continuous random variables and the uniform distribution 7 —
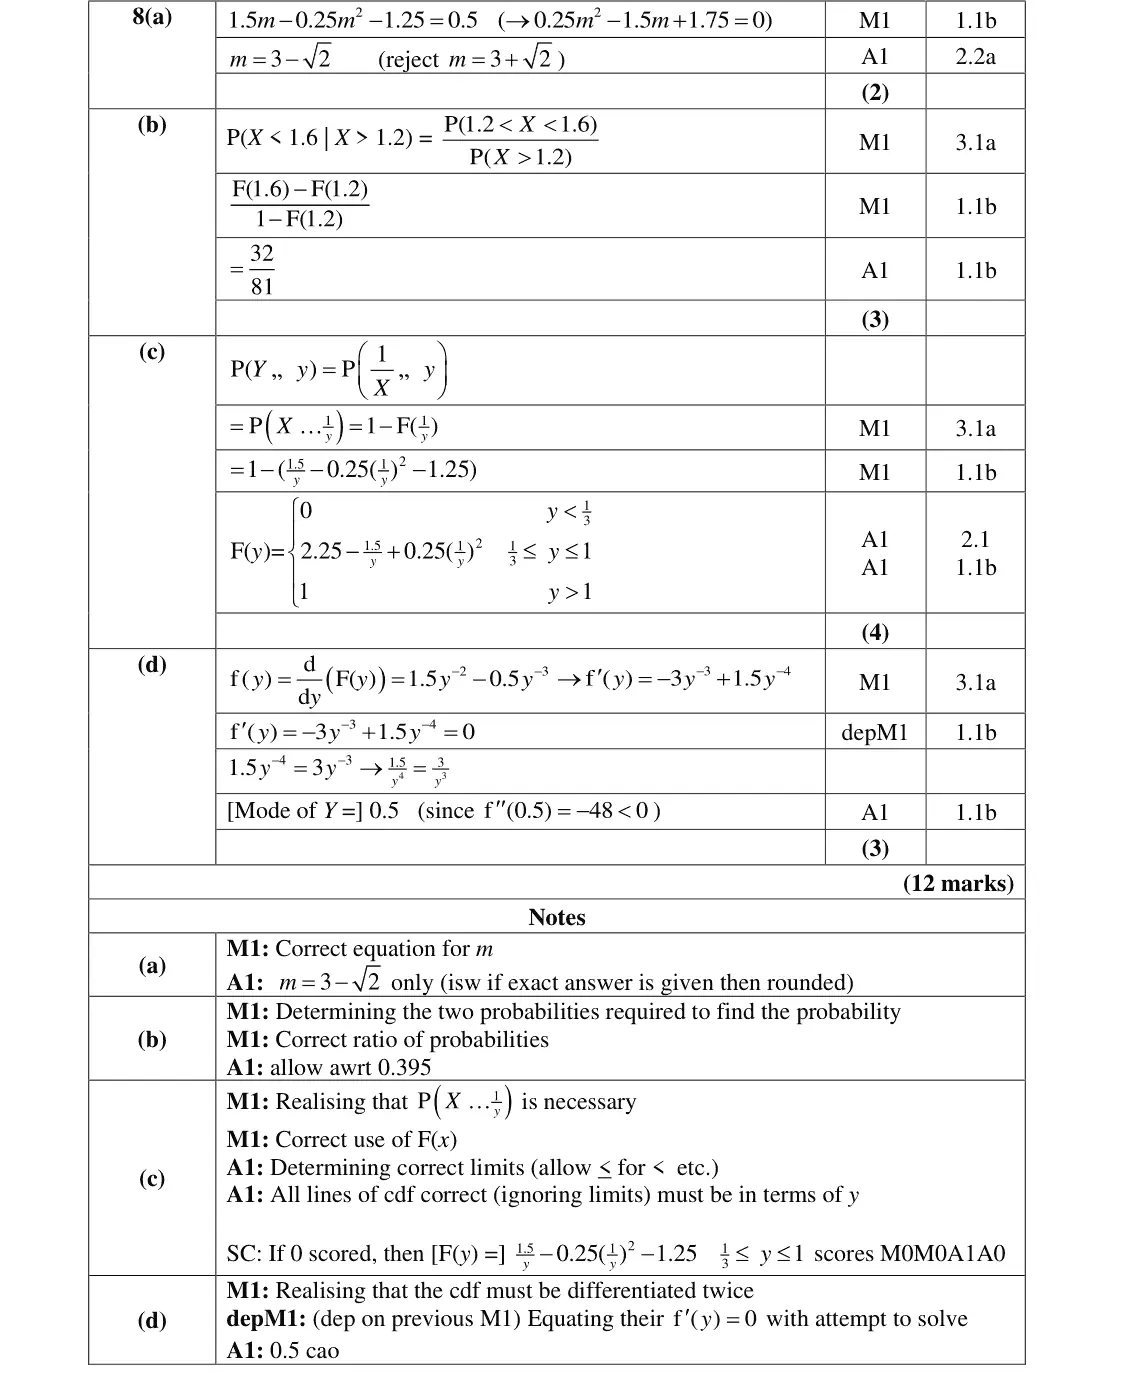
8(a) Continuous random variables and the uniform distribution 2 —
8(b) Continuous random variables and the uniform distribution 3 —
8(c) Continuous random variables and the uniform distribution 4 —
8(d) Continuous random variables and the uniform distribution 3 —

The questions

1(a)1(b)1(c)1(d)1(e)2(a)2(b)(i)2(b)(ii)2(c)34(a)4(b)5(a)5(b)5(c)6(a)6(b)6(c)78(a)8(b)8(c)8(d)
June 2022 · Paper 4B (Further Statistics 2) · Q1(a) 1 mark linear regression
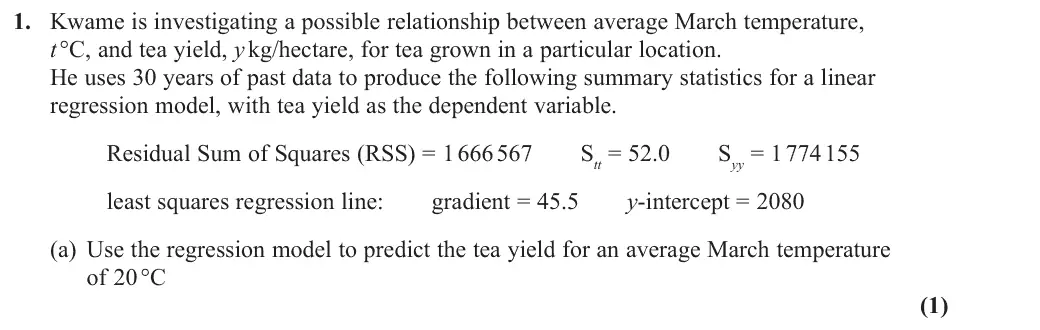
1. Kwame is investigating a possible relationship between average March temperature, t °C, and tea yield, y kg/hectare, for tea grown in a particular location. He uses 30 years of past data to produce the following summary statistics for a linear regression model, with tea yield as the dependent variable. Residual Sum of Squares (RSS) = 1 666 567 Stt = 52.0 Syy = 1 774 155 least squares regression line: gradient = 45.5 y-intercept = 2080 (a) Use the regression model to predict the tea yield for an average March temperature of 20 °C (1)
June 2022 · Paper 4B (Further Statistics 2) · Q1(b) 1 mark linear regression
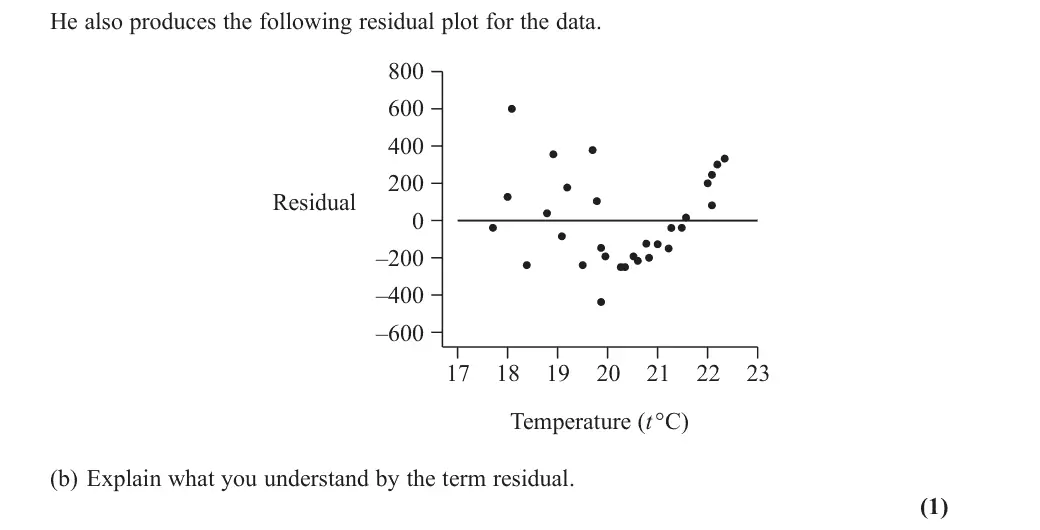
He also produces the following residual plot for the data. Residual –200 –400 –600 Temperature (t °C) (b) Explain what you understand by the term residual. (1)
June 2022 · Paper 4B (Further Statistics 2) · Q1(c) 2 marks correlation fs2linear regression
(c) Calculate the product moment correlation coefficient between t and y (2)
June 2022 · Paper 4B (Further Statistics 2) · Q1(d) 2 marks correlation fs2linear regression
(d) Explain why the linear model may not be a good fit for the data (i) with reference to your answer to part (c) (ii) with reference to the residual plot. (2)
June 2022 · Paper 4B (Further Statistics 2) · Q1(e) 1 mark linear regression
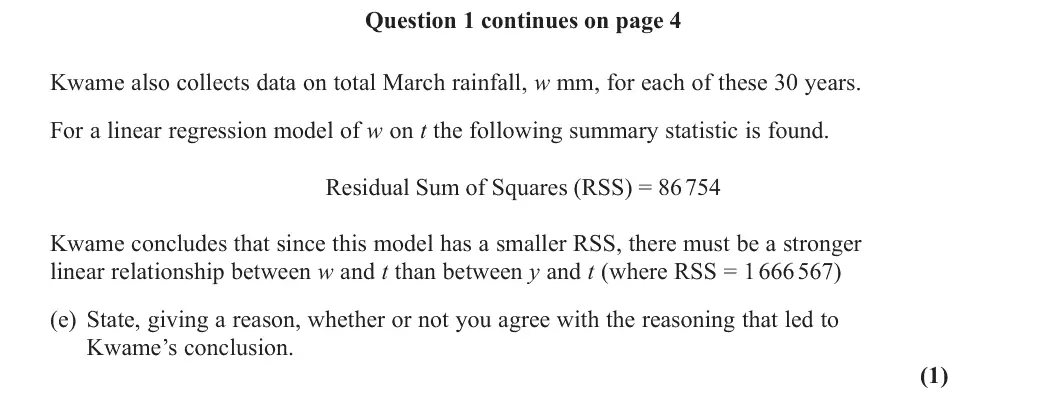
Question 1 continues on page 4 Kwame also collects data on total March rainfall, w mm, for each of these 30 years. For a linear regression model of w on t the following summary statistic is found. Residual Sum of Squares (RSS) = 86 754 Kwame concludes that since this model has a smaller RSS, there must be a stronger linear relationship between w and t than between y and t (where RSS = 1 666 567) (e) State, giving a reason, whether or not you agree with the reasoning that led to Kwame’s conclusion. (1)
June 2022 · Paper 4B (Further Statistics 2) · Q2(a) 3 marks estimation and confidence intervals
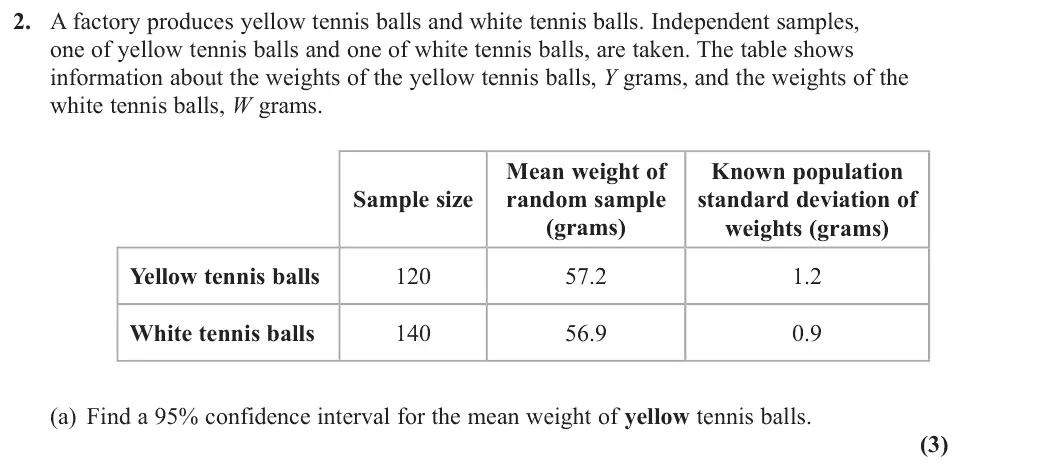
2. A factory produces yellow tennis balls and white tennis balls. Independent samples, one of yellow tennis balls and one of white tennis balls, are taken. The table shows information about the weights of the yellow tennis balls, Y grams, and the weights of the white tennis balls, W grams. Mean weight of Known population Sample size random sample standard deviation of (grams) weights (grams) Yellow tennis balls 57.2 1.2 White tennis balls 56.9 0.9 (a) Find a 95% confidence interval for the mean weight of yellow tennis balls. (3)
June 2022 · Paper 4B (Further Statistics 2) · Q2(b)(i) 3 marks estimation and confidence intervals
Jamie claims that the mean weight of the population of yellow tennis balls is greater than the mean weight of the population of white tennis balls. A test of Jamie’s claim is carried out. (b) (i) Specify the approximate distribution of Y– – W– under the null hypothesis of the test. (3)
June 2022 · Paper 4B (Further Statistics 2) · Q2(b)(ii) 1 mark estimation and confidence intervals
(ii) Explain the relevance of the large sample sizes to your answer to part (i). (1)
June 2022 · Paper 4B (Further Statistics 2) · Q2(c) 5 marks estimation and confidence intervals
(c) Complete the hypothesis test using a 5% level of significance. You should state your hypotheses and the value of your test statistic clearly. (5)
June 2022 · Paper 4B (Further Statistics 2) · Q3 6 marks combinations of random variables
3. The random variable X ~ N(5, 0.42) and the random variable Y ~ N(8, 0.12) X and Y are independent random variables. A random sample of a independent observations is taken from the distribution of X and one observation is taken from the distribution of Y The random variable W = X1 + X2 + X3 +…+ Xa + bY and has the distribution N(169, 22) Find the value of a and the value of b (6)
June 2022 · Paper 4B (Further Statistics 2) · Q4(a) 7 marks t tests
4. A doctor believes that a four-week exercise programme can reduce the resting heart rate of her patients. She takes a random sample of 7 patients and records their resting heart rate before the exercise programme and again after the exercise programme. Patient A B C E F G Resting heart rate before Resting heart rate after (a) Using a 5% level of significance, carry out an appropriate test of the doctor’s belief. You should state your hypotheses, test statistic and critical value. (7)
June 2022 · Paper 4B (Further Statistics 2) · Q4(b) 1 mark t tests
(b) State the assumption made about the resting heart rates that was required to carry out the test. (1)
June 2022 · Paper 4B (Further Statistics 2) · Q5(a) 1 mark chi squared and f tests
5. The concentration of an air pollutant is measured in micrograms/m3 Samples of air were taken at two different sites and the concentration of this particular air pollutant was recorded. For Site A the summary statistics are shown below. number of samples s 2 A Site A 6.39 For Site B there were 9 samples of air taken. A test of the hypothesis H0 : sigma 2 A = sigma 2 B against the hypothesis H1 : sigma 2 A ≠ sigma 2 B is carried out using a 2% level of significance. (a) State a necessary assumption required to carry out the test. (1)
June 2022 · Paper 4B (Further Statistics 2) · Q5(b) 4 marks chi squared and f tests
Given that the assumption in part (a) holds, (b) find the set of values of s 2 B that would lead to the null hypothesis being rejected, (4)
June 2022 · Paper 4B (Further Statistics 2) · Q5(c) 3 marks chi squared and f tests
(c) find a 99% confidence interval for the variance of the concentration of the air pollutant at Site A. (3)
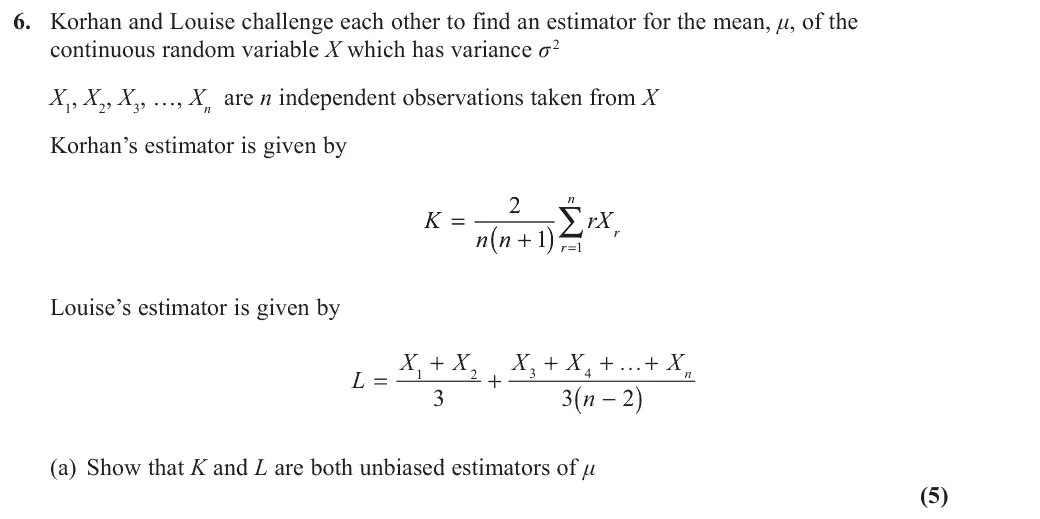
June 2022 · Paper 4B (Further Statistics 2) · Q6(a) 5 marks estimation and confidence intervals
6. Korhan and Louise challenge each other to find an estimator for the mean, μ, of the continuous random variable X which has variance sigma 2 X1, X2, X3, …, Xn are n independent observations taken from X Korhan’s estimator is given by n =∑ K = rX r ( ) n n + r Louise’s estimator is given by X + X X + X + … + X L = + n ( ) n - (a) Show that K and L are both unbiased estimators of μ (5)
June 2022 · Paper 4B (Further Statistics 2) · Q6(b) 7 marks estimation and confidence intervals
(b) (i) Find Var (K) (ii) Find Var (L) (7)
June 2022 · Paper 4B (Further Statistics 2) · Q6(c) 3 marks estimation and confidence intervals
The winner of the challenge is the person who finds the better estimator. (c) Determine the winner of the challenge for large values of n. Give reasons for your answer. (3)
June 2022 · Paper 4B (Further Statistics 2) · Q7 7 marks continuous random variables
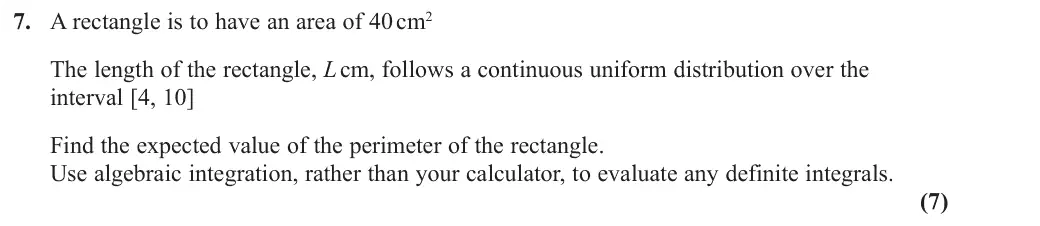
7. A rectangle is to have an area of 40 cm2 The length of the rectangle, L cm, follows a continuous uniform distribution over the interval [4, 10] Find the expected value of the perimeter of the rectangle. Use algebraic integration, rather than your calculator, to evaluate any definite integrals. (7)
June 2022 · Paper 4B (Further Statistics 2) · Q8(a) 2 marks continuous random variables
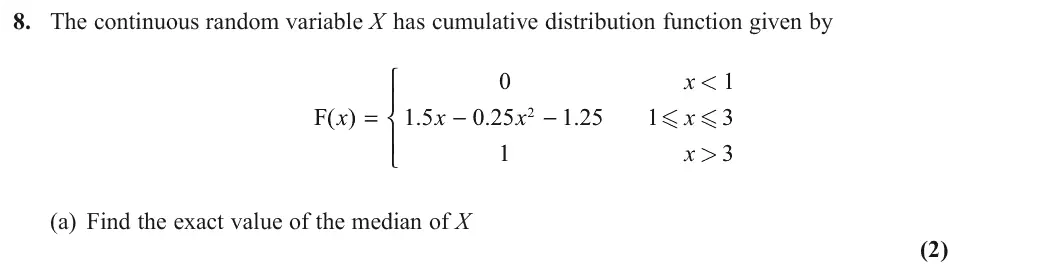
8. The continuous random variable X has cumulative distribution function given by x < F( ) x = 1 5 x - 0 25 x - 1 25 x x > (a) Find the exact value of the median of X (2)
June 2022 · Paper 4B (Further Statistics 2) · Q8(b) 3 marks continuous random variables
(b) Find P (X < 1.6 | X > 1.2) (3)
June 2022 · Paper 4B (Further Statistics 2) · Q8(c) 4 marks continuous random variables
The random variable Y = 1 X (c) Specify fully the cumulative distribution function of Y (4)
June 2022 · Paper 4B (Further Statistics 2) · Q8(d) 3 marks continuous random variables
(d) Hence or otherwise find the mode of Y (3)

Find an Edexcel Further Maths tutor

Want this paper marked and gone through with a Further Maths tutor? Message us.

Prefer email? Send an enquiry

If you are under 18, please include a parent's contact details. Enquiries go to enquiries@alevelfurthermathstutor.com and are deleted once handled.