June 2025: A level Paper 4B: Further Statistics 2

75 marks · 24 question parts · Question paper, mark scheme and examiner's report on Pearson's site

Question by question

QTopicMarksDifficulty
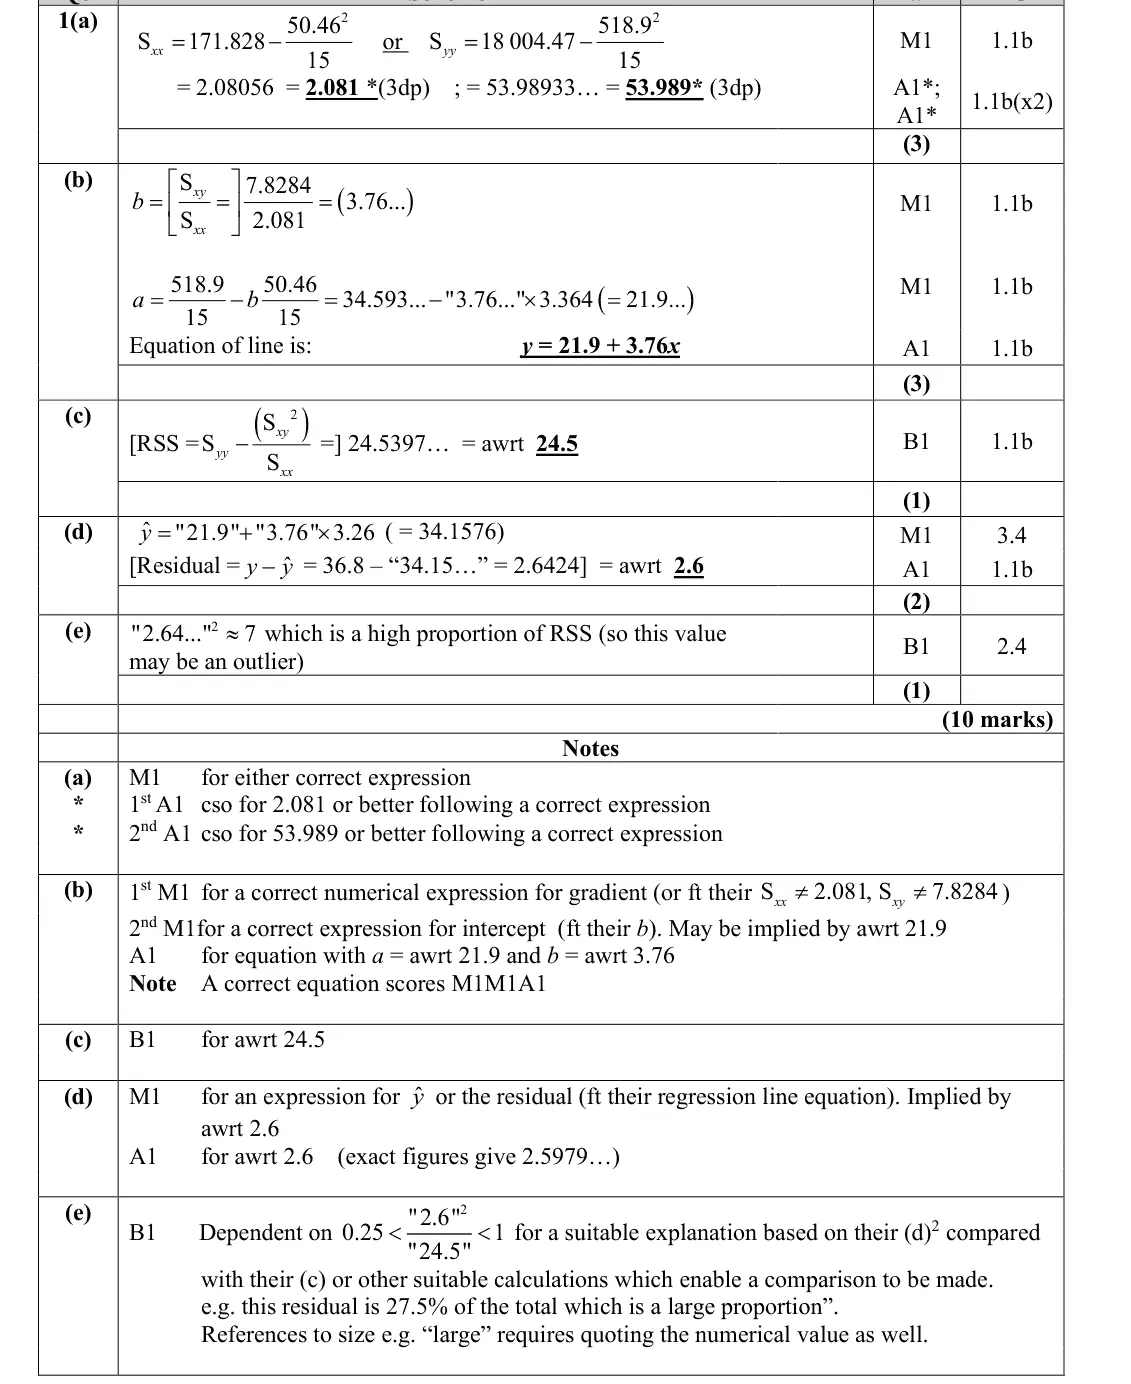
1(a) Linear regression and residuals 3 —
1(b) Linear regression and residuals 3 —
1(c) Linear regression and residuals 1 —
1(d) Linear regression and residuals 2 —
1(e) Linear regression and residuals 1 —
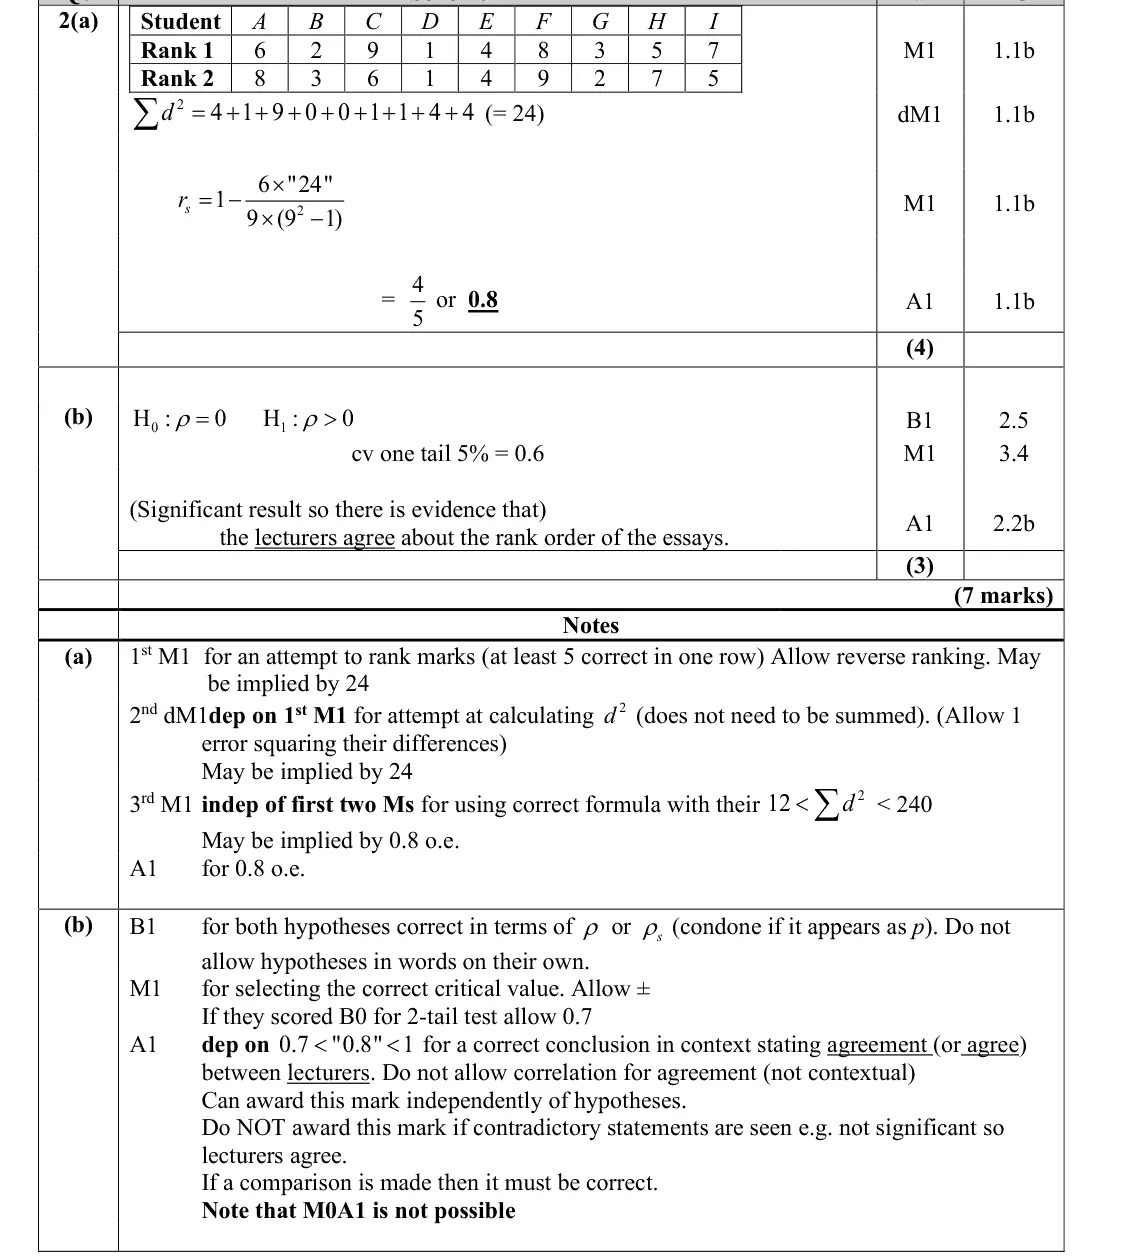
2(a) Correlation: PMCC, Spearman's rank and tests 4 —
2(b) Correlation: PMCC, Spearman's rank and tests 3 —
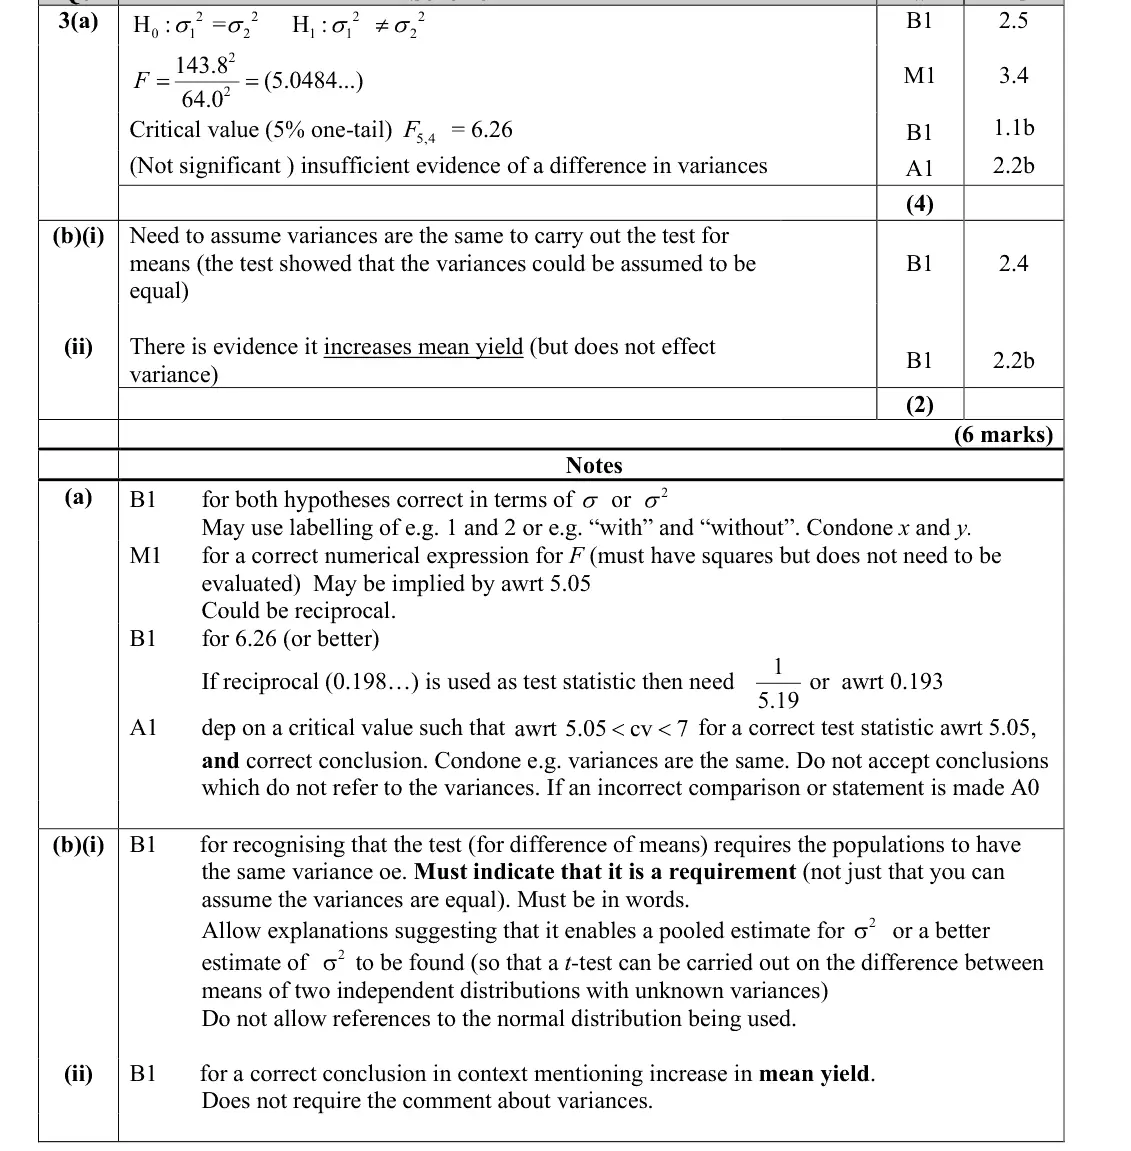
3(a) Variance tests: chi-squared and F-distribution 4 —
3(b) The t-distribution: t-tests and paired t-tests, Variance tests: chi-squared and F-distribution 2 —
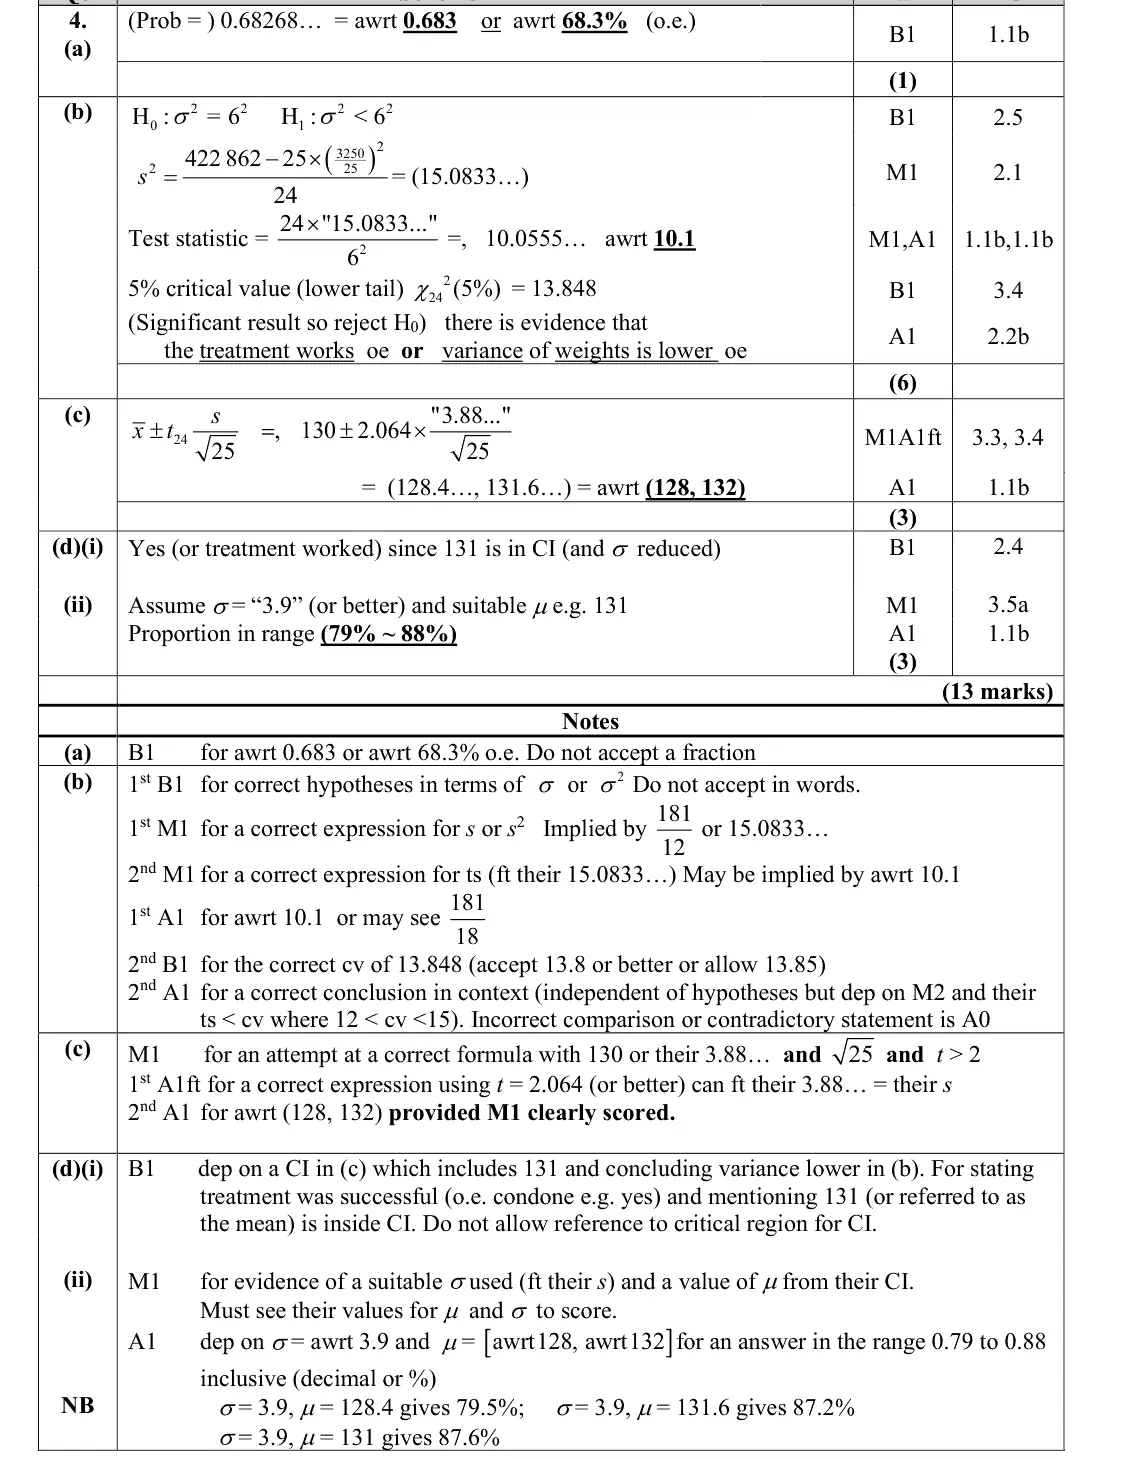
4(a) Variance tests: chi-squared and F-distribution 1 —
4(b) Variance tests: chi-squared and F-distribution 6 —
4(c) The t-distribution: t-tests and paired t-tests 3 —
4(d) Estimators, confidence intervals and tests using the normal distribution, Variance tests: chi-squared and F-distribution 3 —
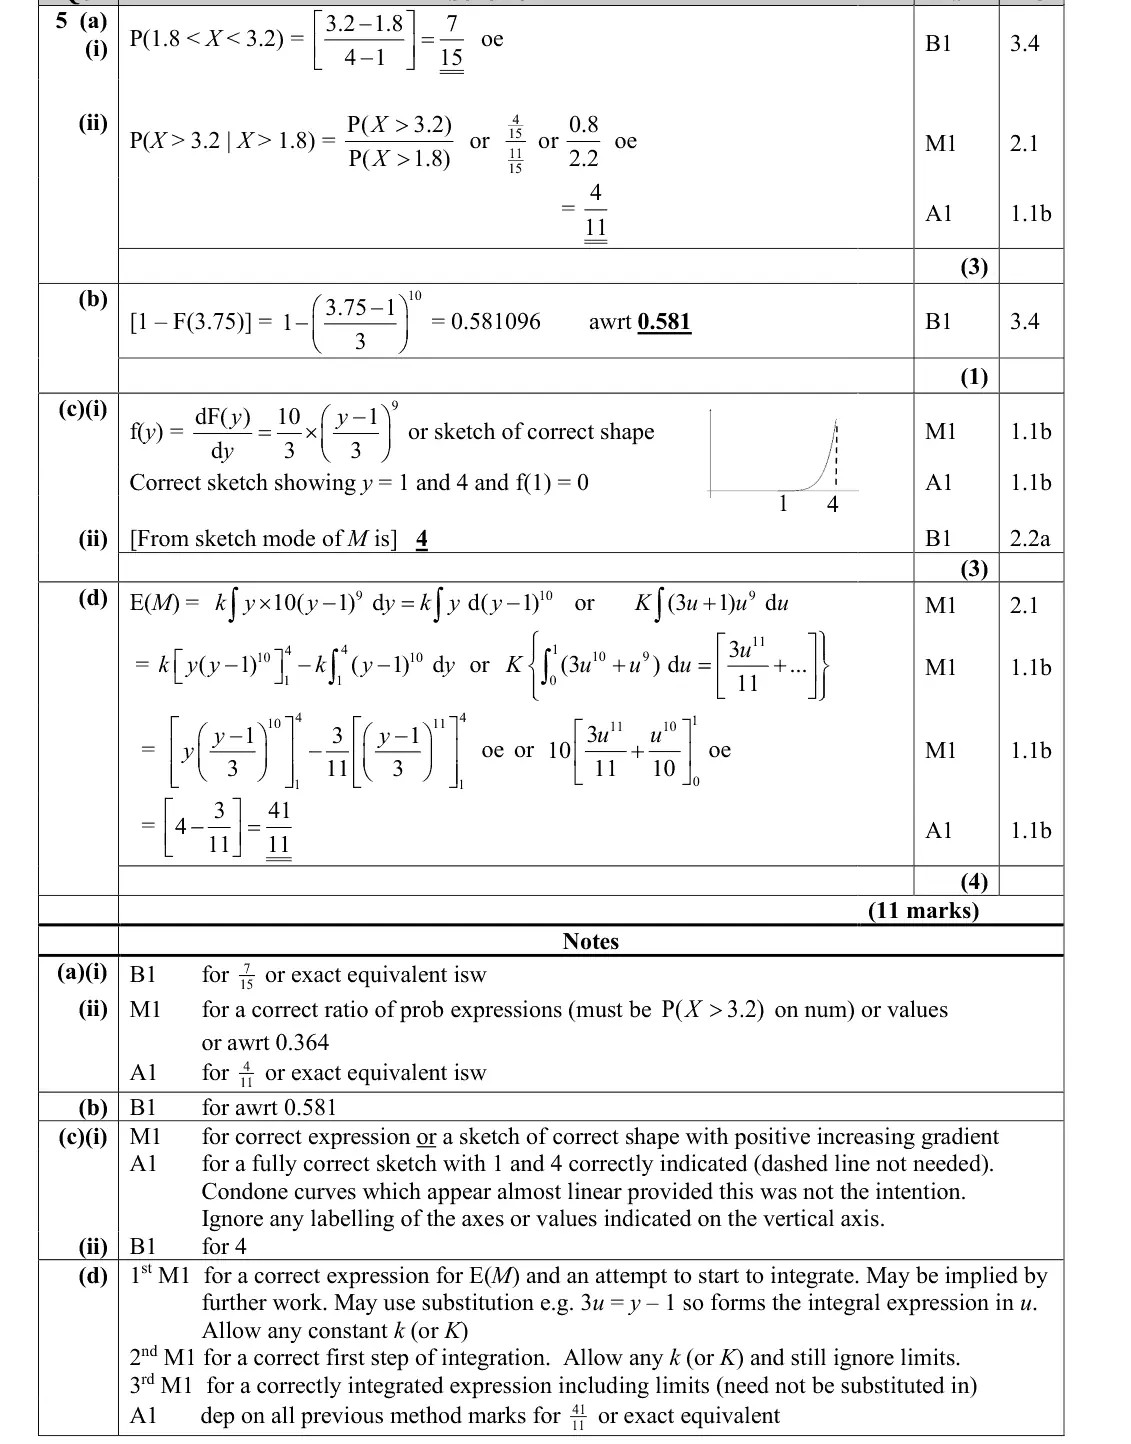
5(a) Continuous random variables and the uniform distribution 3 —
5(b) Continuous random variables and the uniform distribution 1 —
5(c) Continuous random variables and the uniform distribution 3 —
5(d) Continuous random variables and the uniform distribution 4 —
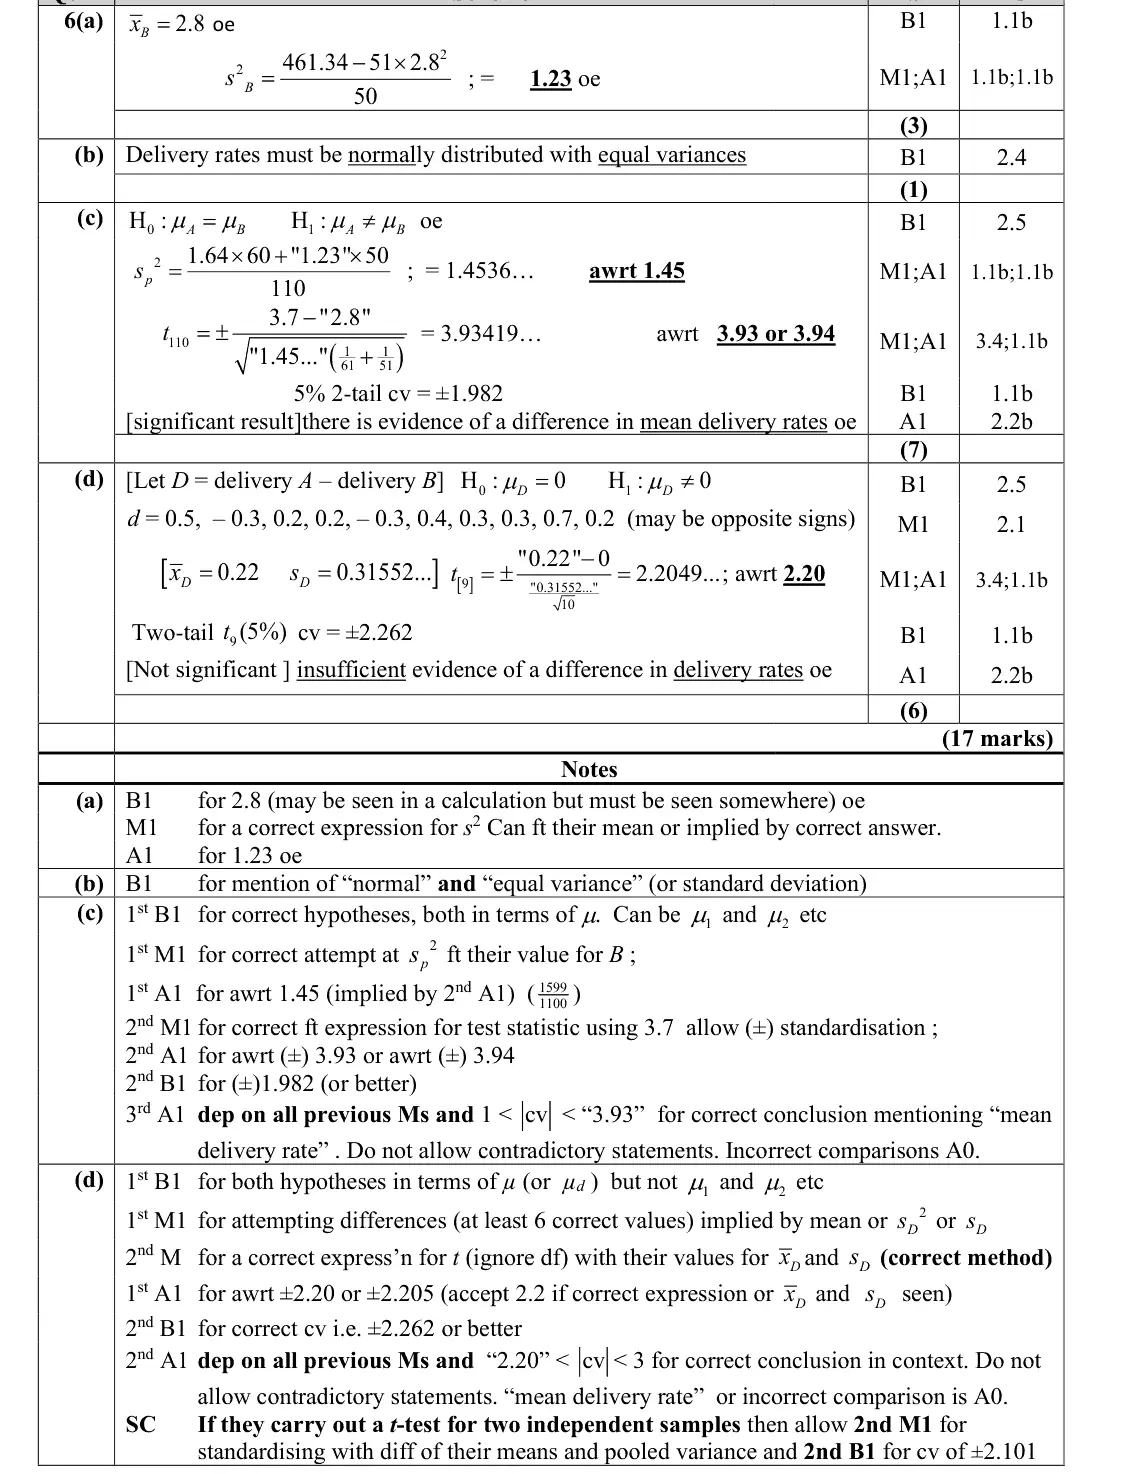
6(a) Estimators, confidence intervals and tests using the normal distribution 3 —
6(b) The t-distribution: t-tests and paired t-tests 1 —
6(c) The t-distribution: t-tests and paired t-tests 7 —
6(d) The t-distribution: t-tests and paired t-tests 6 —
7(a) Combinations of random variables, Estimators, confidence intervals and tests using the normal distribution 7 —
7(b) Estimators, confidence intervals and tests using the normal distribution 1 —
7(c) Estimators, confidence intervals and tests using the normal distribution 3 —

The questions

1(a)1(b)1(c)1(d)1(e)2(a)2(b)3(a)3(b)4(a)4(b)4(c)4(d)5(a)5(b)5(c)5(d)6(a)6(b)6(c)6(d)7(a)7(b)7(c)
June 2025 · Paper 4B (Further Statistics 2) · Q1(a) 3 marks linear regression
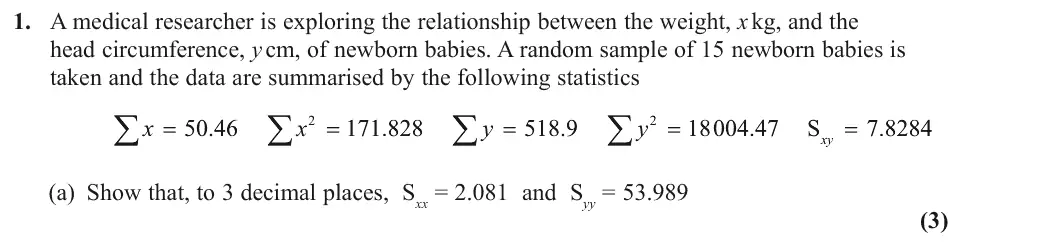
1. A medical researcher is exploring the relationship between the weight, x kg, and the head circumference, y cm, of newborn babies. A random sample of 15 newborn babies is taken and the data are summarised by the following statistics ; ; ; ; x 50 46 x 171 828 y 518 9 y 18004 47 S 7 8284 xy (a) Show that, to 3 decimal places, Sxx = 2.081 and Syy = 53.989 (3)
June 2025 · Paper 4B (Further Statistics 2) · Q1(b) 3 marks linear regression
(b) Find the equation of the regression line of y on x, giving your answer in the form y = a + bx (3)
June 2025 · Paper 4B (Further Statistics 2) · Q1(c) 1 mark linear regression
(c) Find the residual sum of squares (RSS) for these data. (1)
June 2025 · Paper 4B (Further Statistics 2) · Q1(d) 2 marks linear regression
One of these 15 babies had a birth weight of 3.26 kg and a head circumference of 36.8 cm (d) Find the residual for this baby. (2)
June 2025 · Paper 4B (Further Statistics 2) · Q1(e) 1 mark linear regression
The researcher claims that this baby could be an outlier. (e) Using your answers to part (c) and part (d), give a reason that might support this claim. (1)
June 2025 · Paper 4B (Further Statistics 2) · Q2(a) 4 marks correlation fs2
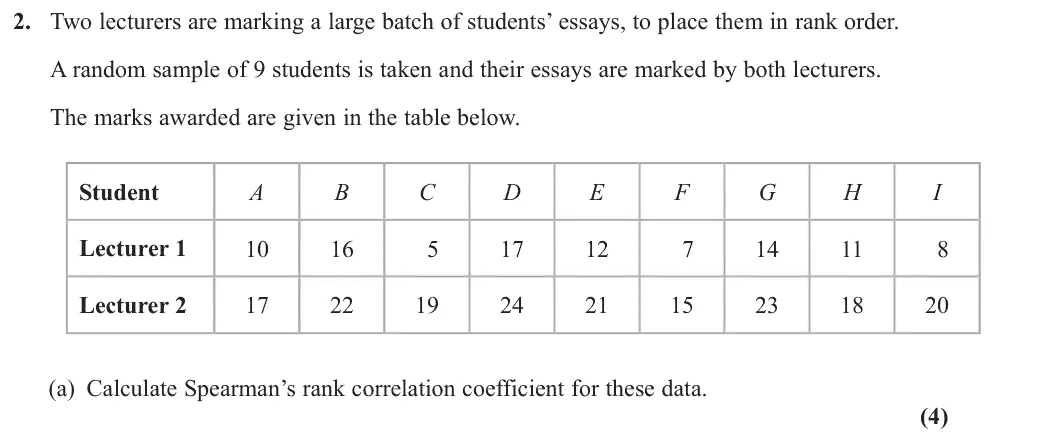
2. Two lecturers are marking a large batch of students’ essays, to place them in rank order. A random sample of 9 students is taken and their essays are marked by both lecturers. The marks awarded are given in the table below. Student A B C E F G H I Lecturer 1 Lecturer 2 (a) Calculate Spearman’s rank correlation coefficient for these data. (4)
June 2025 · Paper 4B (Further Statistics 2) · Q2(b) 3 marks correlation fs2
(b) Carry out a suitable test to assess whether the lecturers agree about the rank order of the essays. You should use a 5% level of significance and state your hypotheses and critical value clearly. (3)
June 2025 · Paper 4B (Further Statistics 2) · Q3(a) 4 marks chi squared and f tests
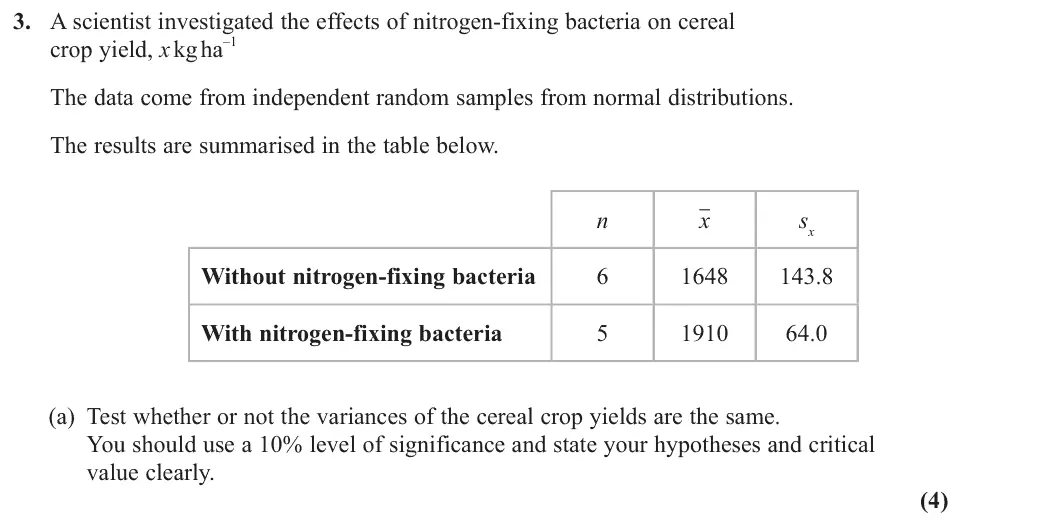
3. A scientist investigated the effects of nitrogen-fixing bacteria on cereal crop yield, x kg ha –1 The data come from independent random samples from normal distributions. The results are summarised in the table below. n x sx Without nitrogen-fixing bacteria 1648 143.8 With nitrogen-fixing bacteria 1910 64.0 (a) Test whether or not the variances of the cereal crop yields are the same. You should use a 10% level of significance and state your hypotheses and critical value clearly. (4)
June 2025 · Paper 4B (Further Statistics 2) · Q3(b) 2 marks t testschi squared and f tests
A suitable test to determine whether there is an increase in mean cereal crop yield has a p-value of 0.002 (b) (i) Explain the importance of the conclusion of the test in part (a) to this test. (ii) Comment on the effectiveness of nitrogen-fixing bacteria on cereal crop yields. (2)
June 2025 · Paper 4B (Further Statistics 2) · Q4(a) 1 mark chi squared and f tests
4. The weights of apples Sam grows are normally distributed with a mean of 131 g and a standard deviation of 6 g A supermarket will only buy apples with weights in the range 125 g to 137 g (a) Find the proportion of apples Sam grows that the supermarket will buy. (1)
June 2025 · Paper 4B (Further Statistics 2) · Q4(b) 6 marks chi squared and f tests
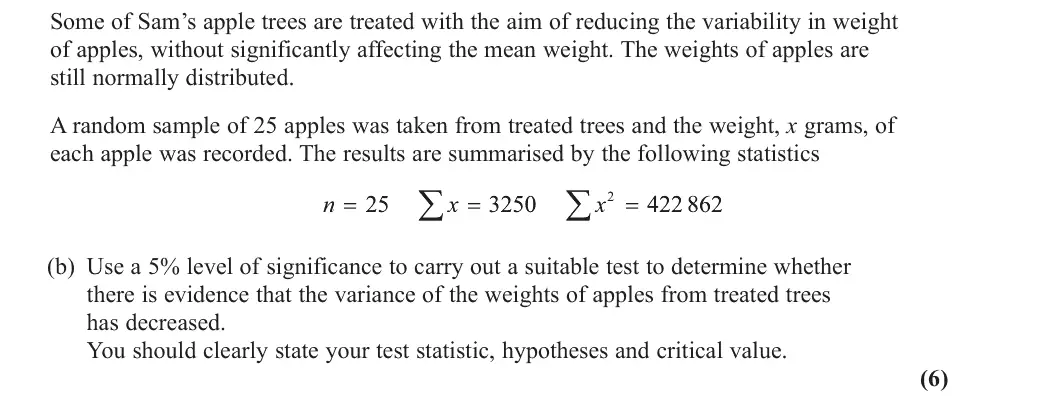
Some of Sam’s apple trees are treated with the aim of reducing the variability in weight of apples, without significantly affecting the mean weight. The weights of apples are still normally distributed. A random sample of 25 apples was taken from treated trees and the weight, x grams, of each apple was recorded. The results are summarised by the following statistics ; ; n x 3250 x 422 862 (b) Use a 5% level of significance to carry out a suitable test to determine whether there is evidence that the variance of the weights of apples from treated trees has decreased. You should clearly state your test statistic, hypotheses and critical value. (6)
June 2025 · Paper 4B (Further Statistics 2) · Q4(c) 3 marks t tests
(c) Calculate a 95% confidence interval for the mean weight of apples produced by Sam’s trees after treatment. You should clearly state the formula and numerical expression you have used. (3)
June 2025 · Paper 4B (Further Statistics 2) · Q4(d) 3 marks estimation and confidence intervalschi squared and f tests
(d) (i) State, giving a reason, whether the aims of the treatment have been met. (ii) Give an estimate of the proportion of apples the supermarket will buy from Sam’s trees that have been treated. (3)
June 2025 · Paper 4B (Further Statistics 2) · Q5(a) 3 marks continuous random variables
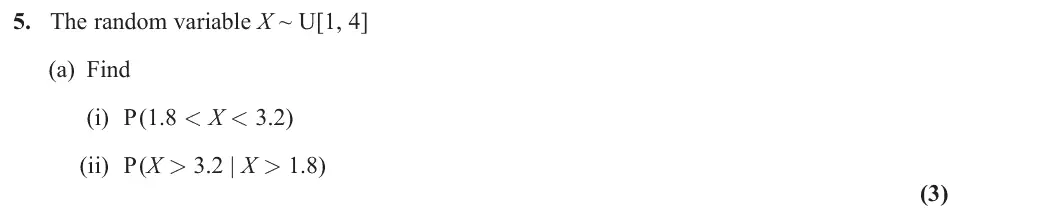
5. The random variable X ~ U[1, 4] (a) Find (i) P (1.8 < X < 3.2) (ii) P (X > 3.2 | X > 1.8) (3)
June 2025 · Paper 4B (Further Statistics 2) · Q5(b) 1 mark continuous random variables
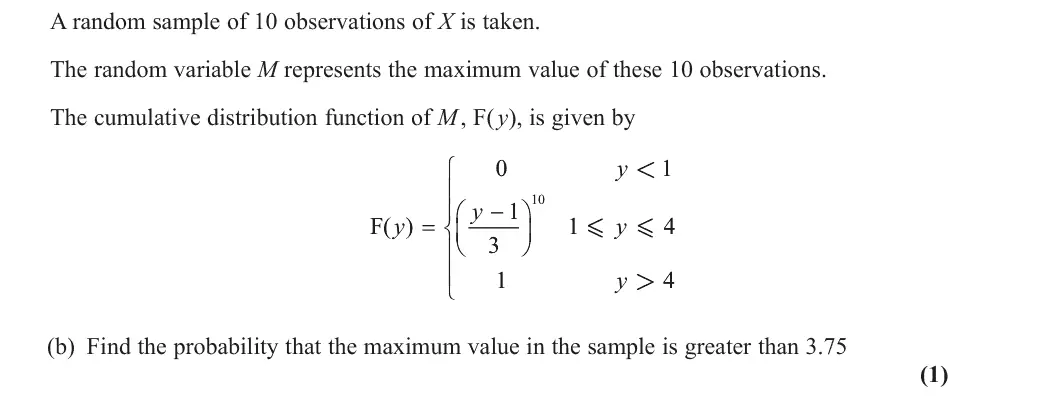
A random sample of 10 observations of X is taken. The random variable M represents the maximum value of these 10 observations. The cumulative distribution function of M , F(y), is given by y < y : F( ) y y y > (b) Find the probability that the maximum value in the sample is greater than 3.75 (1)
June 2025 · Paper 4B (Further Statistics 2) · Q5(c) 3 marks continuous random variables
(c) (i) Sketch the probability density function of M for 1 y 4 (ii) Write down the mode of M (3)
June 2025 · Paper 4B (Further Statistics 2) · Q5(d) 4 marks continuous random variables
(d) Use algebraic integration to find the exact value of E (M) (4)
June 2025 · Paper 4B (Further Statistics 2) · Q6(a) 3 marks estimation and confidence intervals
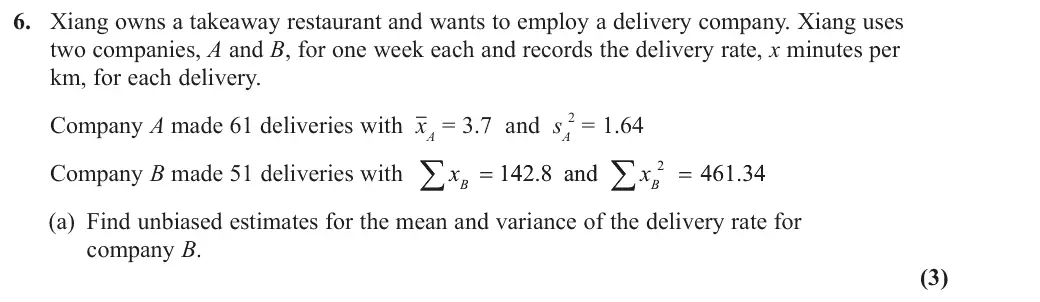
6. Xiang owns a takeaway restaurant and wants to employ a delivery company. Xiang uses two companies, A and B, for one week each and records the delivery rate, x minutes per km, for each delivery. Company A made 61 deliveries with xA = 3.7 and sA 2 = 1.64 ; ; Company B made 51 deliveries with x x 142 8 and 461 34 B B (a) Find unbiased estimates for the mean and variance of the delivery rate for company B. (3)
June 2025 · Paper 4B (Further Statistics 2) · Q6(b) 1 mark t tests
Xiang wants to carry out a two-sample t-test to determine whether there is a difference in the mean delivery rate for these companies. (b) State any assumptions Xiang must make about the delivery rates of the two companies. (1)
June 2025 · Paper 4B (Further Statistics 2) · Q6(c) 7 marks t tests
(c) Using a 5% level of significance, carry out Xiang’s test. You should clearly state the hypotheses, test statistic and critical value you use. (7)
June 2025 · Paper 4B (Further Statistics 2) · Q6(d) 6 marks t tests
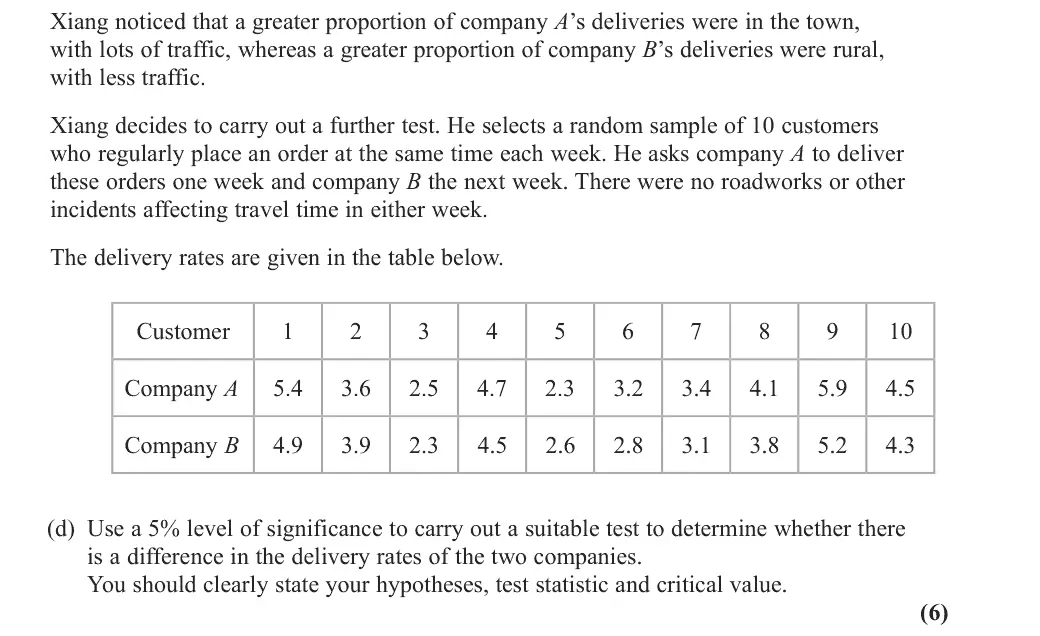
Xiang noticed that a greater proportion of company A’s deliveries were in the town, with lots of traffic, whereas a greater proportion of company B’s deliveries were rural, with less traffic. Xiang decides to carry out a further test. He selects a random sample of 10 customers who regularly place an order at the same time each week. He asks company A to deliver these orders one week and company B the next week. There were no roadworks or other incidents affecting travel time in either week. The delivery rates are given in the table below. Customer Company A 5.4 3.6 2.5 4.7 2.3 3.2 3.4 4.1 5.9 4.5 Company B 4.9 3.9 2.3 4.5 2.6 2.8 3.1 3.8 5.2 4.3 (d) Use a 5% level of significance to carry out a suitable test to determine whether there is a difference in the delivery rates of the two companies. You should clearly state your hypotheses, test statistic and critical value. (6)
June 2025 · Paper 4B (Further Statistics 2) · Q7(a) 7 marks combinations of random variablesestimation and confidence intervals
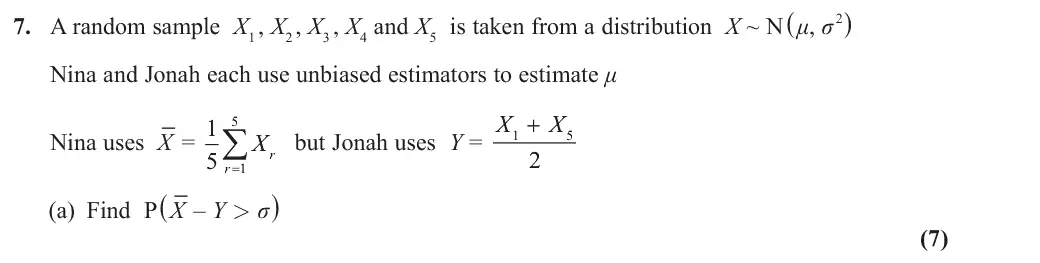
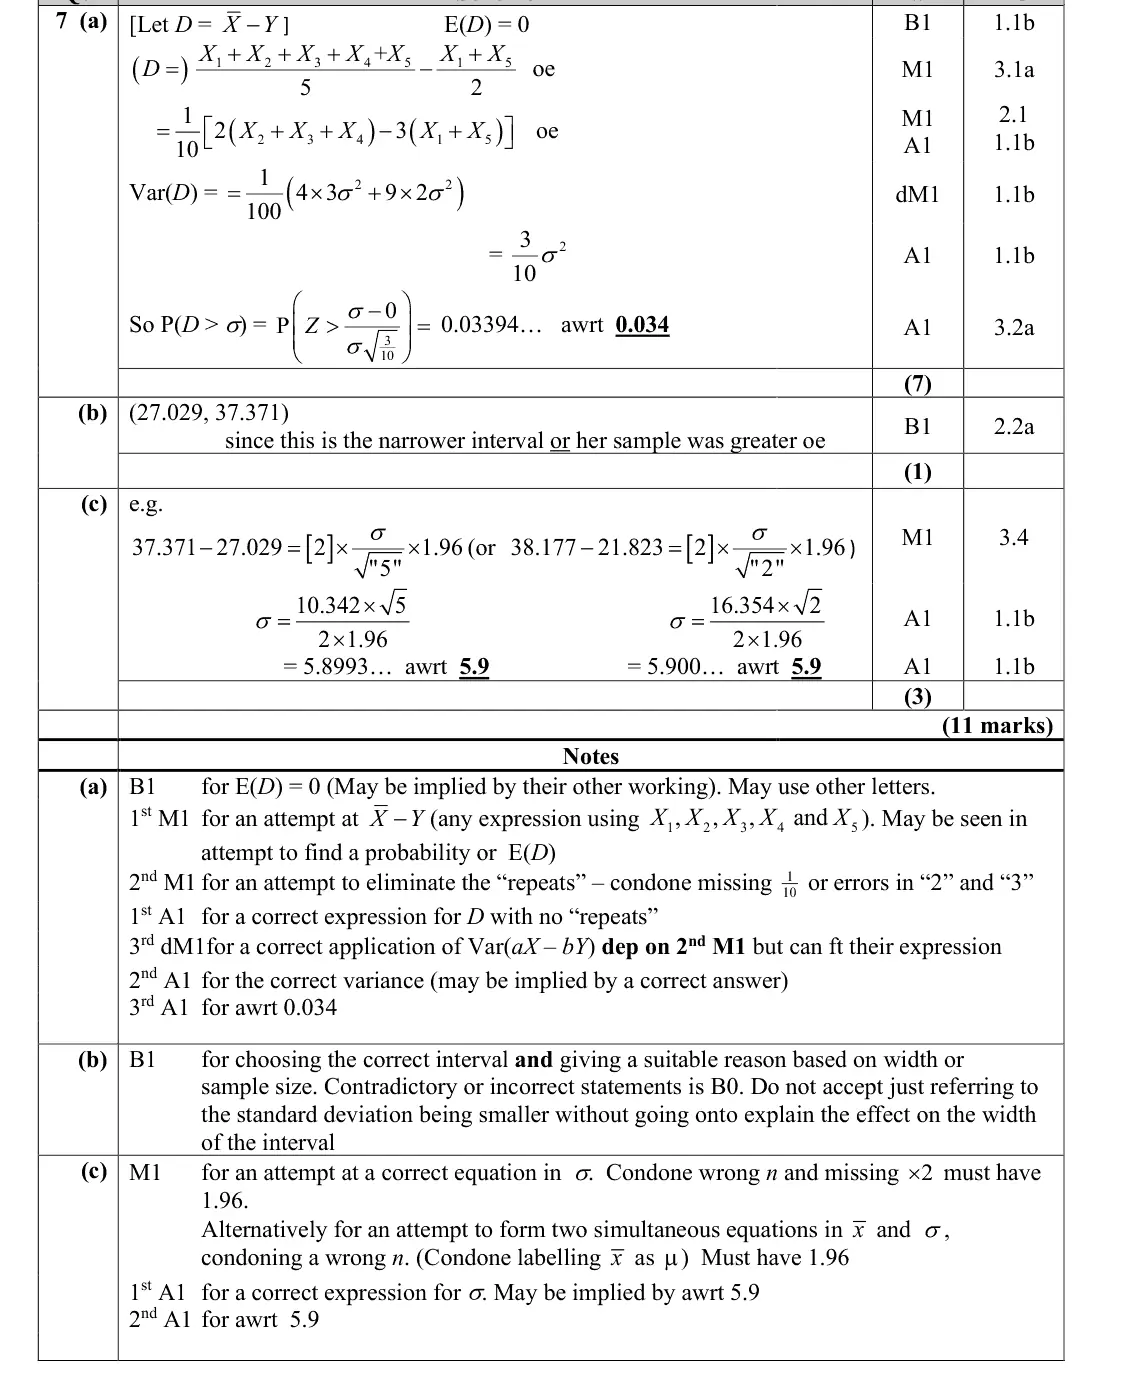
7. A random sample X1 , X2 , X3 , X4 and X5 is taken from a distribution X ~ N (μ, sigma 2) Nina and Jonah each use unbiased estimators to estimate μ but Jonah uses Y = X + X Nina uses X‾ = 1 rO; X r (a) Find P (X‾ – Y > sigma ) (7)
June 2025 · Paper 4B (Further Statistics 2) · Q7(b) 1 mark estimation and confidence intervals
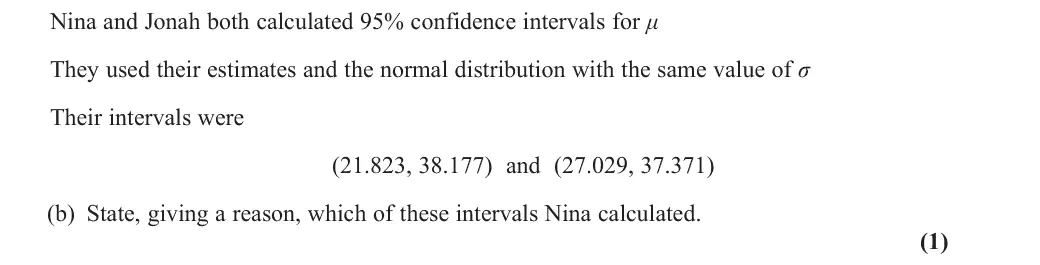
Nina and Jonah both calculated 95% confidence intervals for μ They used their estimates and the normal distribution with the same value of sigma Their intervals were (21.823, 38.177) and (27.029, 37.371) (b) State, giving a reason, which of these intervals Nina calculated. (1)
June 2025 · Paper 4B (Further Statistics 2) · Q7(c) 3 marks estimation and confidence intervals
(c) Using one of these intervals, find the value of sigma (3)

Find an Edexcel Further Maths tutor

Want this paper marked and gone through with a Further Maths tutor? Message us.

Prefer email? Send an enquiry

If you are under 18, please include a parent's contact details. Enquiries go to enquiries@alevelfurthermathstutor.com and are deleted once handled.