Nov 2021: A level Paper 4B: Further Statistics 2

75 marks · 25 question parts · Question paper, mark scheme and examiner's report on Pearson's site

Question by question

QTopicMarksDifficulty
1(a) Correlation: PMCC, Spearman's rank and tests 2 —
1(b) Correlation: PMCC, Spearman's rank and tests 1 —
1(c) Correlation: PMCC, Spearman's rank and tests 4 —
2(a) Estimators, confidence intervals and tests using the normal distribution 6 —
2(b) Estimators, confidence intervals and tests using the normal distribution 1 —
2(c) Estimators, confidence intervals and tests using the normal distribution 2 —
3(a) Continuous random variables and the uniform distribution 2 —
3(b) Continuous random variables and the uniform distribution 2 —
3(c) Continuous random variables and the uniform distribution 3 —
3(d) Continuous random variables and the uniform distribution 3 —
4(a) Correlation: PMCC, Spearman's rank and tests 1 —
4(b) Linear regression and residuals, Correlation: PMCC, Spearman's rank and tests 4 —
4(c) Linear regression and residuals, Correlation: PMCC, Spearman's rank and tests 1 —
4(d) Linear regression and residuals 1 —
4(e)(i) Linear regression and residuals 2 —
4(e)(ii) Linear regression and residuals 1 —
5(a) Estimators, confidence intervals and tests using the normal distribution 5 —
5(b) Estimators, confidence intervals and tests using the normal distribution 4 —
5(c) Estimators, confidence intervals and tests using the normal distribution 1 —
6(a) Variance tests: chi-squared and F-distribution 7 —
6(b) Variance tests: chi-squared and F-distribution 3 —
6(c) The t-distribution: t-tests and paired t-tests 5 —
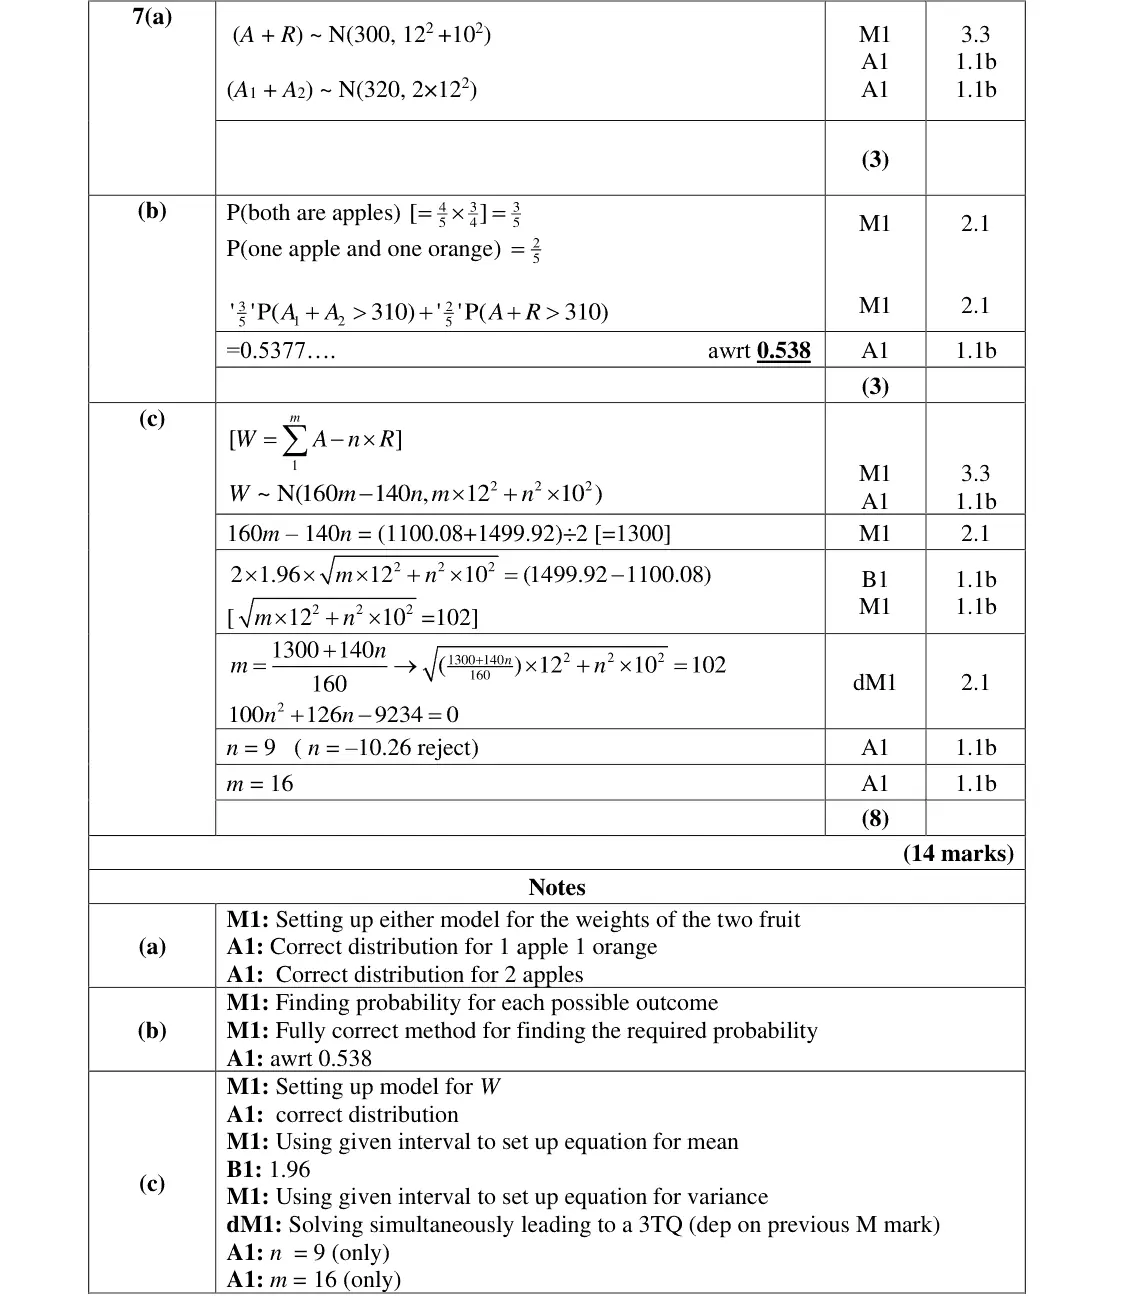
7(a) Combinations of random variables 3 —
7(b) Combinations of random variables 3 —
7(c) Combinations of random variables 8 —

The questions

1(a)1(b)1(c)2(a)2(b)2(c)3(a)3(b)3(c)3(d)4(a)4(b)4(c)4(d)4(e)(i)4(e)(ii)5(a)5(b)5(c)6(a)6(b)6(c)7(a)7(b)7(c)
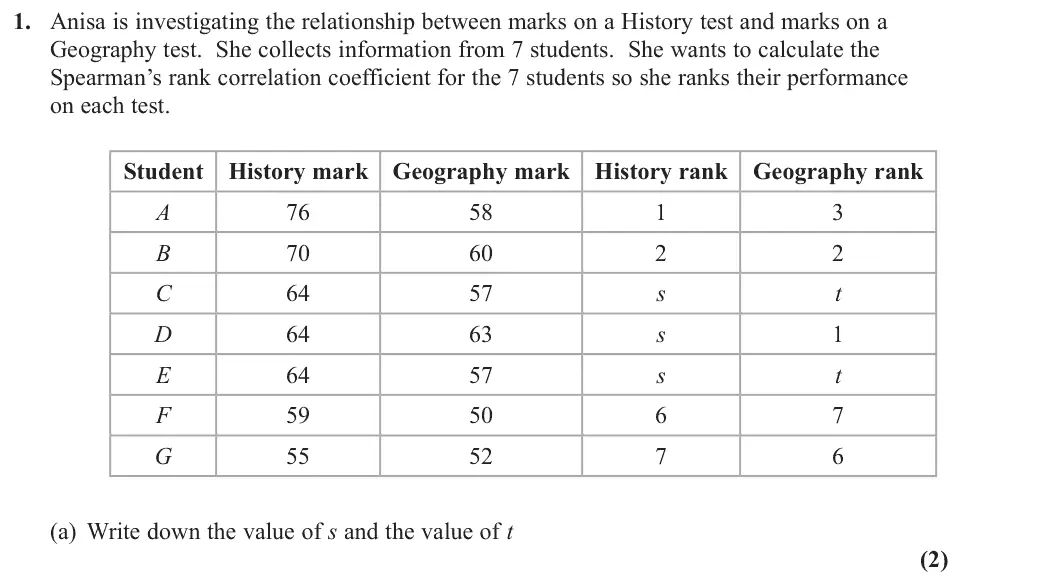
Nov 2021 · Paper 4B (Further Statistics 2) · Q1(a) 2 marks correlation fs2
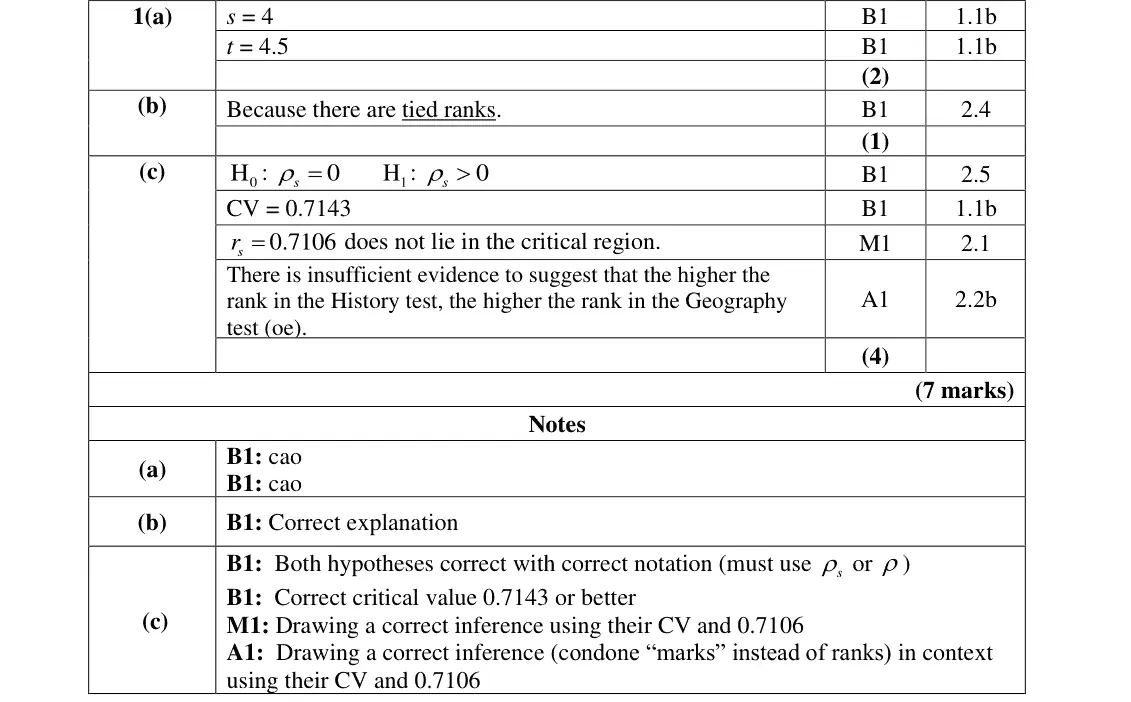
1. Anisa is investigating the relationship between marks on a History test and marks on a Geography test. She collects information from 7 students. She wants to calculate the Spearman’s rank correlation coefficient for the 7 students so she ranks their performance on each test. Student History mark Geography mark History rank Geography rank A B C s t s E s t F G (a) Write down the value of s and the value of t (2)
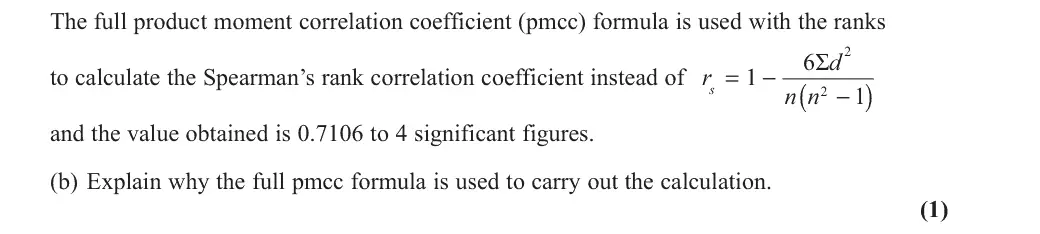
Nov 2021 · Paper 4B (Further Statistics 2) · Q1(b) 1 mark correlation fs2
The full product moment correlation coefficient (pmcc) formula is used with the ranks d 6Σ to calculate the Spearman’s rank correlation coefficient instead of r = - ( ) s n n - and the value obtained is 0.7106 to 4 significant figures. (b) Explain why the full pmcc formula is used to carry out the calculation. (1)
Nov 2021 · Paper 4B (Further Statistics 2) · Q1(c) 4 marks correlation fs2
(c) Stating your hypotheses clearly, test whether or not there is evidence to suggest that the higher a student ranks in the History test, the higher the student ranks in the Geography test. Use a 5% level of significance. (4)
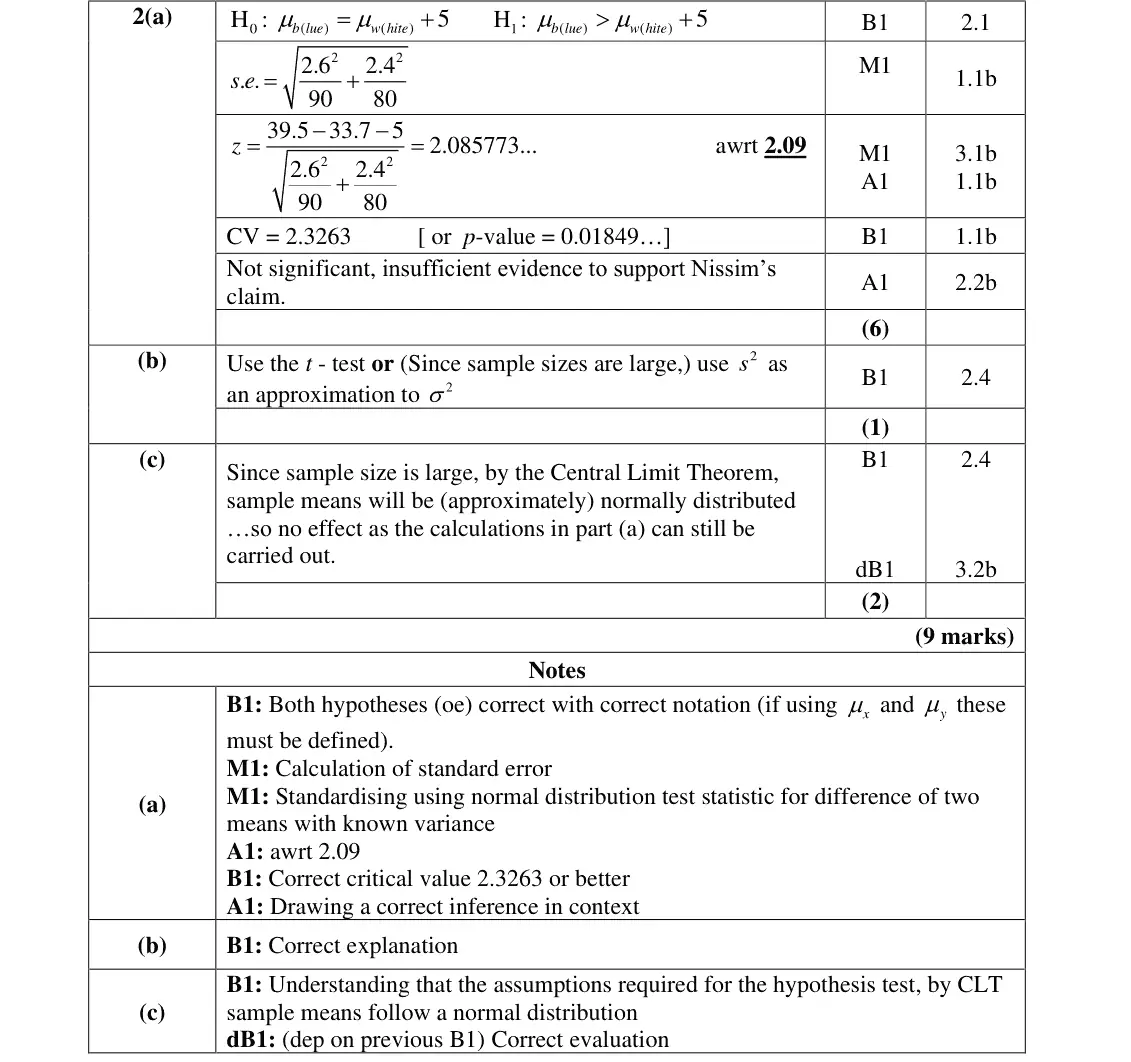
Nov 2021 · Paper 4B (Further Statistics 2) · Q2(a) 6 marks estimation and confidence intervals
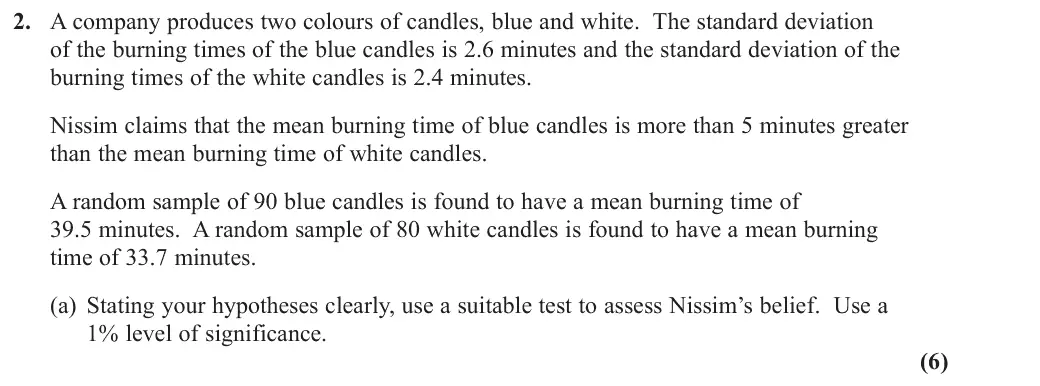
2. A company produces two colours of candles, blue and white. The standard deviation of the burning times of the blue candles is 2.6 minutes and the standard deviation of the burning times of the white candles is 2.4 minutes. Nissim claims that the mean burning time of blue candles is more than 5 minutes greater than the mean burning time of white candles. A random sample of 90 blue candles is found to have a mean burning time of 39.5 minutes. A random sample of 80 white candles is found to have a mean burning time of 33.7 minutes. (a) Stating your hypotheses clearly, use a suitable test to assess Nissim’s belief. Use a 1% level of significance. (6)
Nov 2021 · Paper 4B (Further Statistics 2) · Q2(b) 1 mark estimation and confidence intervals
(b) Explain how the hypothesis test in part (a) would be carried out differently if the variances of the burning times of candles were unknown. (1)
Nov 2021 · Paper 4B (Further Statistics 2) · Q2(c) 2 marks estimation and confidence intervals
The burning times for the candles may not follow a normal distribution. (c) Describe the effect this would have on the calculations in the hypothesis test in part (a). Give a reason for your answer. (2)
Nov 2021 · Paper 4B (Further Statistics 2) · Q3(a) 2 marks continuous random variables
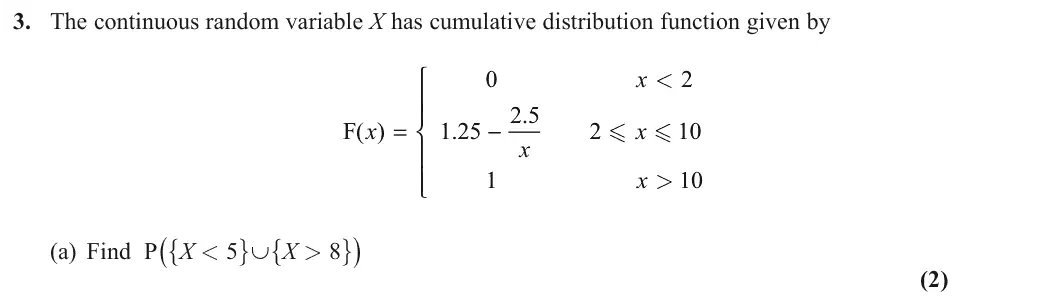
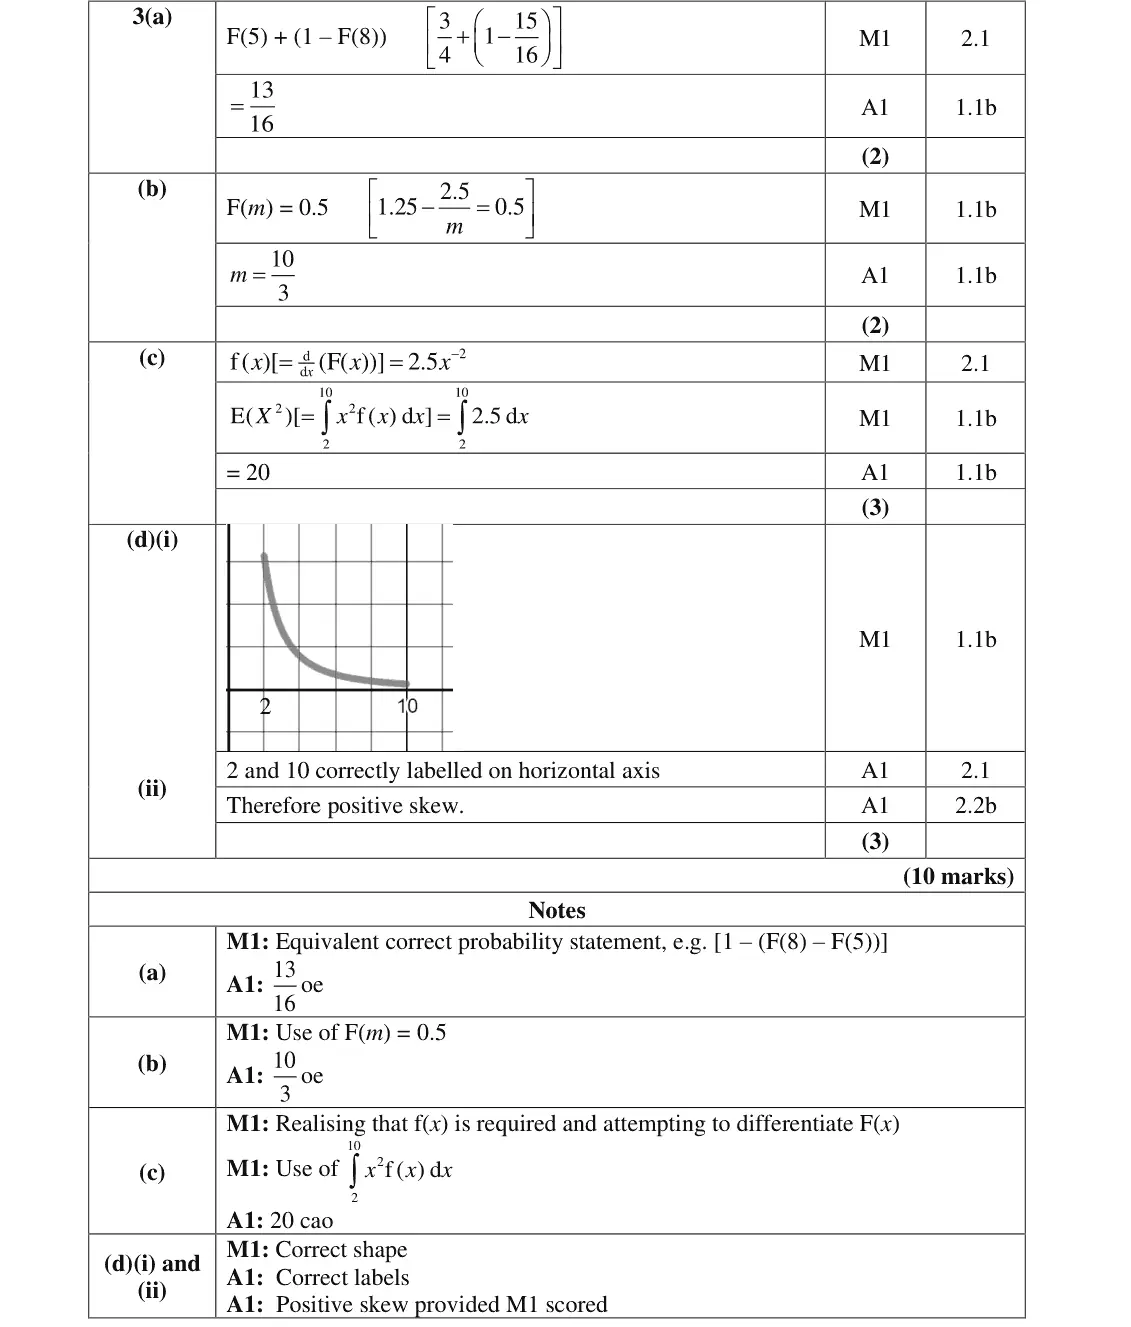
3. The continuous random variable X has cumulative distribution function given by x < 2 5 x = - x F( ) 1 25 x x > (a) Find P ({X < 5} ∪ {X > 8}) (2)
Nov 2021 · Paper 4B (Further Statistics 2) · Q3(b) 2 marks continuous random variables
(b) Find the median of X. (2)
Nov 2021 · Paper 4B (Further Statistics 2) · Q3(c) 3 marks continuous random variables
(c) Find E (X 2) (3)
Nov 2021 · Paper 4B (Further Statistics 2) · Q3(d) 3 marks continuous random variables
(d) (i) Sketch the probability density function of X. (ii) Describe the skewness of the distribution of X. (3)
Nov 2021 · Paper 4B (Further Statistics 2) · Q4(a) 1 mark correlation fs2
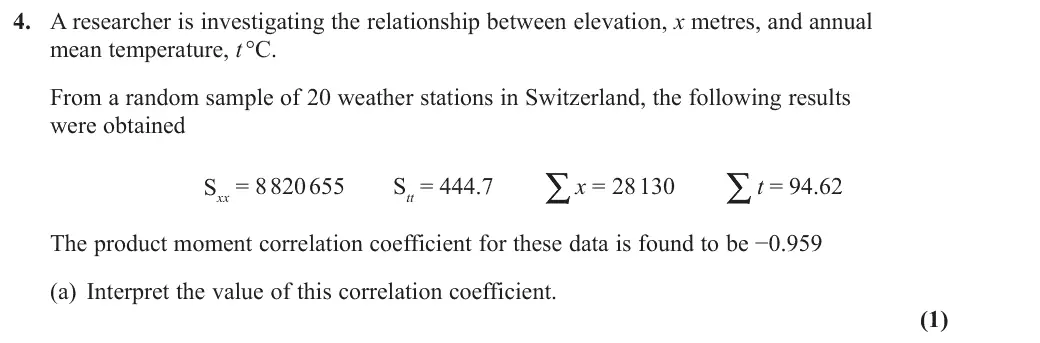
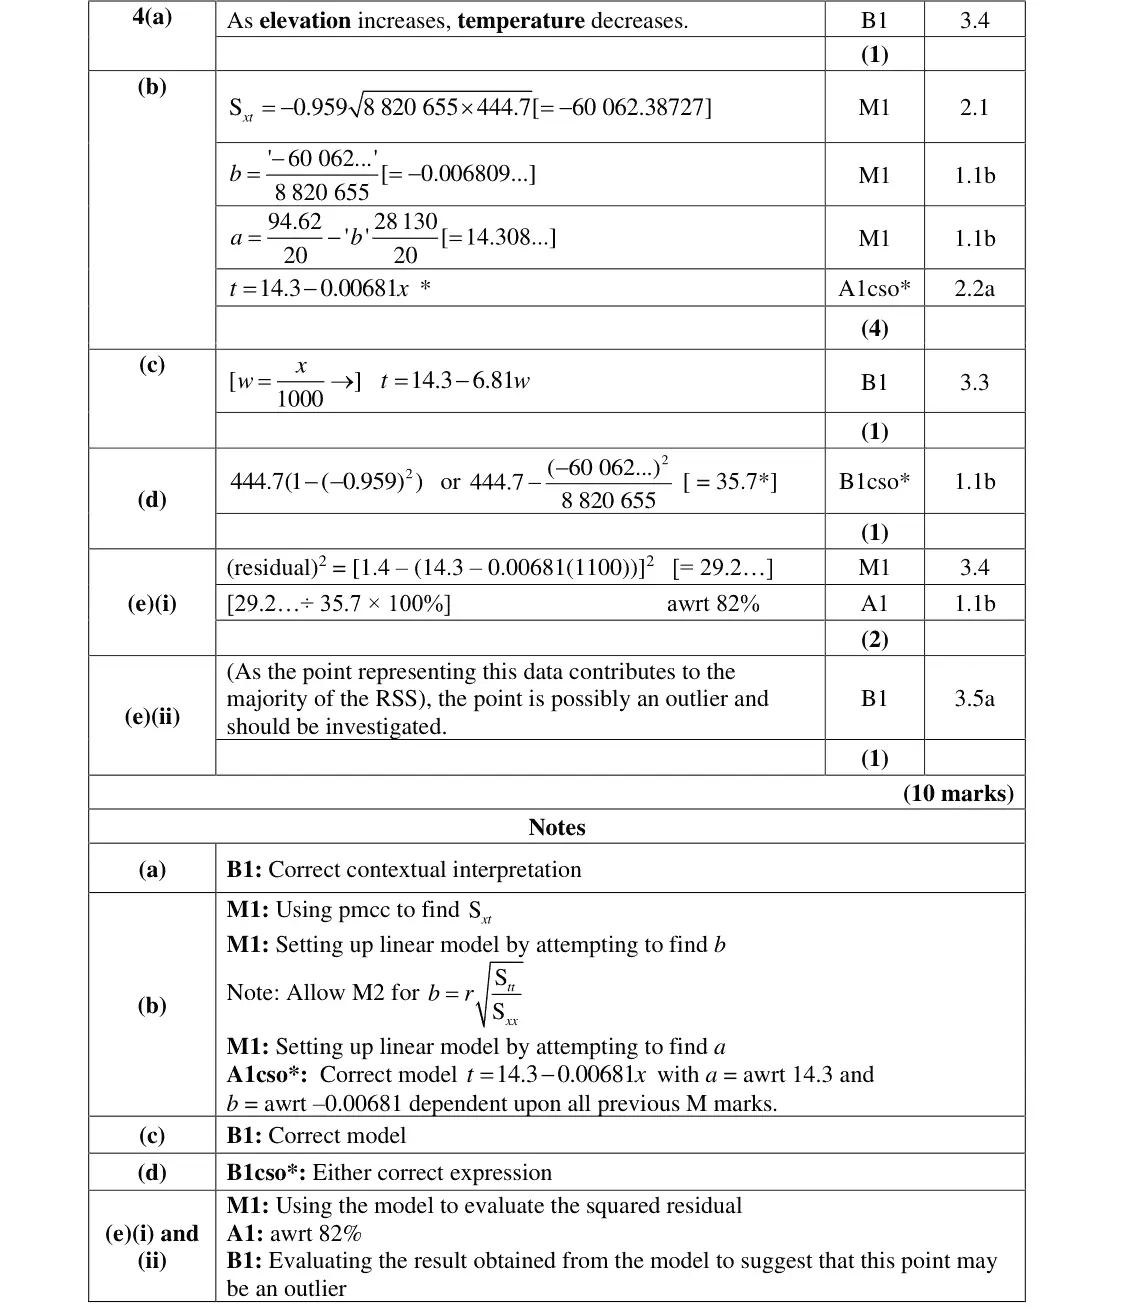
4. A researcher is investigating the relationship between elevation, x metres, and annual mean temperature, t °C. From a random sample of 20 weather stations in Switzerland, the following results were obtained Sxx = 8 820 655 Stt = 444.7 ∑x = 28 130 ∑t = 94.62 The product moment correlation coefficient for these data is found to be -0.959 (a) Interpret the value of this correlation coefficient. (1)
Nov 2021 · Paper 4B (Further Statistics 2) · Q4(b) 4 marks linear regressioncorrelation fs2
(b) Show that the equation of the regression line of t on x can be written as t = 14.3 - 0.00681x (4)
Nov 2021 · Paper 4B (Further Statistics 2) · Q4(c) 1 mark linear regressioncorrelation fs2
The random variable W represents the elevations of the weather stations in kilometres. (c) Write down the equation of the regression line of t on w for these 20 weather stations in the form t = a + bw (1)
Nov 2021 · Paper 4B (Further Statistics 2) · Q4(d) 1 mark linear regression
(d) Show that the residual sum of squares (RSS) for the model for t and x is 35.7 correct to one decimal place. (1)
Nov 2021 · Paper 4B (Further Statistics 2) · Q4(e)(i) 2 marks linear regression
One of the weather stations in the sample had a recorded elevation of 1100 metres and an annual mean temperature of 1.4 °C (e) (i) Calculate this weather station’s contribution to the residual sum of squares. Give your answer as a percentage. (2)
Nov 2021 · Paper 4B (Further Statistics 2) · Q4(e)(ii) 1 mark linear regression
(ii) Comment on the data for this weather station in light of your answer to part (e)(i). (1)
Nov 2021 · Paper 4B (Further Statistics 2) · Q5(a) 5 marks estimation and confidence intervals
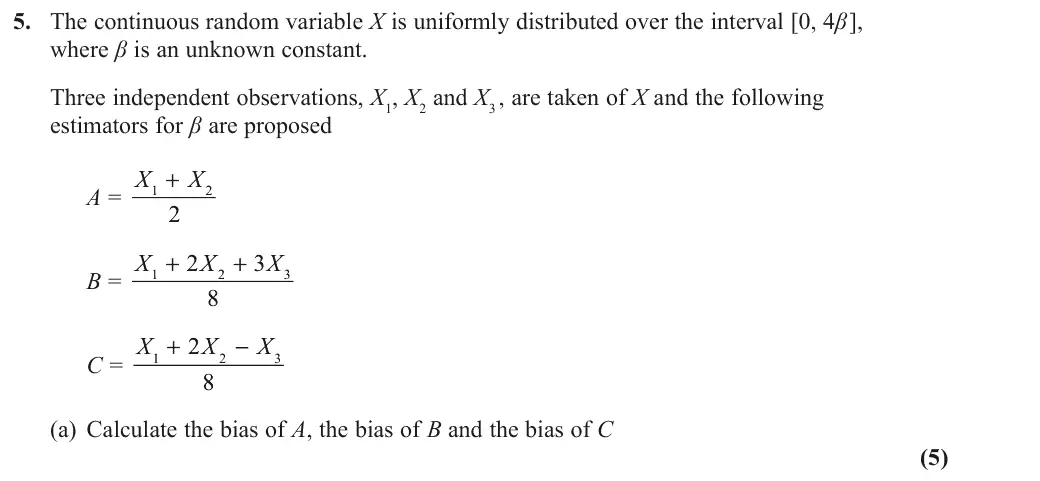
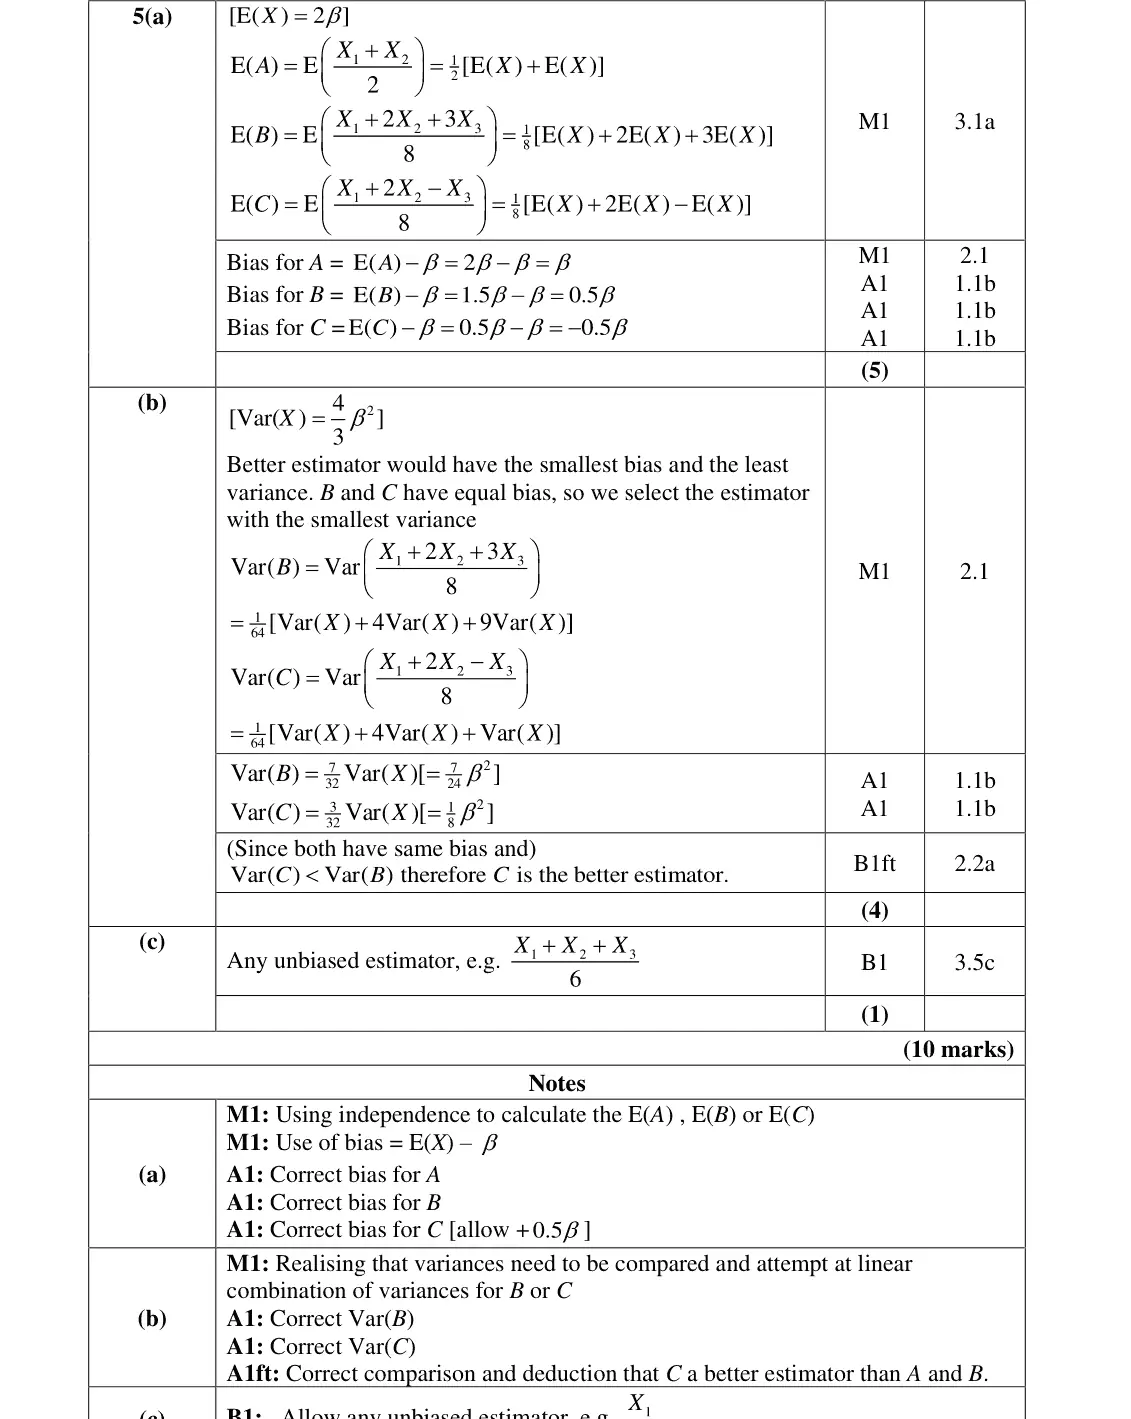
5. The continuous random variable X is uniformly distributed over the interval [0, 4 beta ], where beta is an unknown constant. Three independent observations, X1, X2 and X3 , are taken of X and the following estimators for beta are proposed A = X + X B = X + X + X C = X + X - X (a) Calculate the bias of A, the bias of B and the bias of C (5)
Nov 2021 · Paper 4B (Further Statistics 2) · Q5(b) 4 marks estimation and confidence intervals
(b) By calculating the variances, explain which of B or C is the better estimator for beta (4)
Nov 2021 · Paper 4B (Further Statistics 2) · Q5(c) 1 mark estimation and confidence intervals
(c) Find an unbiased estimator for beta (1)
Nov 2021 · Paper 4B (Further Statistics 2) · Q6(a) 7 marks chi squared and f tests
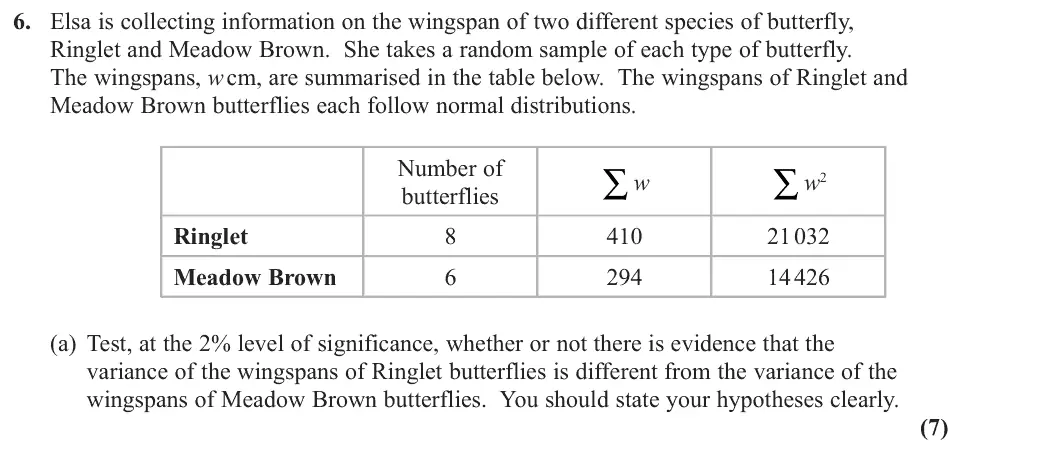
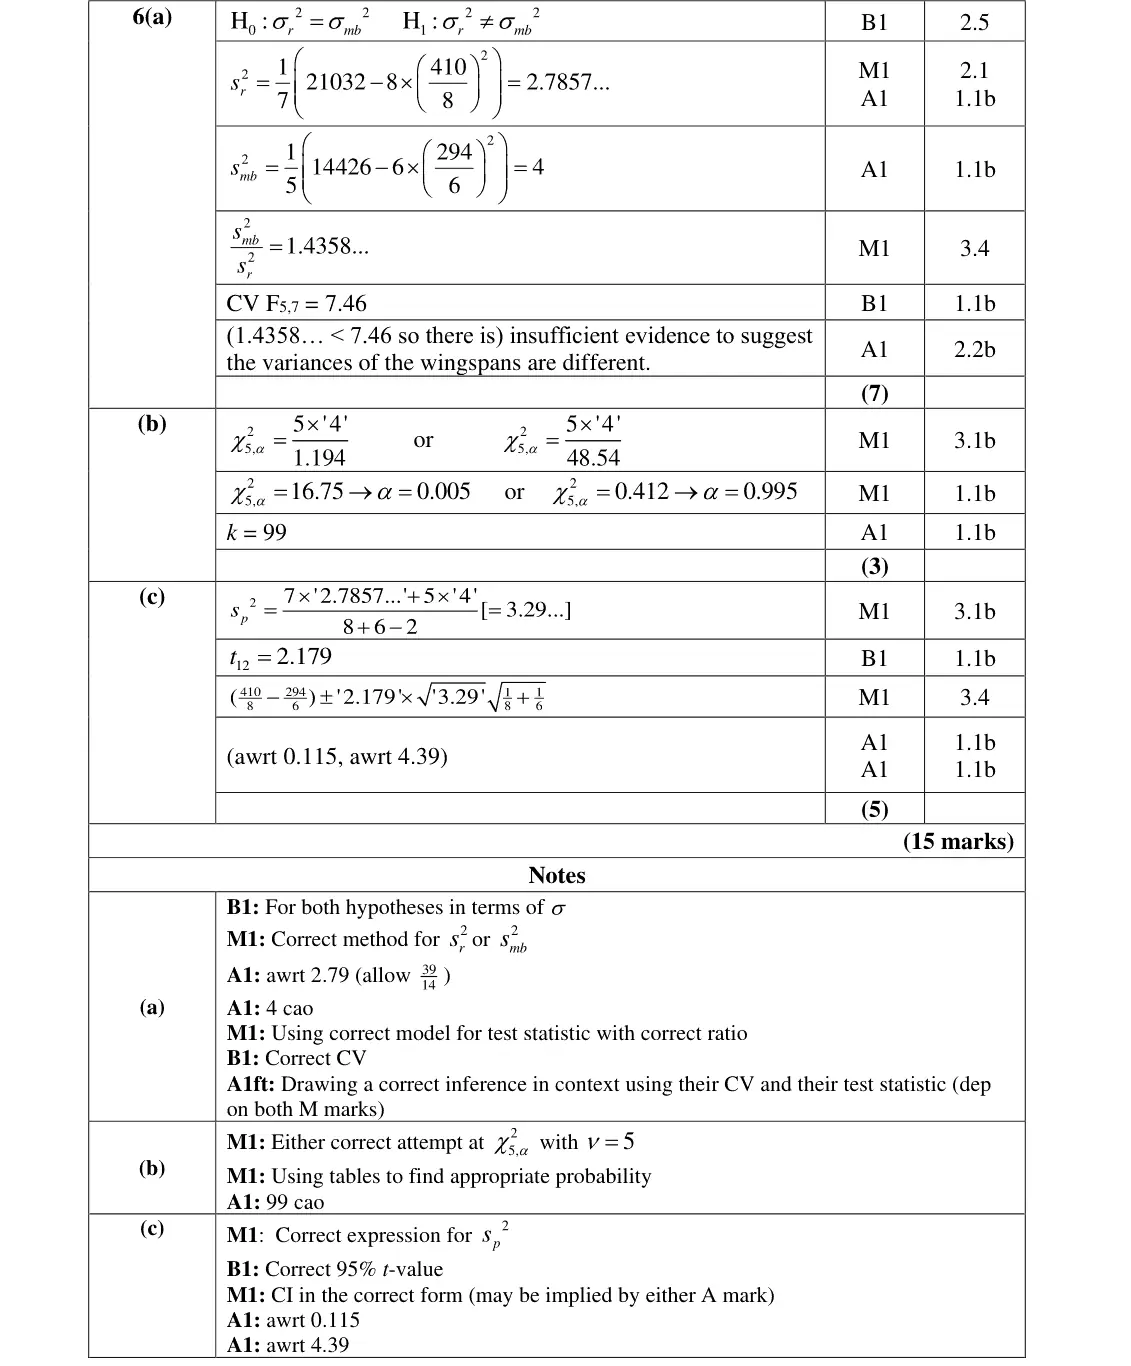
6. Elsa is collecting information on the wingspan of two different species of butterfly, Ringlet and Meadow Brown. She takes a random sample of each type of butterfly. The wingspans, w cm, are summarised in the table below. The wingspans of Ringlet and Meadow Brown butterflies each follow normal distributions. Number of ∑w ∑w2 butterflies Ringlet 21 032 Meadow Brown 14 426 (a) Test, at the 2% level of significance, whether or not there is evidence that the variance of the wingspans of Ringlet butterflies is different from the variance of the wingspans of Meadow Brown butterflies. You should state your hypotheses clearly. (7)
Nov 2021 · Paper 4B (Further Statistics 2) · Q6(b) 3 marks chi squared and f tests
The k % confidence interval for the variance of the wingspans of Meadow Brown butterflies is (1.194, 48.54) (b) Find the value of k (3)
Nov 2021 · Paper 4B (Further Statistics 2) · Q6(c) 5 marks t tests
(c) Calculate a 95% confidence interval for the difference between the mean wingspan of the Ringlet butterfly and the mean wingspan of the Meadow Brown butterfly. (5)
Nov 2021 · Paper 4B (Further Statistics 2) · Q7(a) 3 marks combinations of random variables
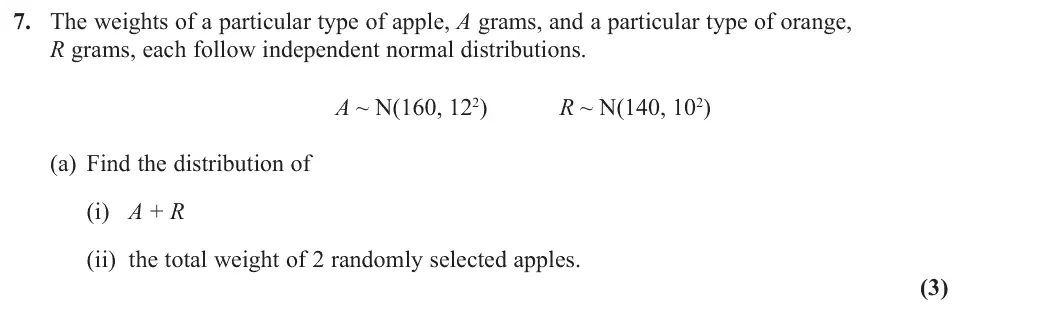
7. The weights of a particular type of apple, A grams, and a particular type of orange, R grams, each follow independent normal distributions. A ~ N(160, 122) R ~ N(140, 102) (a) Find the distribution of (i) A + R (ii) the total weight of 2 randomly selected apples. (3)
Nov 2021 · Paper 4B (Further Statistics 2) · Q7(b) 3 marks combinations of random variables
A box contains 4 apples and 1 orange only. Jesse selects 2 pieces of fruit at random from the box. (b) Find the probability that the total weight of the 2 pieces of fruit exceeds 310 grams. (3)
Nov 2021 · Paper 4B (Further Statistics 2) · Q7(c) 8 marks combinations of random variables
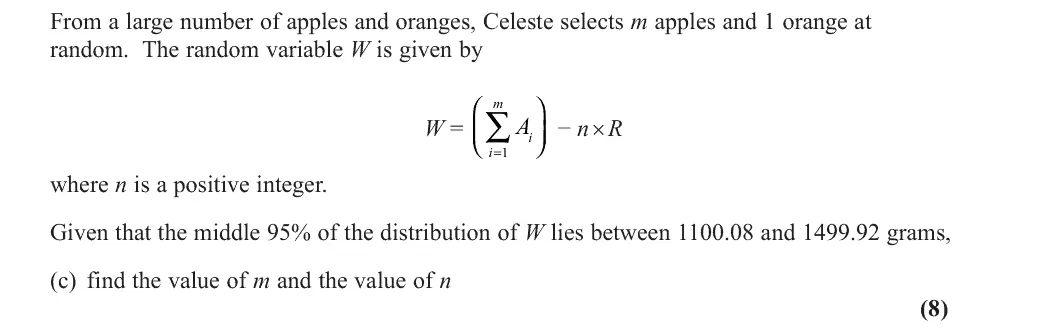
From a large number of apples and oranges, Celeste selects m apples and 1 orange at random. The random variable W is given by m =∑ W = Ai - n x R i where n is a positive integer. Given that the middle 95% of the distribution of W lies between 1100.08 and 1499.92 grams, (c) find the value of m and the value of n (8)

Find an Edexcel Further Maths tutor

Want this paper marked and gone through with a Further Maths tutor? Message us.
Prefer email? Send an enquiry

If you are under 18, please include a parent's contact details. Enquiries go to enquiries@alevelfurthermathstutor.com and are deleted once handled.