FS1.2.1 The Poisson distribution The additive property of Poisson…
Section
FS1.2 Poisson & binomial distributions
Level
AS & A level
Statement
The Poisson distribution The additive property of Poisson distributions
Guidance
Students will be expected to use this distribution to model a real-world situation and to comment critically on the appropriateness. Students will be expected to use their calculators to calculate probabilities including cumulative probabilities. Students will be expected to use the additive property of the Poisson distribution. E.g. if X= the number of events per minute and X∼ Po(λ), then the number of events per 5 minutes ∼ Po(5λ). If Xand Y are independent random variables with X ~ Po(λ) and Y ~ Po(µ), then X + Y ~ Po(λ + µ ) No proofs are required.
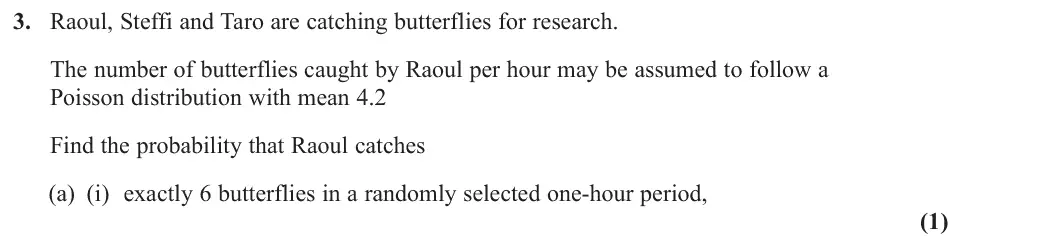
June 2025 · AS Paper 2 (Further Statistics 1) · Q3(a)(i)1 mark
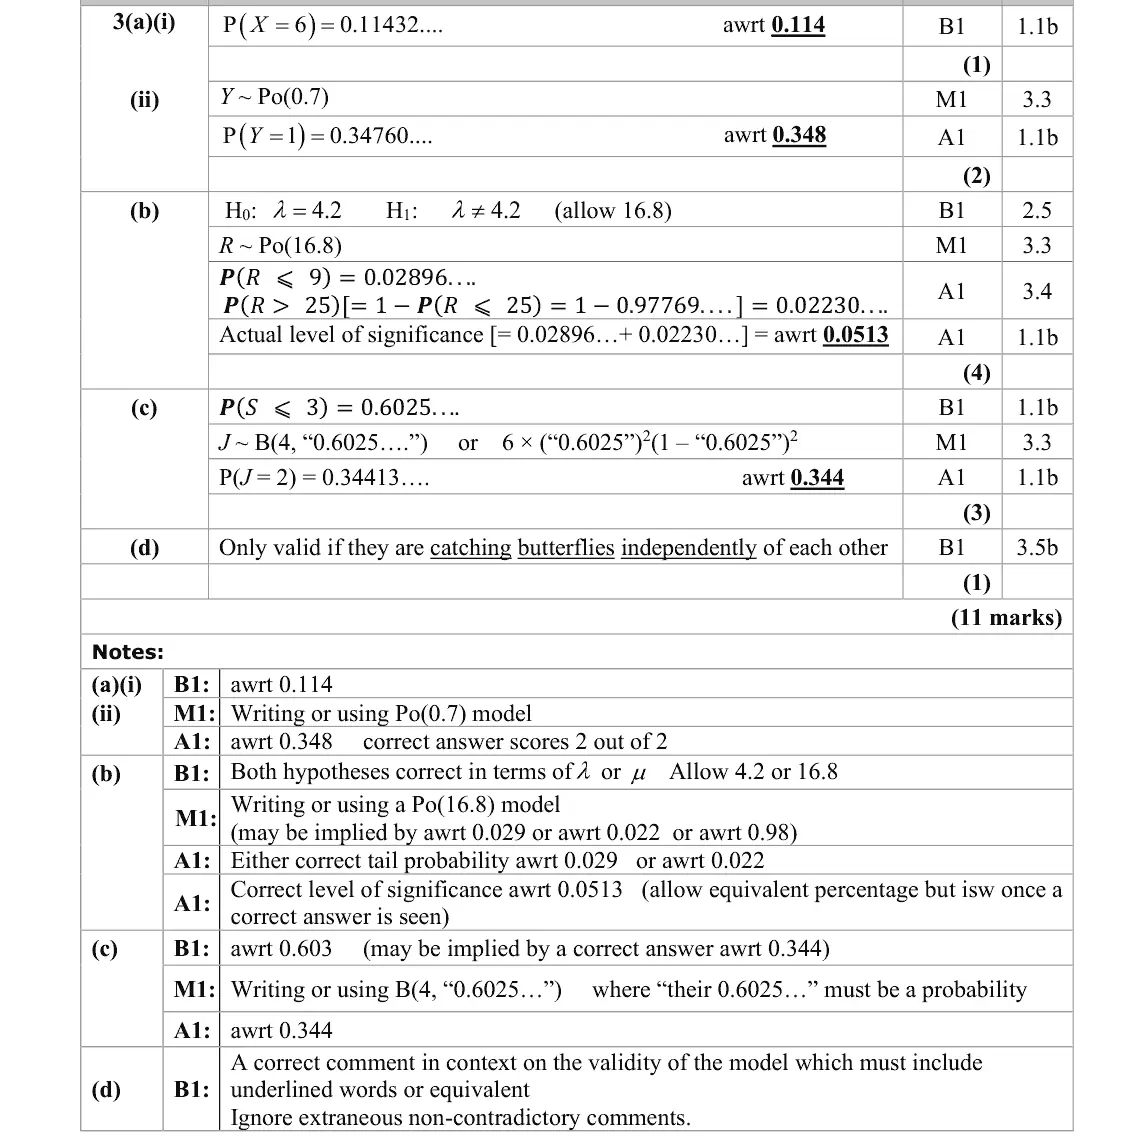
Mark scheme (whole question; this part is marked with the orange bar)
Examiner's comment
(a)(i)(ii) The calculation of Poisson probabilities proved to be accessible to nearly all students. Nearly all understand the requirement to give answer to at least 3 significant figures. Only on some rare occasions were students unable to accurately convert the mean in part (ii).
Key points from the mark scheme and examiner's report
X ~ Po(4.2)
P(X = 6) = 0.114
June 2025 · AS Paper 2 (Further Statistics 1) · Q3(a)(ii)2 marks
Mark scheme (whole question; this part is marked with the orange bar)
Examiner's comment
(a)(i)(ii) The calculation of Poisson probabilities proved to be accessible to nearly all students. Nearly all understand the requirement to give answer to at least 3 significant figures. Only on some rare occasions were students unable to accurately convert the mean in part (ii). (b) In general, the hypotheses were stated with correct notation and in terms of λ. Nearly all identified the appropriate Poisson distribution in this part and most calculated a correct lower tail probability. Of those also finding a correct upper tail probability, some went on to approximate the actual level of significance and gave an answer of 5% or 6% rather than simply adding together the two tails. (c) This was well answered with most working accurately enough to arrive at the final answer. (d) Those who gave their answer in context generally identified independence as the reason that Taro’s model allowed him to add together the means of the other two distributions. Some unsuccessful responses saw students giving generic answers about the conditions required for a Poisson distribution in general, such as singly or constant rate.
Key points from the mark scheme and examiner's report
scale the mean to 10 minutes: Y ~ Po(0.7)
P(Y = 1) = 0.348
June 2025 · AS Paper 2 (Further Statistics 1) · Q3(c)3 marks
Mark scheme (whole question; this part is marked with the orange bar)
Examiner's comment
(c) This was well answered with most working accurately enough to arrive at the final answer.
Key points from the mark scheme and examiner's report
P(S ≤ 3) = 0.6025 from Po(3.2)
J ~ B(4, 0.6025)
P(J = 2) = 6 × 0.6025² × 0.3975² = 0.344
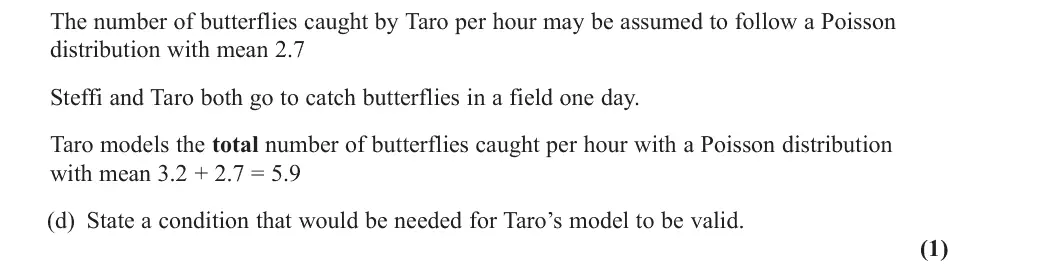
June 2025 · AS Paper 2 (Further Statistics 1) · Q3(d)1 mark
Mark scheme (whole question; this part is marked with the orange bar)
Examiner's comment
(d) Those who gave their answer in context generally identified independence as the reason that Taro’s model allowed him to add together the means of the other two distributions. Some unsuccessful responses saw students giving generic answers about the conditions required for a Poisson distribution in general, such as singly or constant rate.
Key points from the mark scheme and examiner's report
additive property needs Steffi and Taro to catch butterflies independently of each other
generic Poisson conditions (singly, constant rate) did not score
June 2025 · Paper 3B (Further Statistics 1) · Q5(a)2 marks
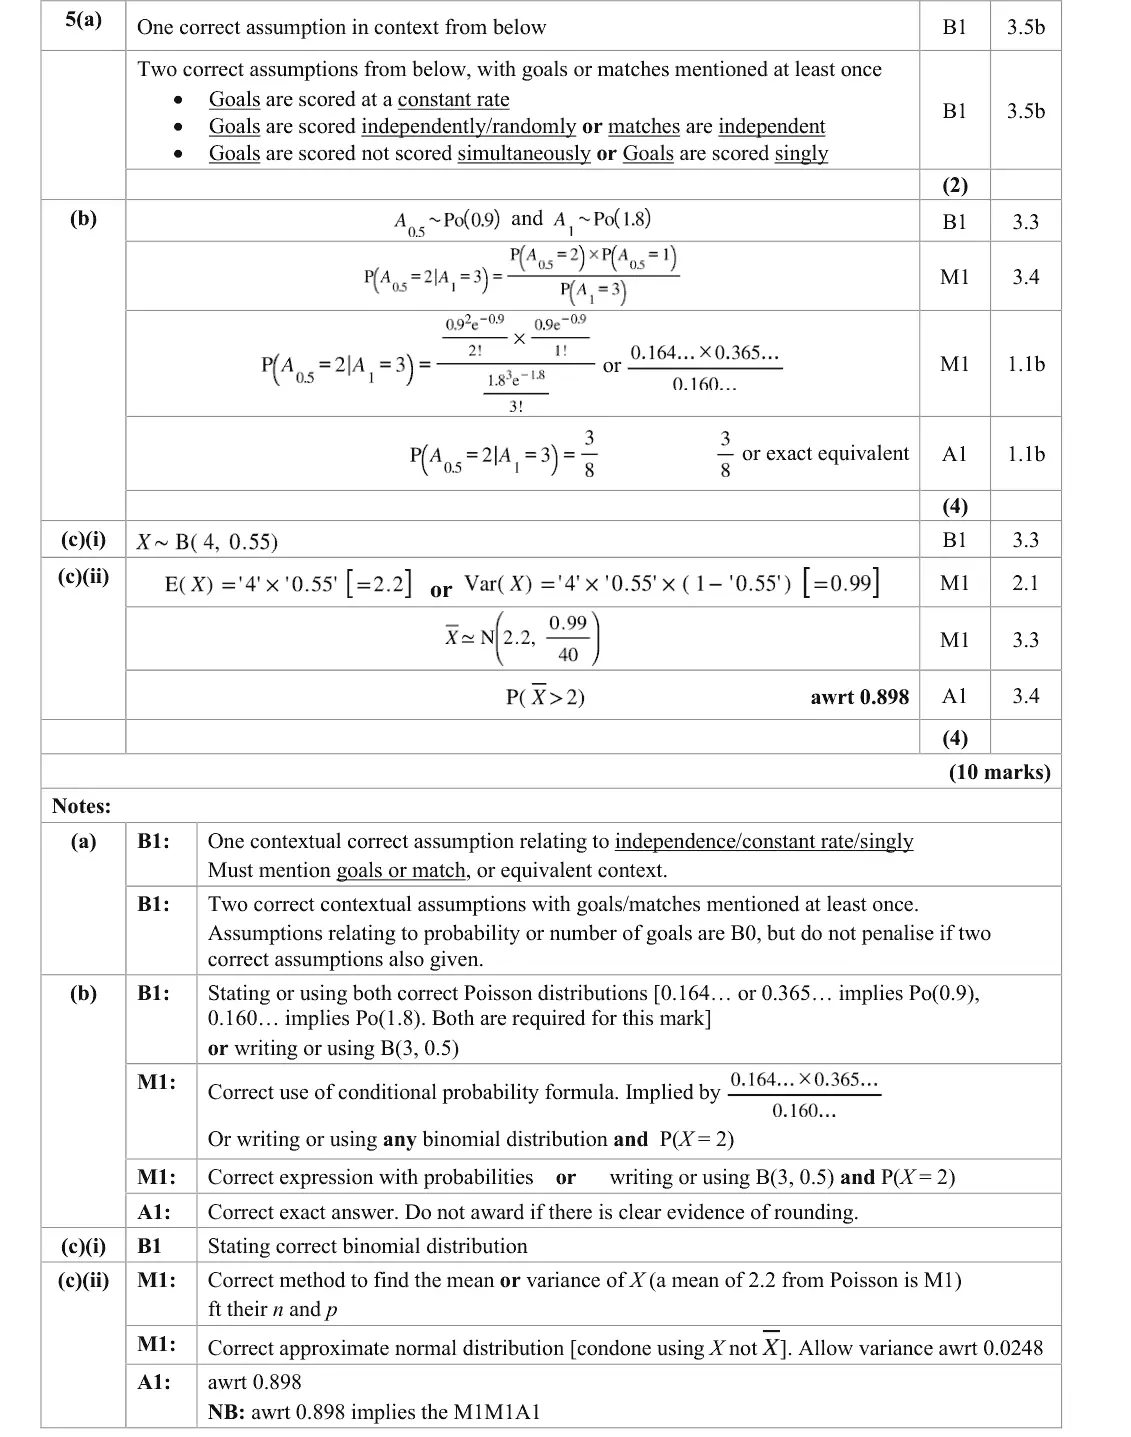
Mark scheme (whole question; this part is marked with the orange bar)
Examiner's comment
Part (a) was done reasonably well overall, with most candidates well-versed in giving assumptions in context. The main issue candidates had was not lack of context, as the context was quite straightforward, but incorrect statistical statements. Referring to probability or number rather than rate was not uncommon. To prepare well for questions such as these, candidates should be advised to have a strong knowledge of the statistical assumptions and properties of each distribution.
Key points from the mark scheme and examiner's report
goals scored singly, independently and at a constant rate (in context)
referring to probability or number rather than rate scores 0
June 2025 · Paper 3B (Further Statistics 1) · Q5(b)4 marks
Mark scheme (whole question; this part is marked with the orange bar)
Examiner's comment
Part (b) was one of the most challenging parts of the paper. It required strong problem-solving skills, with either a good understanding of conditional probability or a making an astute pivot to using a binomial distribution. The most common approach was to use a Poisson distribution and conditional probability, this was more obvious in terms of choice, but more challenging to execute. The approach using binomial was very simple to execute, but required more problem-solving skill to consider alternative distributions. For those choosing the Poisson approach, many simply found the probability of 2 goals in the first half and one in the second which yielded no marks, unless they indicated that they would also need to use Po(1.8) for the whole match. This was a good example of the merit of stating the distributions as many who did salvaged a mark on this approach. The question was certainly phrased in a way that should be familiar to all A Level students as a conditional probability question. However, not many candidates spotted that the question was a conditional one, though those that did were almost always able to finish it successfully. Candidates who started with the correct binomial distribution tended to cut through to a correct answer swiftly. The final issue for candidates on this part was giving their answer exactly. While the marking was generous here, candidates should be advised to use exact values throughout their calculation, if they did so here their answer would have remained exact organically.
Key points from the mark scheme and examiner's report
Po(0.9) per half, Po(1.8) per match: P(2 then 1)/P(3) = 3/8, or B(3, 0.5) with P(X = 2)
P(2 in first half and 1 in second) alone scores 0
one of the hardest parts
June 2025 · Paper 3B (Further Statistics 1) · Q7(d)2 marks
Mark scheme (whole question; this part is marked with the orange bar)
Examiner's comment
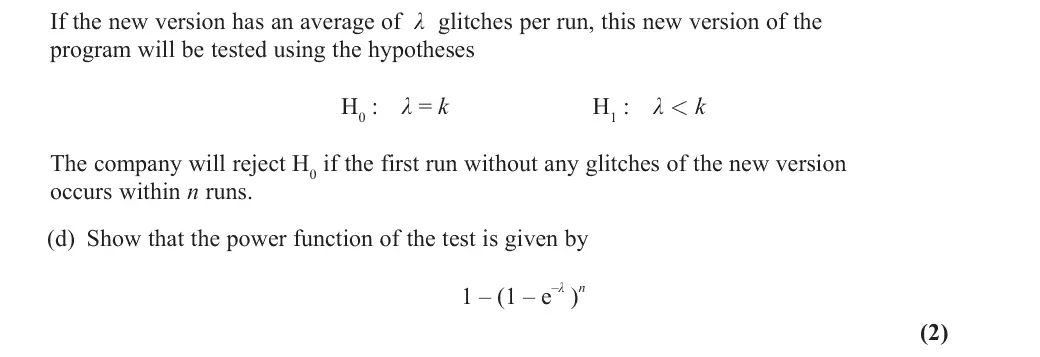
In general, candidates scored well in this question, with the exception of part (d), which was very challenging. Part (d) was understandably challenging for the candidates as these were high demand marks. The question was complex in terms of the context as well as the statistical knowledge required. Many candidates chose to concentrate on the given answer and work backwards from it, instead of working from first principles. This approach did not seem to be helpful to candidates and often resulted in seemingly random probability statements being written down with no coherent pattern to force the answer. Candidates who approached the question without working backwards often latched on to the crucial first step of realising that the previous part suggested that a Geometric distribution is the appropriate model to use, and, given that, to determine its parameter, p. Leading them to the next step of establishing that the parameter, p, the probability of number glitches in a run, as e-λ . Therefore, a good number of candidates did gain the first mark in part (d). A reasonably number did indeed go on to give a correct probability statement leading to the given answer and gain the final mark. A minority of candidates gained both marks by stating that Power = 1 – P(Type II error).
Key points from the mark scheme and examiner's report
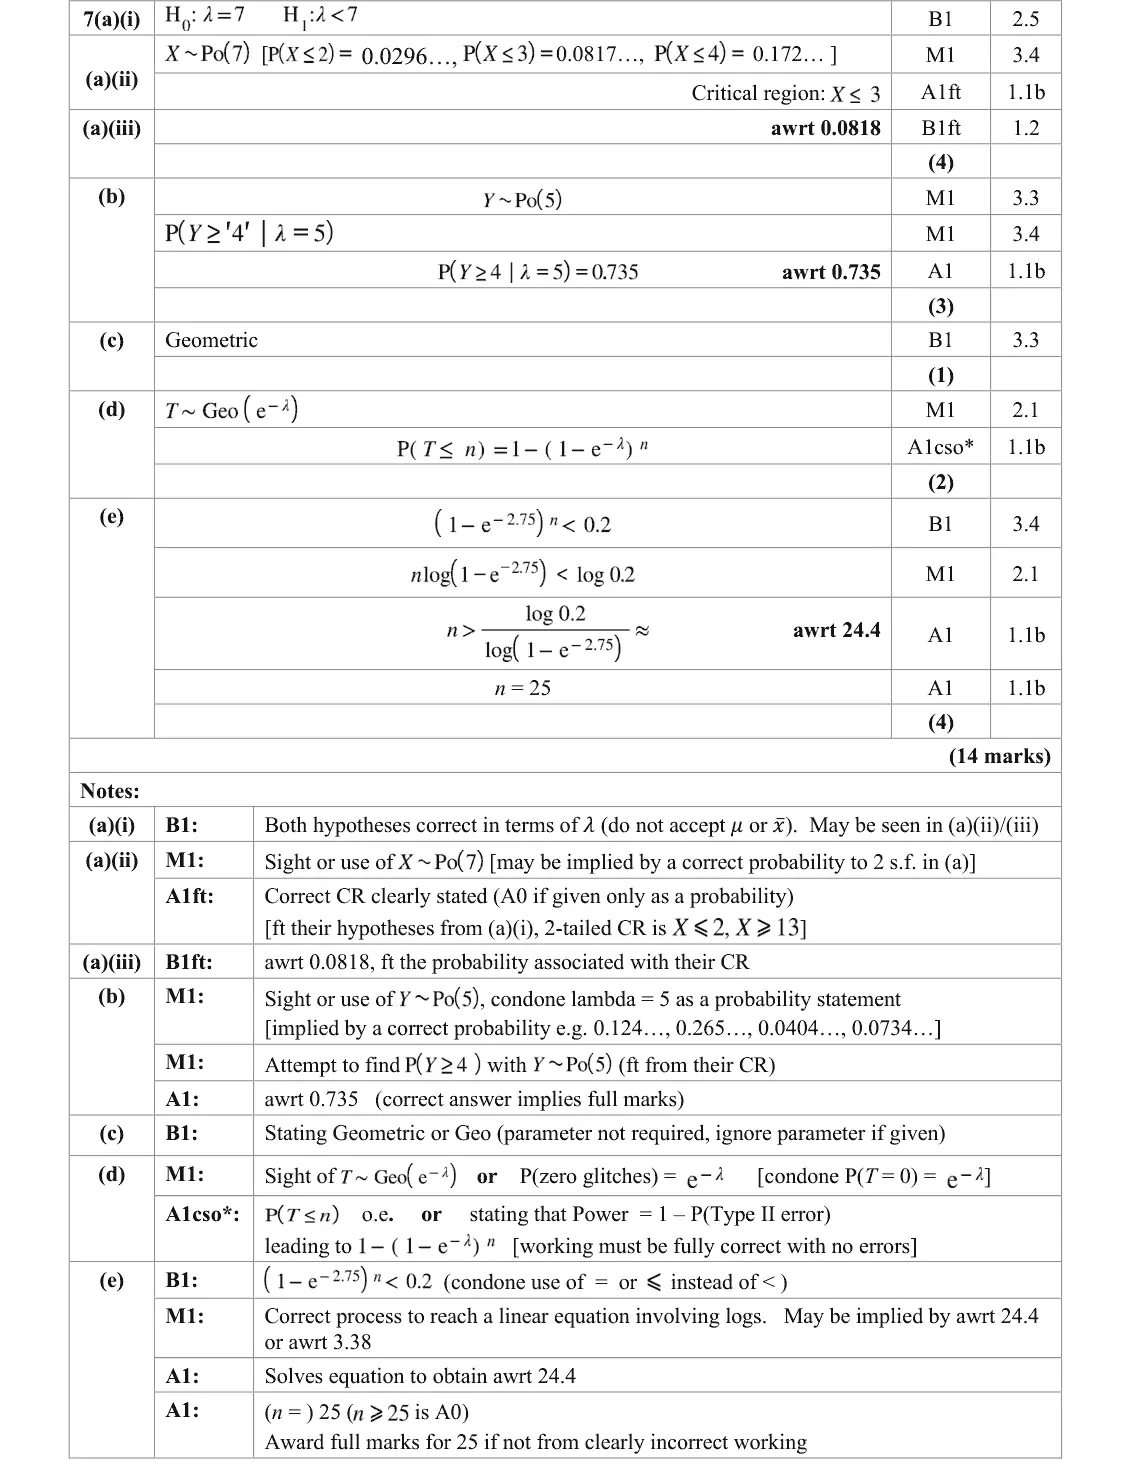
P(run has no glitches) = e^(−λ) so T ~ Geo(e^(−λ))
power = P(T ≤ n) = 1 − (1 − e^(−λ))ⁿ
working backwards from the answer failed
June 2024 · AS Paper 2 (Further Statistics 1) · Q2(a)1 mark
Mark scheme (whole question; this part is marked with the orange bar)
Examiner's comment
This question required students to give answers in context which they often find difficult. Part (a) was generally answered well but some students failed to relate their answer to the context (accidents) of the question. Common incorrect responses included referencing assumptions relating to the binomial distribution (constant probability).
Key points from the mark scheme and examiner's report
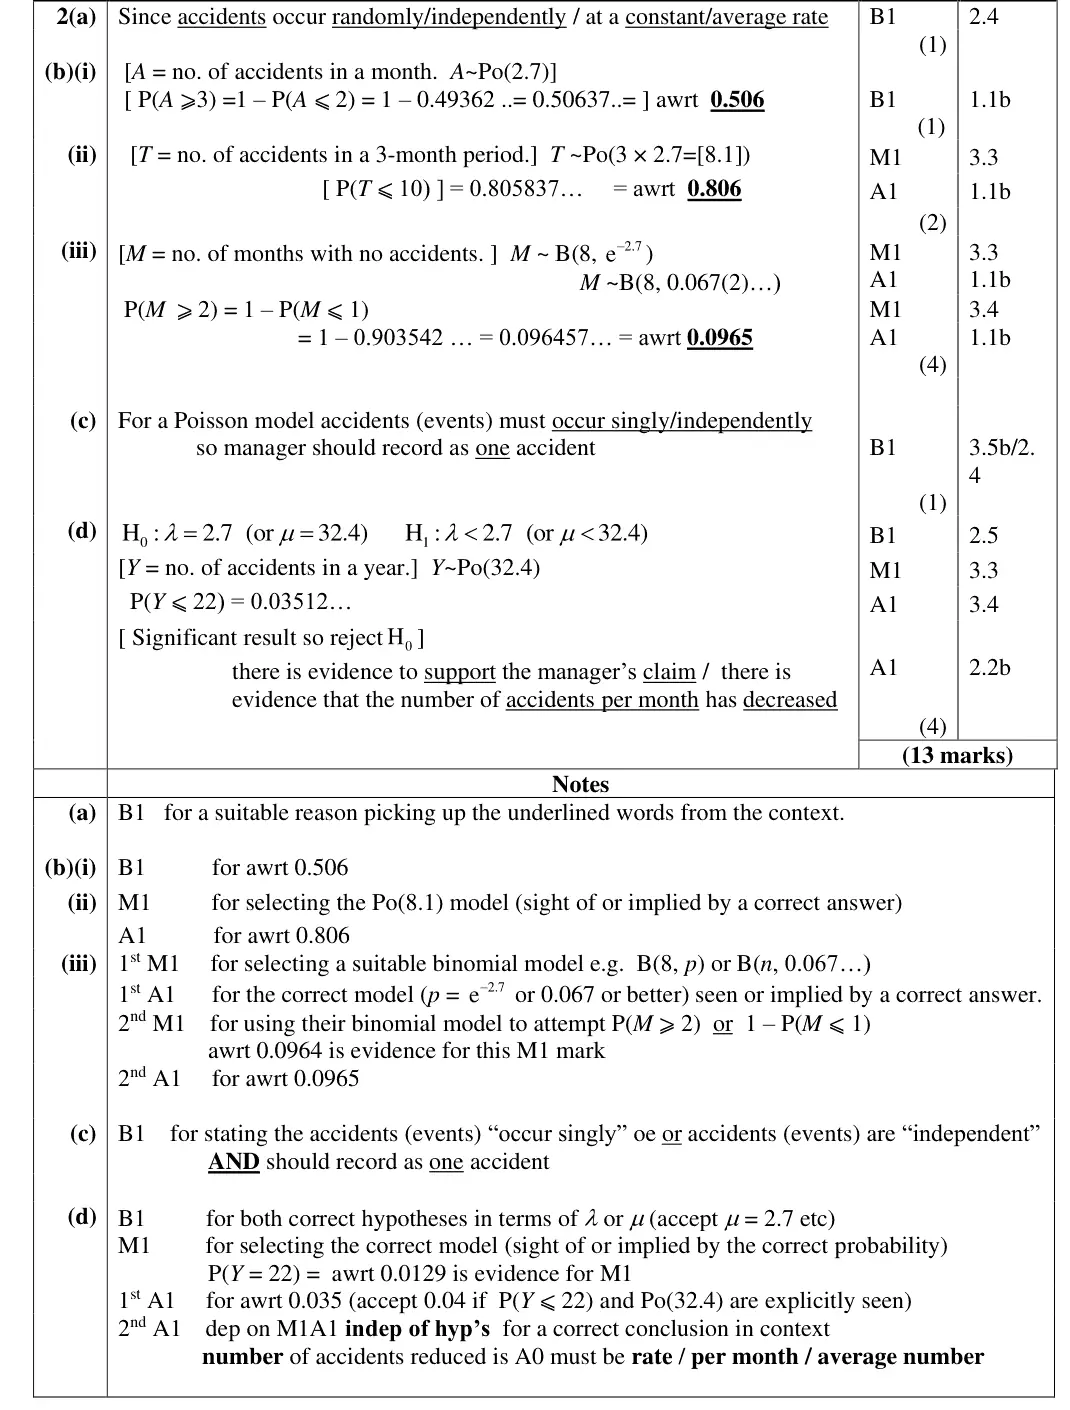
accidents occur randomly/independently or at a constant average rate (in context)
binomial-style "constant probability" answers were wrong
June 2024 · AS Paper 2 (Further Statistics 1) · Q2(b)(i)1 mark
Mark scheme (whole question; this part is marked with the orange bar)
Examiner's comment
This question required students to give answers in context which they often find difficult. Part (b)(i) was a good source of marks for most students.
Key points from the mark scheme and examiner's report
A ~ Po(2.7)
P(A ≥ 3) = 1 − P(A ≤ 2) = 0.506
June 2024 · AS Paper 2 (Further Statistics 1) · Q2(b)(ii)2 marks
Mark scheme (whole question; this part is marked with the orange bar)
Examiner's comment
This question required students to give answers in context which they often find difficult. In part (b) (ii) the new value of lambda was generally correct and also stated, when the answer was not correct a common error was calculating P(X <= 9) = 0.704 rather than the correct answer of P(X <= 10) = 0.806 In part (b) (iii) it was pleasing to see the correct new model being stated before attempting to calculate P(at least 2 months). Common incorrect methods involved either calculating P(X > 2) or using a Poisson approximation rather than the exact binomial distribution. Many lost the final accuracy mark due to premature rounding which meant their final answer was not to the required level of accuracy.
Key points from the mark scheme and examiner's report
T ~ Po(8.1)
P(T ≤ 10) = 0.806
common error P(T ≤ 9) = 0.704
June 2024 · AS Paper 2 (Further Statistics 1) · Q2(b)(iii)4 marks
Mark scheme (whole question; this part is marked with the orange bar)
Examiner's comment
This question required students to give answers in context which they often find difficult. Accuracy was also an issue in part (b)(iii).
Key points from the mark scheme and examiner's report
months with no accidents M ~ B(8, e^(−2.7) = 0.0672)
P(M ≥ 2) = 1 − P(M ≤ 1) = 0.0965
errors: P(M > 2), a Poisson approximation, premature rounding
June 2024 · AS Paper 2 (Further Statistics 1) · Q2(c)1 mark
Mark scheme (whole question; this part is marked with the orange bar)
Examiner's comment
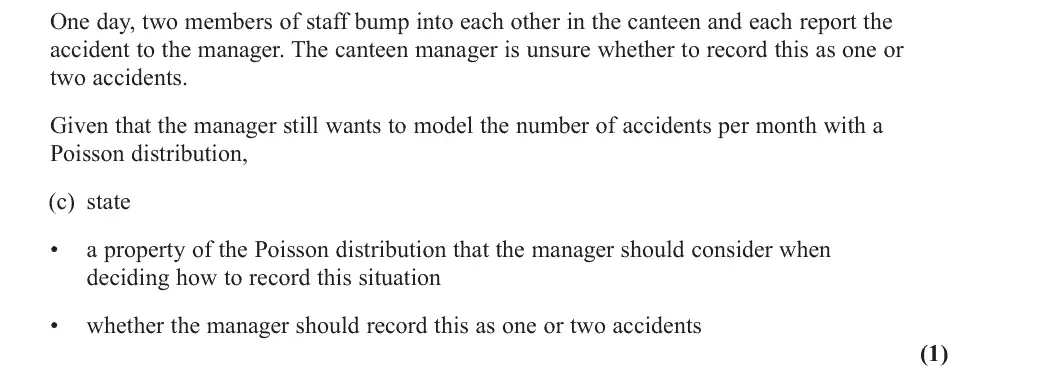
This question required students to give answers in context which they often find difficult. There were some good attempts at part (c) with many students clearly understanding the assumptions required to model using a Poisson distribution – accidents having to occur independently of each other or singly. However, many then confused this and stated that the manager should record this as two accidents (since accidents cannot happen at the same time).
Key points from the mark scheme and examiner's report
events in a Poisson process occur singly (independently), so record it as ONE accident
many stated the property then said two
June 2024 · Paper 3B (Further Statistics 1) · Q2(a)2 marks
Mark scheme (whole question; this part is marked with the orange bar)
Examiner's comment
This question covered some familiar topics. Since the question did not require candidates to give the tail probabilities explicitly, almost all candidates gained full marks on this question as they tended to use their calculators to find the critical region and stating this was sufficient
Key points from the mark scheme and examiner's report
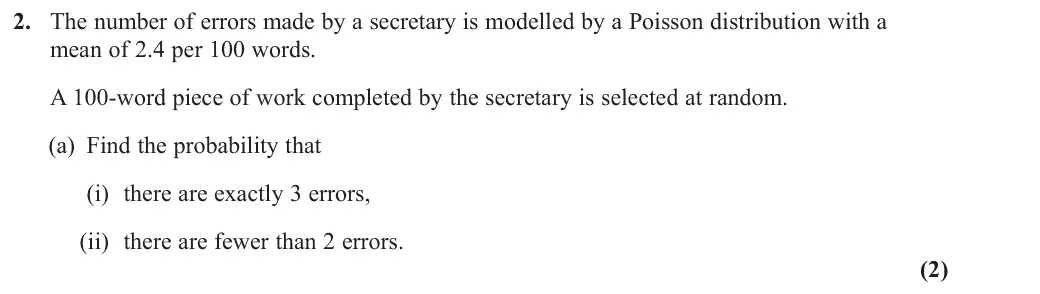
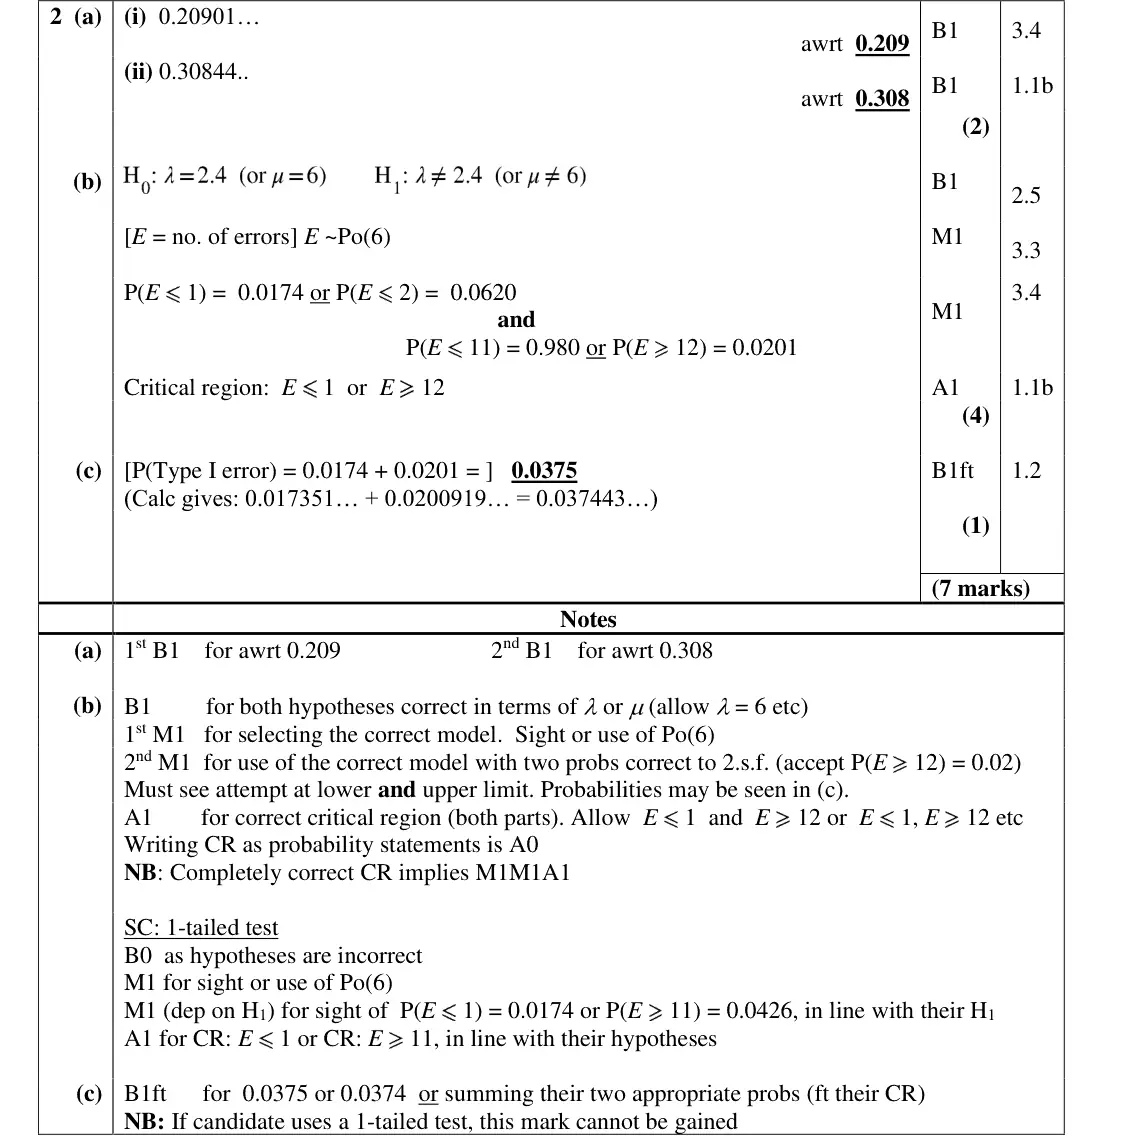
Po(2.4): (i) P(X = 3) = 0.209
(ii) P(X ≤ 1) = 0.308
June 2024 · Paper 3B (Further Statistics 1) · Q2(b)4 marks
Mark scheme (whole question; this part is marked with the orange bar)
Examiner's comment
for part (b). Candidates understood how to state a distribution clearly, they tended to use good notation throughout. The only common exception to this was that many often did not connect the two pieces of their critical region properly. However, in many cases a less than precise presentation was condoned, and candidates did not lose marks for poor notation here. While poor notation was condoned here, candidates should aim to use rigorous notation when giving critical regions in general. Candidates appeared to know what was required for the P(Type I error), though some might have been making an educated guess that this was equivalent to the actual significance level – as this is a common thing to be asked to give after a hypothesis test such as this. Barely any candidates were unfamiliar with the methods required for this question. The discriminating factor tended to be the execution of these methods. To ensure full marks on questions such as these, candidates should be sure to retain a high level of accuracy in their tail probabilities, define their distribution clearly, show their working on the way to finding their critical values, and use rigorous notation throughout.
Key points from the mark scheme and examiner's report
H0: λ = 2.4, H1: λ ≠ 2.4 per 100 words
Po(6) for 250 words
two-tailed CR E ≤ 1 (0.0174) or E ≥ 12 (0.0201)
CR must not be written as probability statements
join the two tails properly
June 2023 · AS Paper 2 (Further Statistics 1) · Q3(a)3 marks
Mark scheme (whole question; this part is marked with the orange bar)
Examiner's comment
Part (a) was quite challenging and caused a good number of candidates to think. Few answered as the mark scheme described, with most opting for trial and error. However, the majority of candidates were able to arrive at the correct answer. Many candidates were confused by which distributions to use throughout this question. The first instance of this was in part (b). A good number of students used a Poisson distribution instead of
Key points from the mark scheme and examiner's report
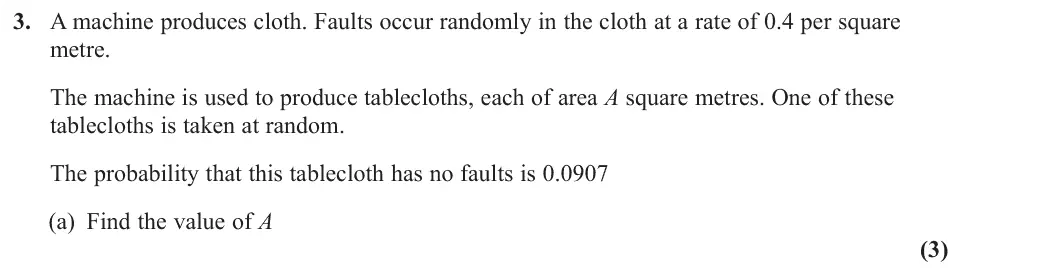
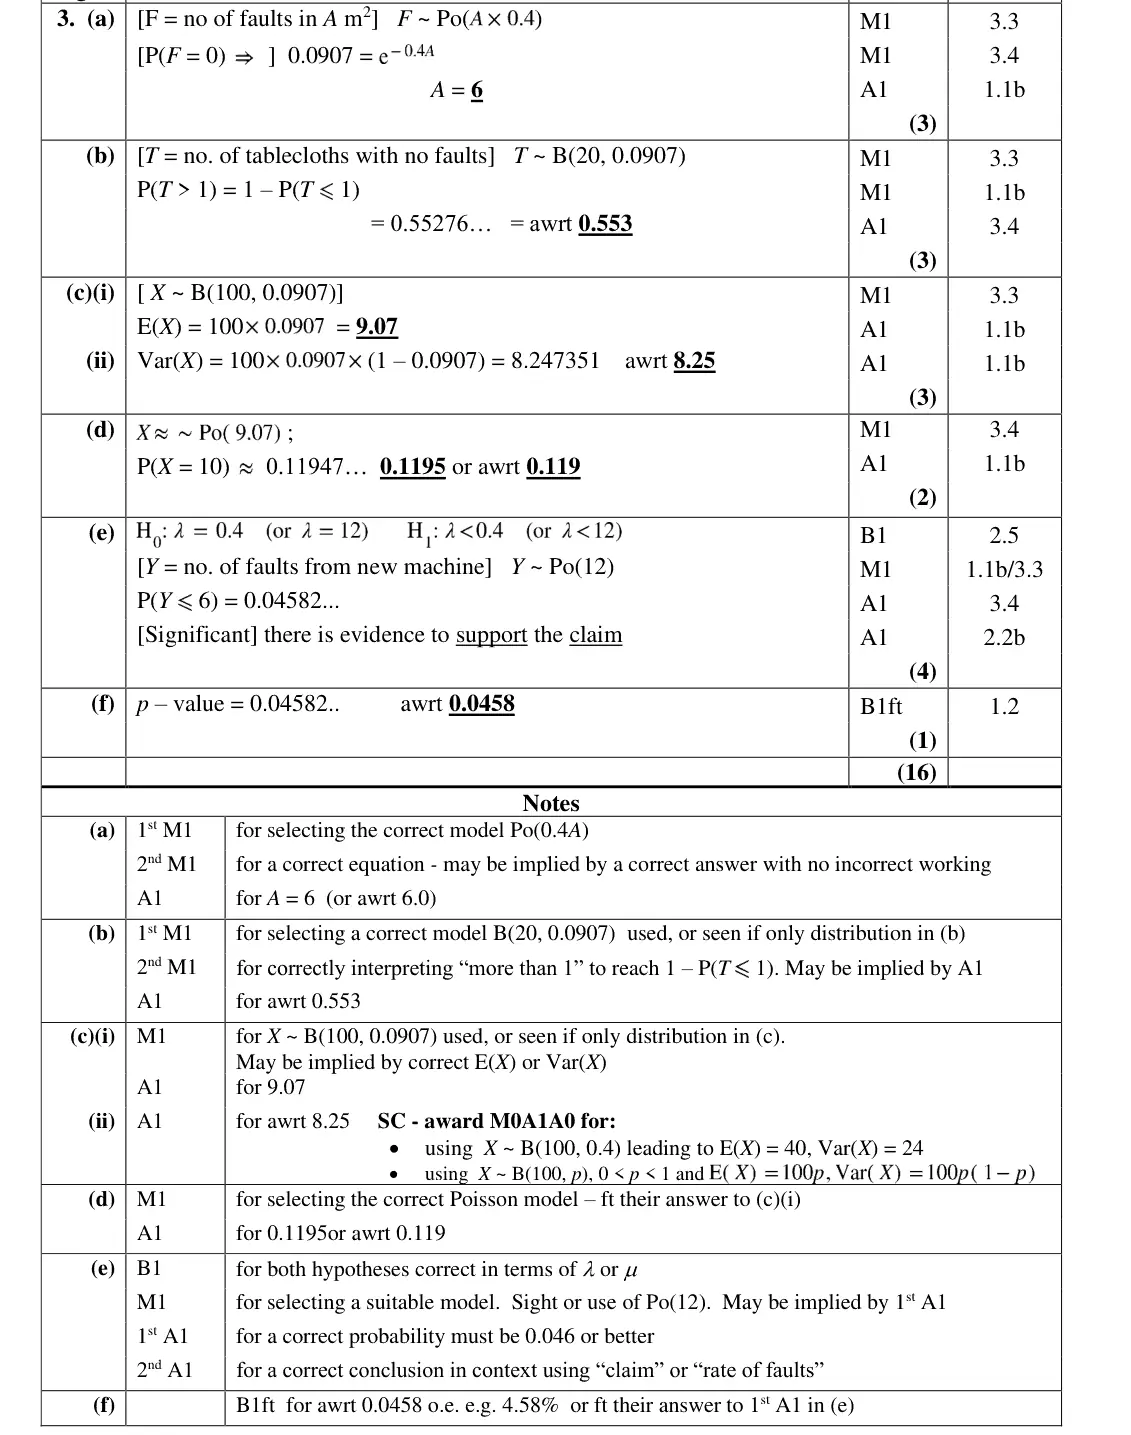
F ~ Po(0.4A)
P(F = 0) = e^(−0.4A) = 0.0907 gives A = 6
most used trial and error rather than logs
June 2023 · AS Paper 2 (Further Statistics 1) · Q3(b)3 marks
Mark scheme (whole question; this part is marked with the orange bar)
Examiner's comment
instance of this was in part (b). A good number of students used a Poisson distribution instead of Binomial. Helpfully, the mark scheme awarded a mark for correct use of inequalities in the probability statement, and as such most candidates scored at least one mark on part (b). Part (c) continued with the Binomial distribution. Candidates who correctly answered part (b) usually went on to gain the marks for part (c). Even those who used a Poisson distribution often parts (b) and (c).
Key points from the mark scheme and examiner's report
number with no faults T ~ B(20, 0.0907)
P(T > 1) = 1 − P(T ≤ 1) = 0.553
many wrongly used a Poisson here
June 2023 · AS Paper 2 (Further Statistics 1) · Q4(b)1 mark
Mark scheme (whole question; this part is marked with the orange bar)
Examiner's comment
This was quite a challenging question, and whilst most candidates scored eight or more marks out of twelve many really struggled. The worded answers required were quite nuanced and specific, and if a candidate was unable to find a value of lambda they were only able to gain half the marks. This is not unreasonable for the final question of a paper, but it did put a distinct divide between higher and lower ability candidates. Part (b) was seldom answered correctly. Most candidates gave a contextual answer linking to the problem itself rather than the Poisson distribution. The question did not direct the candidates to such an answer, but this part was an excellent way to challenge the most able candidates.
Key points from the mark scheme and examiner's report
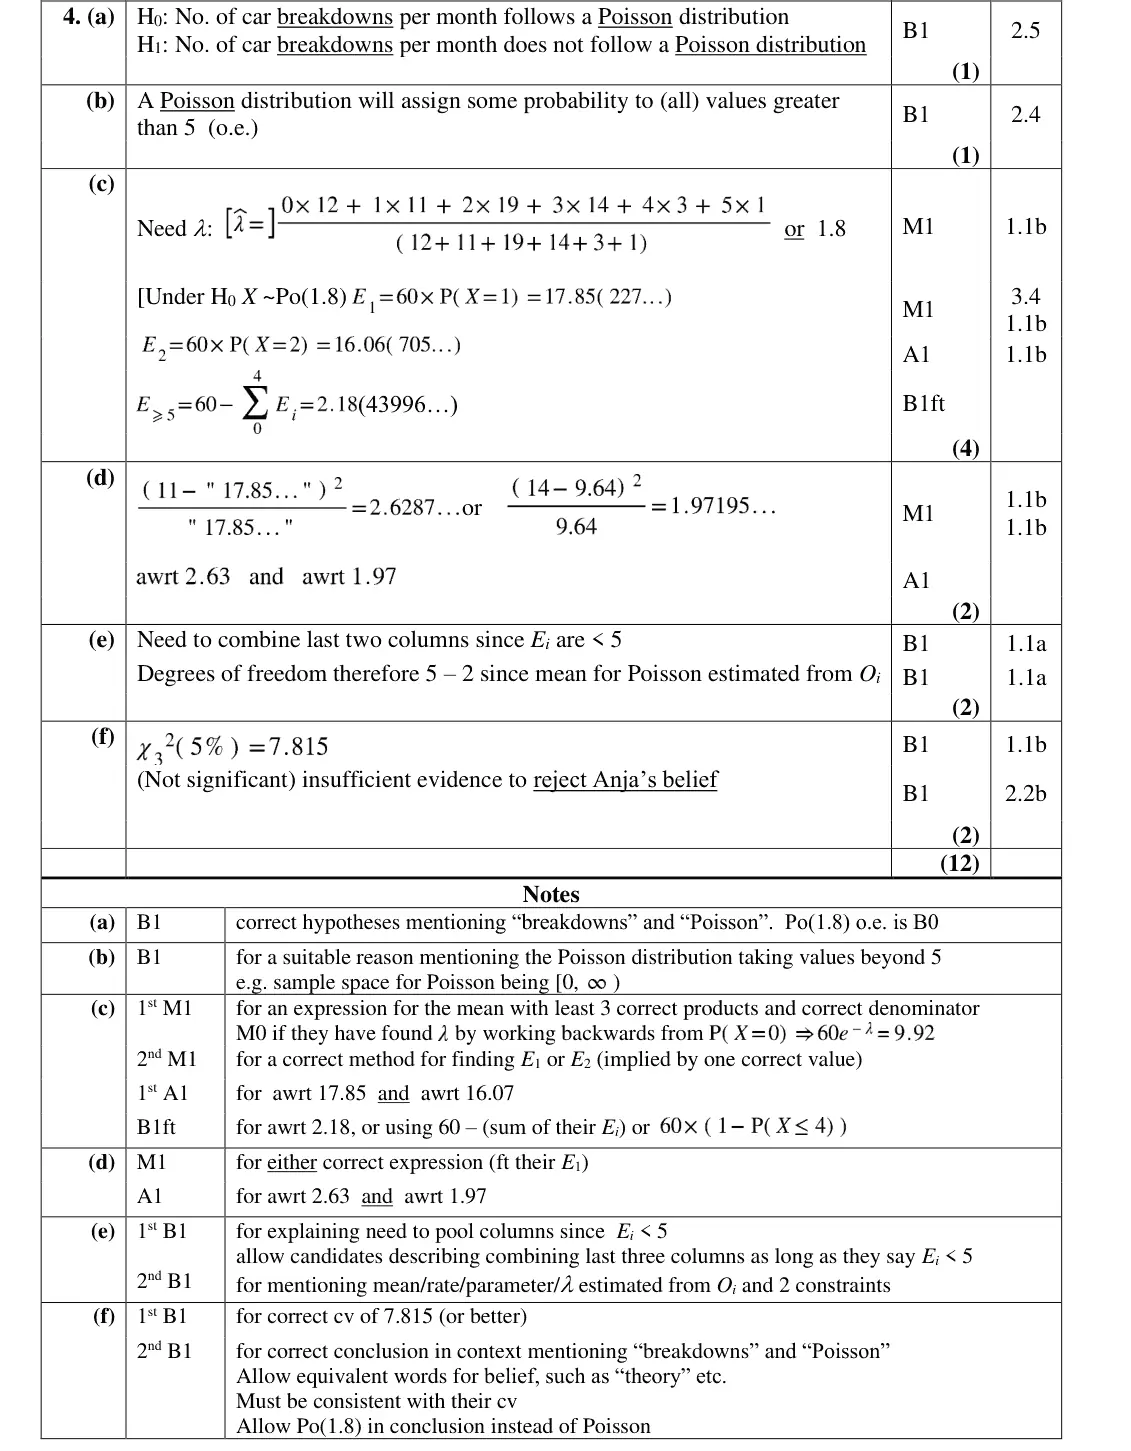
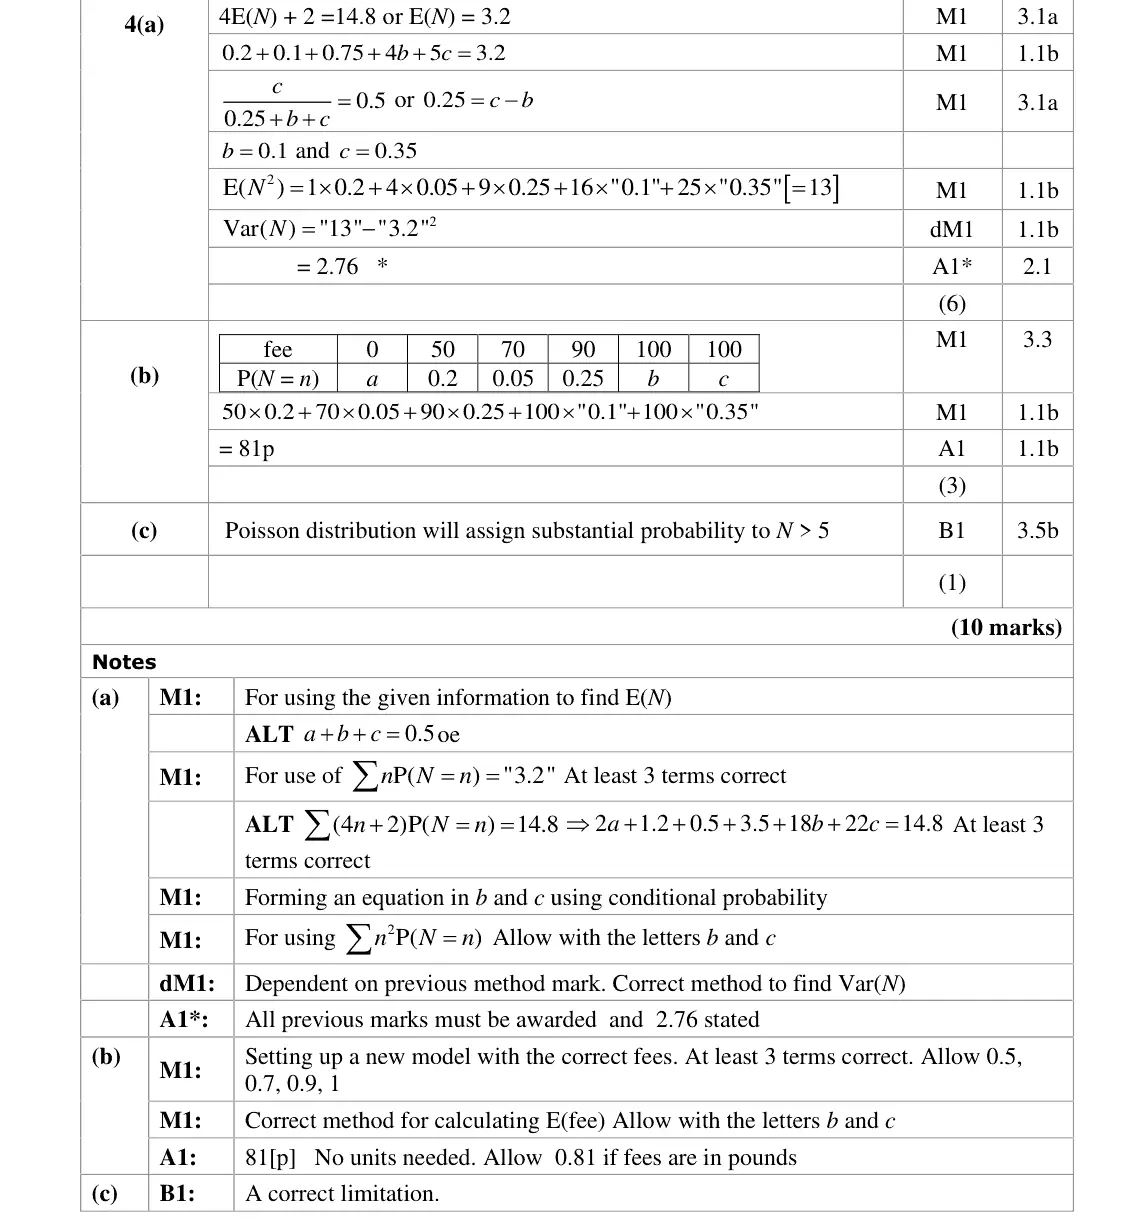
a Poisson distribution gives non-zero probability to all values above 5 (sample space 0, 1, 2, …)
contextual answers scored 0
seldom correct
June 2023 · AS Paper 2 (Further Statistics 1) · Q4(c)4 marks
Mark scheme (whole question; this part is marked with the orange bar)
Examiner's comment
This was quite a challenging question, and whilst most candidates scored eight or more marks out of twelve many really struggled. The worded answers required were quite nuanced and specific, and if a candidate was unable to find a value of lambda they were only able to gain half the marks. This is not unreasonable for the final question of a paper, but it did put a distinct divide between higher and lower ability candidates. Part (c) hinged on the candidate realising they had to find the value of lambda from the data, which is an entirely reasonable demand as it should be clear that this was needed to progress. Most candidates were able to gain the majority of the marks by finding a mean and using the Poisson distribution to calculate the frequencies. The final mark was often gained, showing candidates knew to calculate the final expected frequency in such a way to ensure the sum of the expected frequencies matched the sum of the observed frequencies. A fair few candidates obtained lambda by working backwards from a given expected frequency. Candidates who did this well could still gain three out of four marks for this question. Once a candidate did get started with part (c) the most common errors were failing to keep a suitable level of accuracy and consequently obtaining inaccurate expected frequencies, and not giving their answers to a level of accuracy matching the other expected frequencies.
Key points from the mark scheme and examiner's report
estimate λ = Σfx/60 = 1.8 (not by working back from 9.92)
E₁ = 60P(X = 1) = 17.85, E₂ = 16.07
E(≥5) = 60 − ΣEᵢ = 2.18
June 2023 · Paper 3B (Further Statistics 1) · Q2(a)4 marks
Mark scheme (whole question; this part is marked with the orange bar)
Examiner's comment
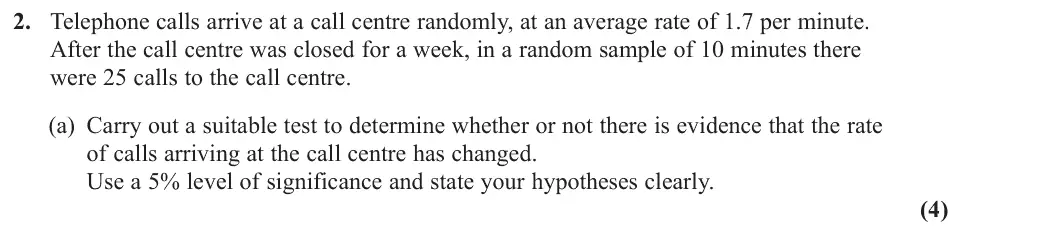
On the whole, this question proved to be one of the more demanding on the paper particularly due to part (c). Students had little difficulty in accessing the marks in part (a) and most were able to secure all 4. Most students choose hypotheses involving = 17 (rather than = 1.7) and most chose a correct two-tailed alternative. Most students successfully navigated their calculators to obtain the correct probability for P(X … 25). Most also chose to find the probability, rather than the critical region, though a typical mistake was to compare the probability to 5% rather than the required 2.5%. Nevertheless the vast majority of students completed the test accurately and were able to give a sufficiently contextual conclusion involving the rate of calls. The most typical errors in failing to secure the final mark was a non-contextual conclusion or one involving the ‘number’, rather than the rate, of calls. Almost all students were able to identify the required binomial distribution in part (b) and of
Key points from the mark scheme and examiner's report
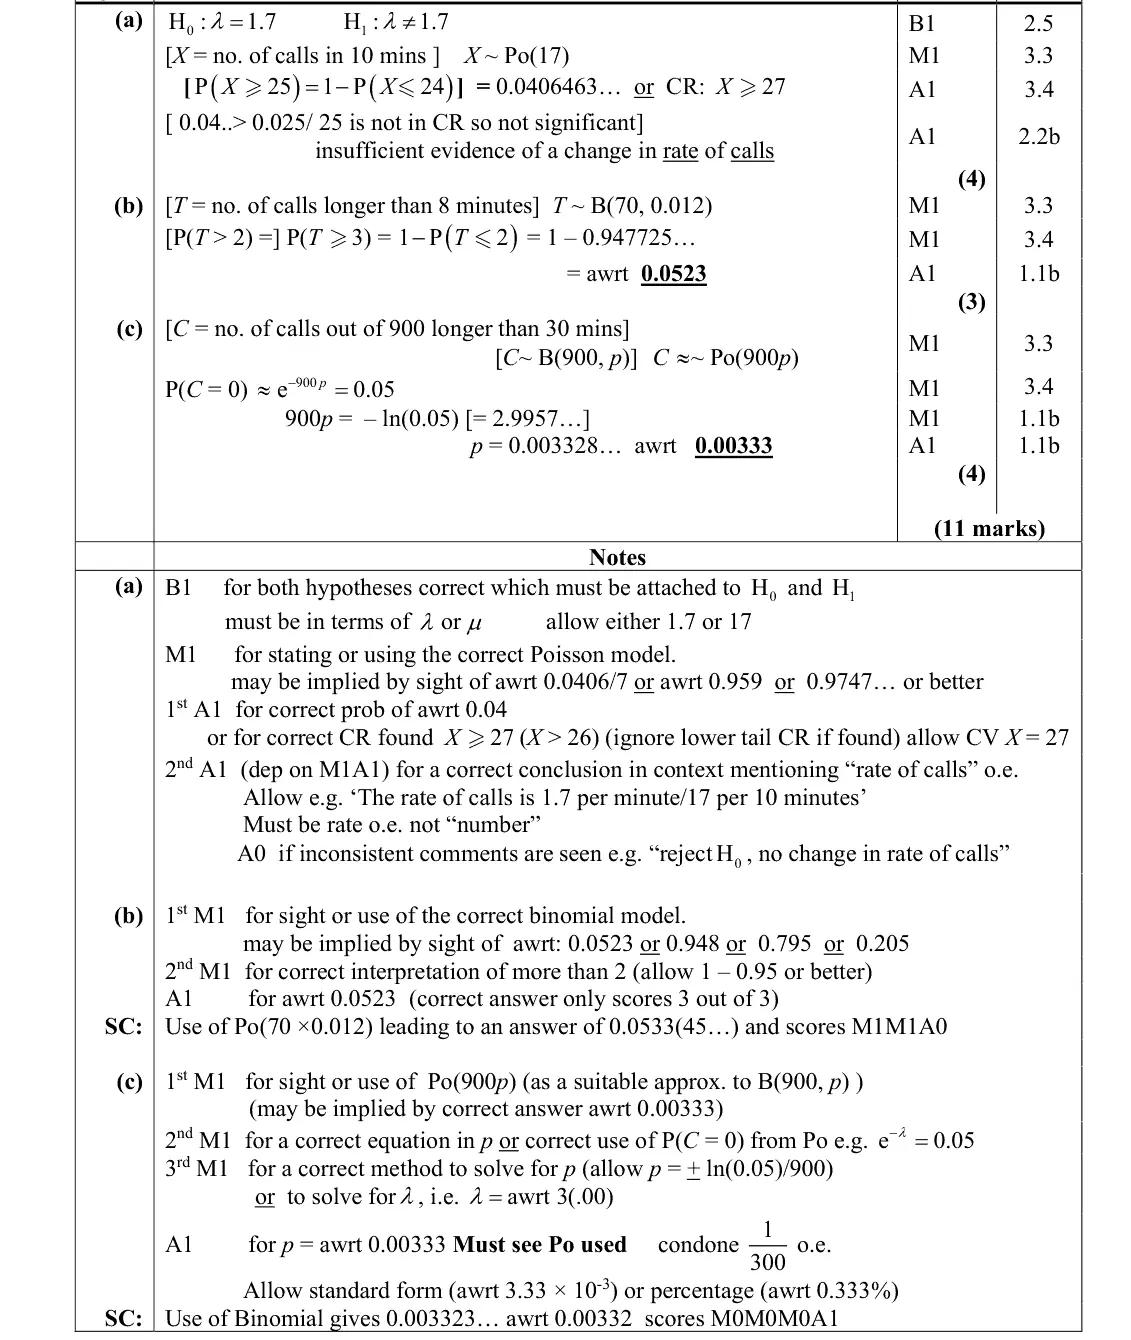
H0: λ = 1.7, H1: λ ≠ 1.7
Po(17) per 10 minutes
P(X ≥ 25) = 0.0406 > 0.025 (two-tailed), not significant: no evidence of a change in the rate of calls
comparing with 5%
conclusion must mention rate, not number
June 2023 · Paper 3B (Further Statistics 1) · Q2(c)4 marks
Mark scheme (whole question; this part is marked with the orange bar)
Examiner's comment
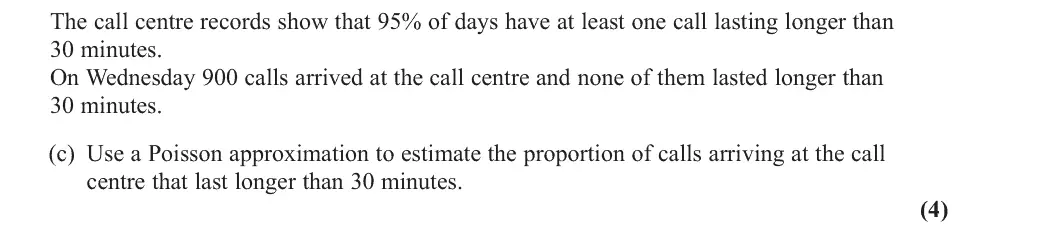
On the whole, this question proved to be one of the more demanding on the paper particularly due to part (c). Students had little difficulty in accessing the marks in part (a) and most were able to secure all 4. Most students choose hypotheses involving = 17 (rather than = 1.7) and most chose a correct two-tailed alternative. Most students successfully navigated their calculators to obtain the correct probability for P(X … 25). Most also chose to find the probability, rather than the critical region, though a typical mistake was to compare the probability to 5% rather than the required 2.5%. Nevertheless the vast majority of students completed the test accurately and were able to give a sufficiently contextual conclusion involving the rate of calls. The most typical errors in failing to secure the final mark was a non-contextual conclusion or one involving the ‘number’, rather than the rate, of calls. Almost all students were able to identify the required binomial distribution in part (b) and of Part (c) was a very good question for differentiating between the highest achievers on the paper. This part created more difficulties for the students and interpreting the information to obtain a Binomial distribution in terms of p. Many plugged in values for p. Of those students working with X ~ B(900,p) who went on to find a Poisson approximation almost all were able to correctly solve e-900p = 0.05. The most typical misconception was students using p = 0.05 and using a Poisson distribution of Po(900 x 0.05). Most were uncertain what to do with this. A few students used their calculators with a Poisson distribution or tables to find that = 3 was the closest parameter to give P(X = 0) = 0.05 and then calculated 3/900 to obtain an answer of 0.003333...
Key points from the mark scheme and examiner's report
Poisson must be seen (binomial route scores A1 only)
June 2022 · AS Paper 2 (Further Statistics 1) · Q2(a)2 marks
Mark scheme (whole question; this part is marked with the orange bar)
Examiner's comment
Part (a) was a good opening part to the question with the majority of students gaining all the marks. The main errors were attempting to use a Binomial model or calculating ( ) P 4 X = incorrectly.
Key points from the mark scheme and examiner's report
X ~ Po(3) for 5 hours
P(X = 4) = 0.168
some used a binomial model
June 2022 · AS Paper 2 (Further Statistics 1) · Q2(b)3 marks
Mark scheme (whole question; this part is marked with the orange bar)
Examiner's comment
In Part (b) the most successful students were those who formed the correct equation (from the information) and then solved the inequality / equation by taking logs of both sides. The most common error seen with this approach was not to change the inequality sign when dividing by a negative value but most students were able to select 3.1 as the minimum value using this method. Another approach used was trial and error which was more time consuming and less successful. Candidates usually started with a large range and rarely reduced it to enable them to gain the answer of 3.1
Key points from the mark scheme and examiner's report
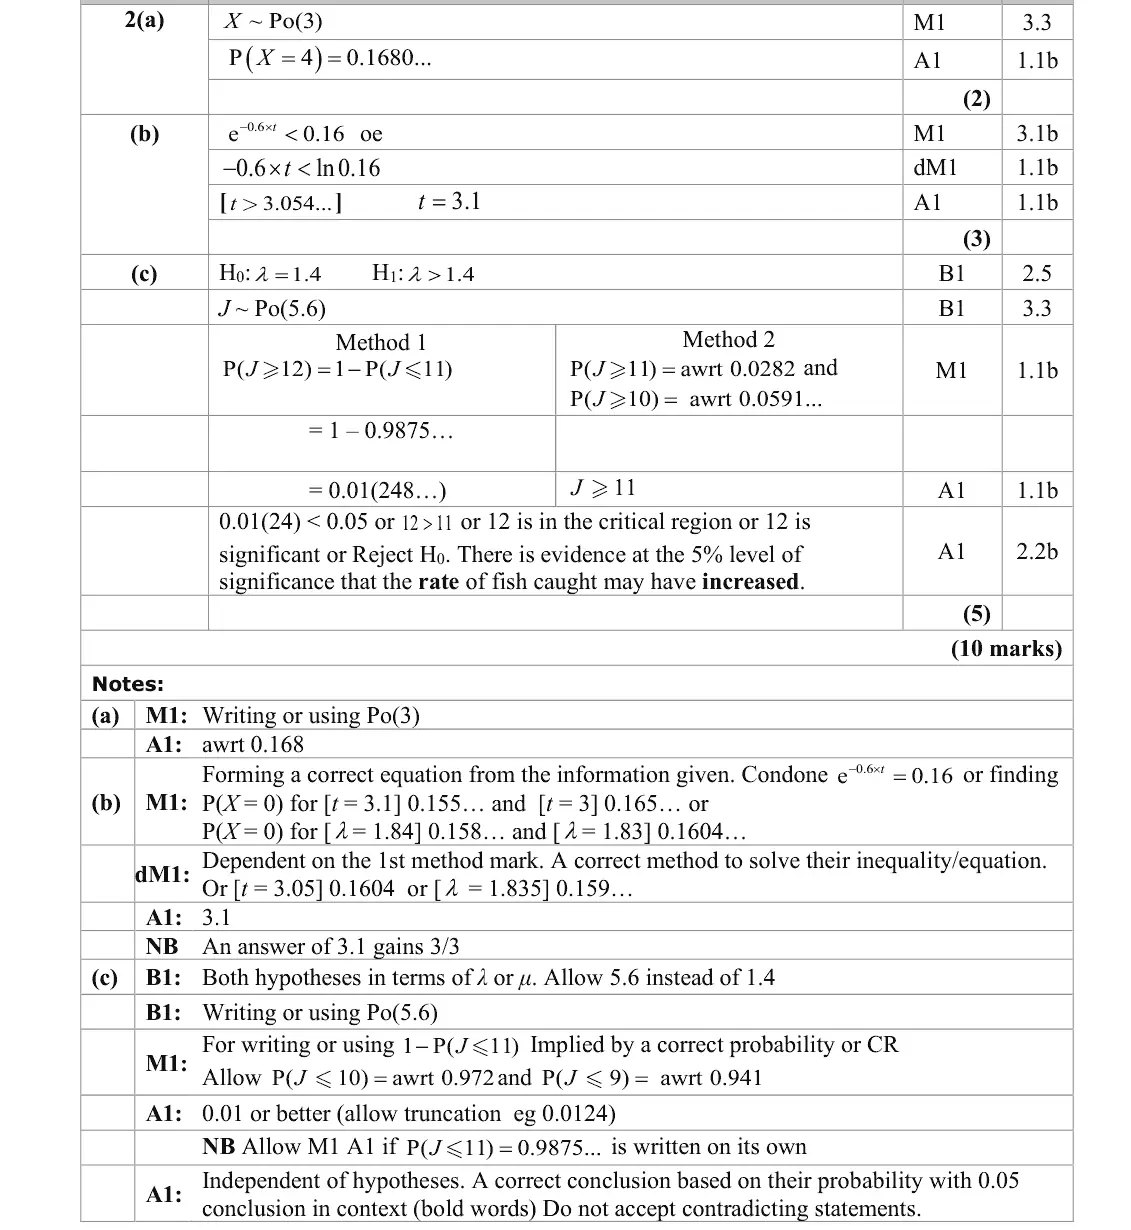
P(no fish) = e^(−0.6t) < 0.16
−0.6t < ln 0.16, t > 3.054, so t = 3.1
reverse the inequality when dividing by a negative
trial and error was slower and less successful
June 2022 · AS Paper 2 (Further Statistics 1) · Q2(c)5 marks
Mark scheme (whole question; this part is marked with the orange bar)
Examiner's comment
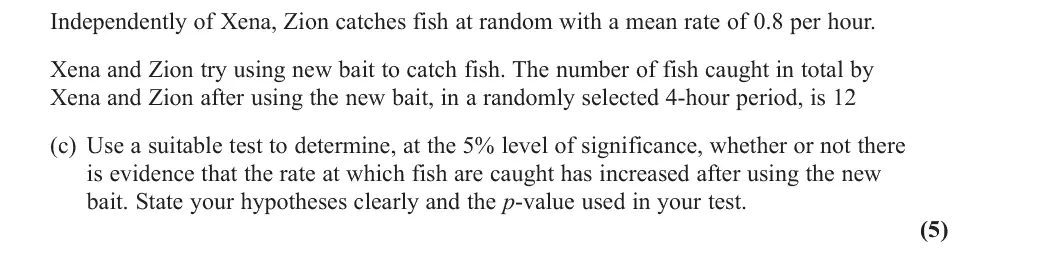
Part (c) was done well with candidates showing an understanding of conducting a hypothesis test using a Poisson distribution. The Hypotheses were generally written correctly in terms of λ or mu and with 1.4 or 5.6 and the correct way round. If this mark was lost it was using a value of 3.2, putting the hypotheses the wrong way round or giving them in words rather than using a parameter. Most students knew to use Po (5.6) with the majority writing it down, although it could be implied if they had the correct probability value. The most successful and common approach was to calculate the probability. It was pleasing to see that the conclusion given was often in context and if this mark was lost it was because of contradicting statements, or thinking it was the number of fish has increased.
Key points from the mark scheme and examiner's report
errors used 3.2, hypotheses in words, or "number of fish has increased"
June 2022 · Paper 3B (Further Statistics 1) · Q3(a)2 marks
Mark scheme (whole question; this part is marked with the orange bar)
Examiner's comment
In part (a) the majority identified and used the correct Poisson distribution though a small number used B(28, 0.4); students should be reminded to look for key words such as “rate” in this type of question. In part (b) most were able to find the probability of more than 1 call for help in a day and
Key points from the mark scheme and examiner's report
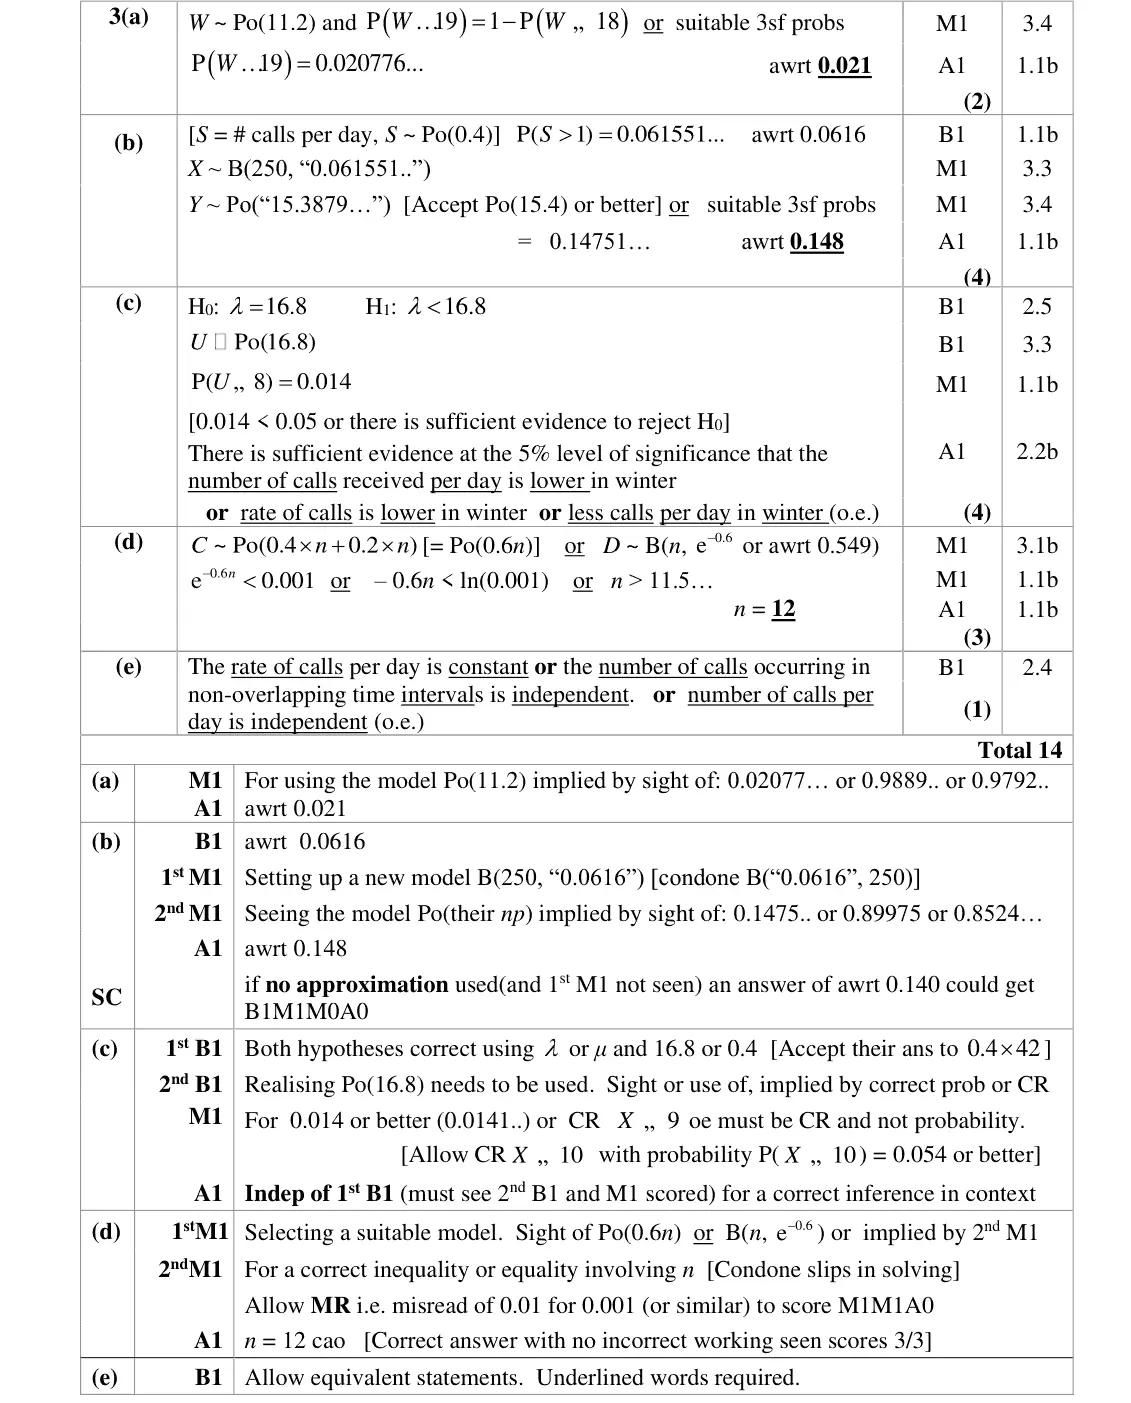
rate in 28 days: Po(11.2)
P(W ≥ 19) = 1 − P(W ≤ 18) = 0.021
B(28, 0.4) wrongly used
June 2022 · Paper 3B (Further Statistics 1) · Q3(b)4 marks
Mark scheme (whole question; this part is marked with the orange bar)
Examiner's comment
question. In part (b) most were able to find the probability of more than 1 call for help in a day and then select the correct binomial distribution. However a number failed to use a Poisson approximation to evaluate the required probability and an incorrect answer of 0.140 was often seen. The hypothesis test in part (c) was answered well with most using a suitable parameter for their
Key points from the mark scheme and examiner's report
P(S > 1) from Po(0.4) = 0.0616
B(250, 0.0616) approximated by Po(15.39)
P(≥ 20) = 0.148
no approximation gives 0.140
June 2022 · Paper 3B (Further Statistics 1) · Q3(d)3 marks
Mark scheme (whole question; this part is marked with the orange bar)
Examiner's comment
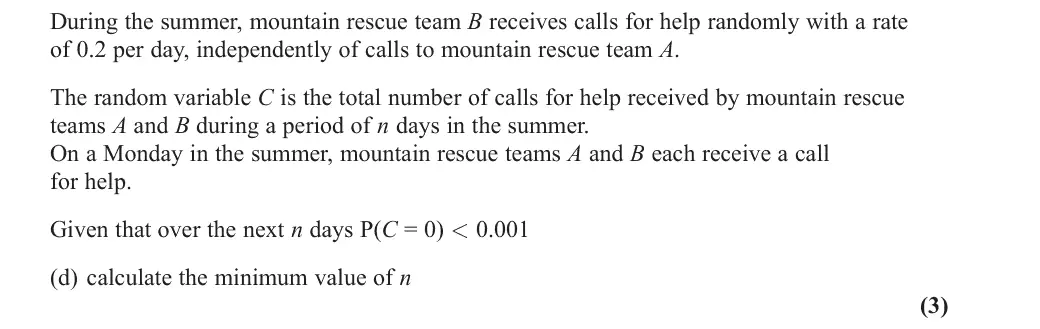
suitable. The final two parts were more discriminating. In part (d) many knew how to combine - 0.6 Poisson distributions and used Po(0.6n) or B(n, and then formed a suitable inequality but e ) some thought that they simply needed to multiply or add the individual probabilities for each rescue team. A few lost the final mark because they misread 0.001 as 0.01 which was unfortunate but both method marks could still be earned. In part (e) the majority of students simply offered a textbook
Key points from the mark scheme and examiner's report
additive property: C ~ Po(0.6n)
e^(−0.6n) < 0.001 gives n > 11.5, n = 12
Monday's calls are irrelevant
misreading 0.001 as 0.01
June 2022 · Paper 3B (Further Statistics 1) · Q3(e)1 mark
Mark scheme (whole question; this part is marked with the orange bar)
Examiner's comment
method marks could still be earned. In part (e) the majority of students simply offered a textbook answer without sufficient application to the context of the question.
Key points from the mark scheme and examiner's report
calls occur at a constant rate, or independently in non-overlapping intervals
textbook answers without context did not score
Nov 2021 · Paper 3B (Further Statistics 1) · Q2(a)2 marks
Mark scheme (whole question; this part is marked with the orange bar)
Examiner's comment
This was a well answered question although few candidates gained full marks. In part (a) as it is a "show that" question the method needs to be clear and in order to show that the answer given is 0.8883 to 4 decimal places the value calculated should be given to at least 5 decimal places.
Key points from the mark scheme and examiner's report
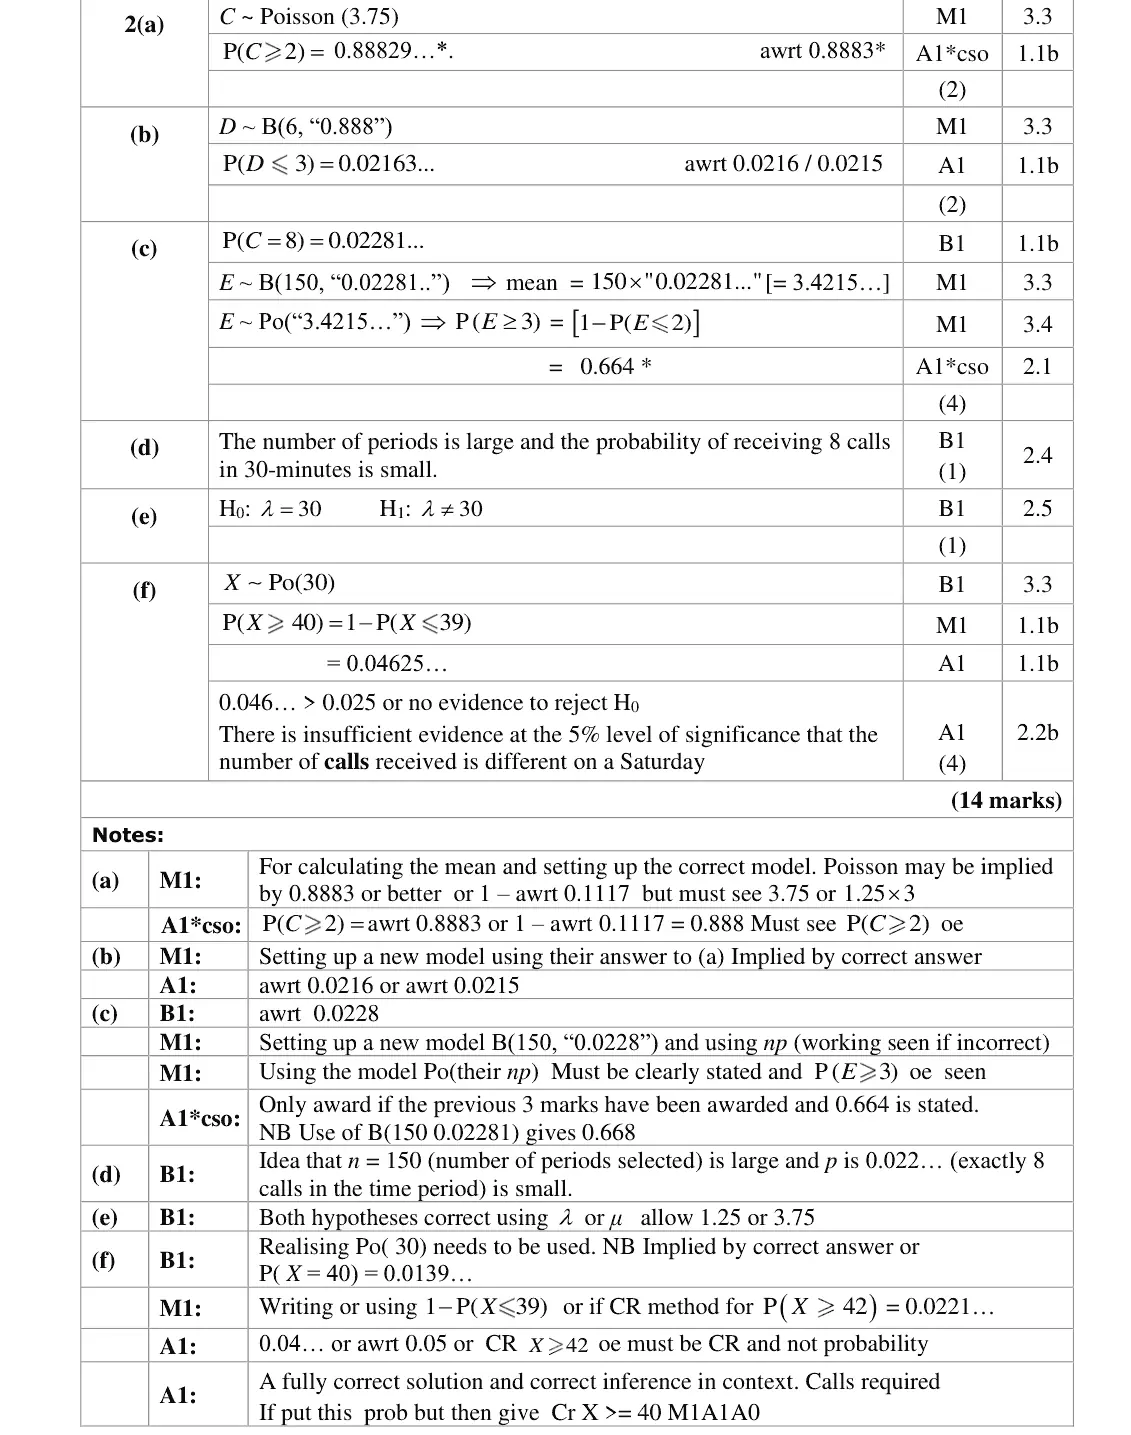
Po(3.75) per 30 minutes
P(C ≥ 2) = 0.88829…
give more figures than the printed 0.888
Nov 2021 · Paper 3B (Further Statistics 1) · Q2(c)4 marks
Mark scheme (whole question; this part is marked with the orange bar)
Examiner's comment
This was a well answered question although few candidates gained full marks. Part (c) was a good discriminator. The most common errors were • not realising they needed to work out the probability of exactly 8 calls • using the binomial distribution rather than the Poisson approximation which had been requested in the question.
Key points from the mark scheme and examiner's report
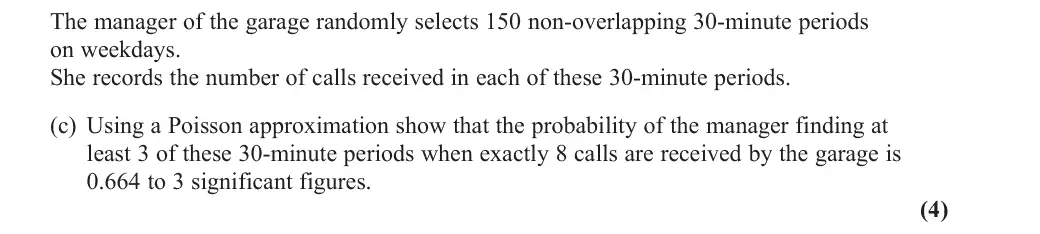
P(C = 8) = 0.02281
B(150, 0.02281) approximated by Po(3.4215)
P(E ≥ 3) = 1 − P(E ≤ 2) = 0.664
errors: not finding P(exactly 8), using the binomial instead of the requested Poisson
Nov 2021 · Paper 3B (Further Statistics 1) · Q2(f)4 marks
Mark scheme (whole question; this part is marked with the orange bar)
Examiner's comment
This was a well answered question although few candidates gained full marks. In part (f) most candidates realised they needed to use Po(30). Many candidates were then able to go on and gain full marks. There are still a number of candidates who calculate P(X = 40) rather than. It was pleasing that most candidates give their final conclusion in context.
Key points from the mark scheme and examiner's report
Po(30)
P(X ≥ 40) = 1 − P(X ≤ 39) = 0.0463 > 0.025 (two-tailed), not significant: no evidence the number of calls differs on a Saturday
P(X = 40) wrongly used
Nov 2021 · Paper 3B (Further Statistics 1) · Q4(c)1 mark
Mark scheme (whole question; this part is marked with the orange bar)
Examiner's comment
Part (c) was very poorly answered. A few students said that a Poisson distribution assigns some probability to values greater than 5 but this sort of situation will always be the case when a Poisson model is used to model a finite discrete distribution. The key feature in this case is that a substantial probability is assigned to values greater than 5 which means that the model is poor.
Key points from the mark scheme and examiner's report
maximum is 5 photographs but Po(3.2) gives substantial probability to N > 5
very poorly answered
Oct 2020 · AS Paper 2 (Further Statistics 1) · Q1(a)2 marks
Mark scheme (whole question; this part is marked with the orange bar)
Examiner's comment
Virtually all candidates were able to identify the need to model the number of call-outs by a Poisson distribution and again most used the correct distribution, Po(7.2), in part (a). Only a few candidates attempted a cumulative probability rather than the required probability, P(X = 7).
Key points from the mark scheme and examiner's report
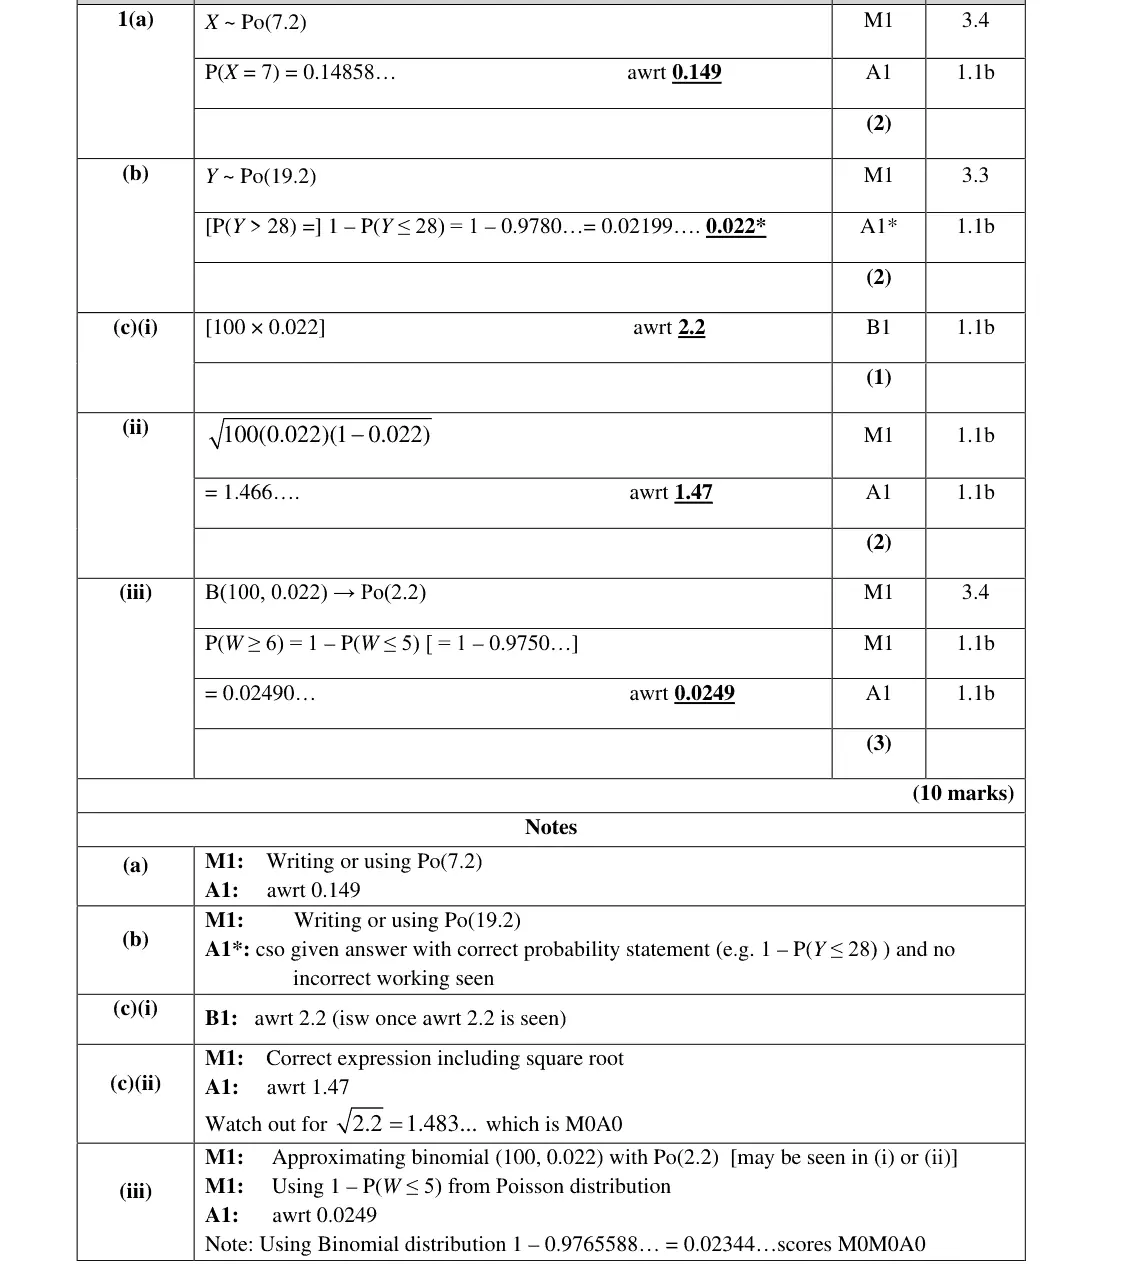
rate scales with time: X ~ Po(7.2) for 3 hours
P(X = 7) = 0.149
a few used a cumulative probability
Oct 2020 · AS Paper 2 (Further Statistics 1) · Q1(b)2 marks
Mark scheme (whole question; this part is marked with the orange bar)
Examiner's comment
Virtually all candidates were able to identify the need to model the number of call-outs by a Poisson distribution and again most used the correct distribution, Po(7.2), in part In part (b), the required answer was given in the question so candidates are expected to show sufficient working as to how they arrived at their answer. Most gave a correct probability statement and followed this with a 4 (or more) decimal place 0.0219… answer which made it clear how they obtained the given answer of 0.022. Of the errors seen, the most common was to use P(Y > 28) = 1 – P(Y < 27). Although the formulae for the mean and variance of a binomial distribution are given in the formula booklet, a surprising number of candidates left parts (c)(i) and (c)(ii) blank.
Key points from the mark scheme and examiner's report
Y ~ Po(19.2)
P(Y > 28) = 1 − P(Y ≤ 28) = 0.02199 (show 4 d.p. for the given answer)
common error 1 − P(Y ≤ 27)
Oct 2020 · AS Paper 2 (Further Statistics 1) · Q4(a)2 marks
Mark scheme (whole question; this part is marked with the orange bar)
Examiner's comment
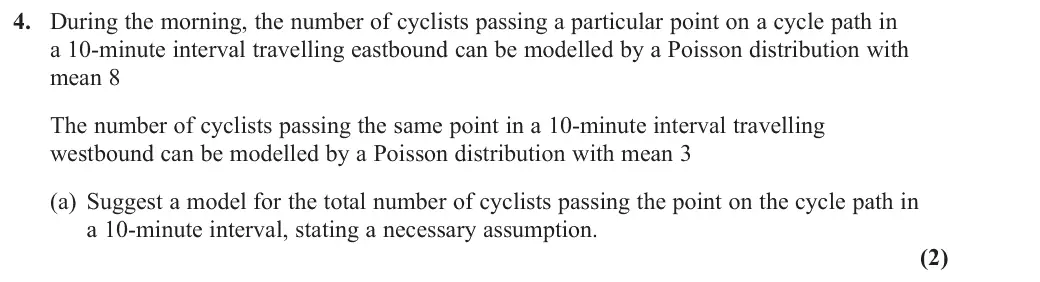
Most were able to identify the correct Poisson distribution in part (a) but many just listed stock answers when stating the necessary modelling assumption. An answer in context about the independence of the cyclists was required. Having already been told that the number of cyclists in each direction can be modelled by a Poisson distribution, the question here focussed on why the two distributions could be added to form Po(11).
Key points from the mark scheme and examiner's report
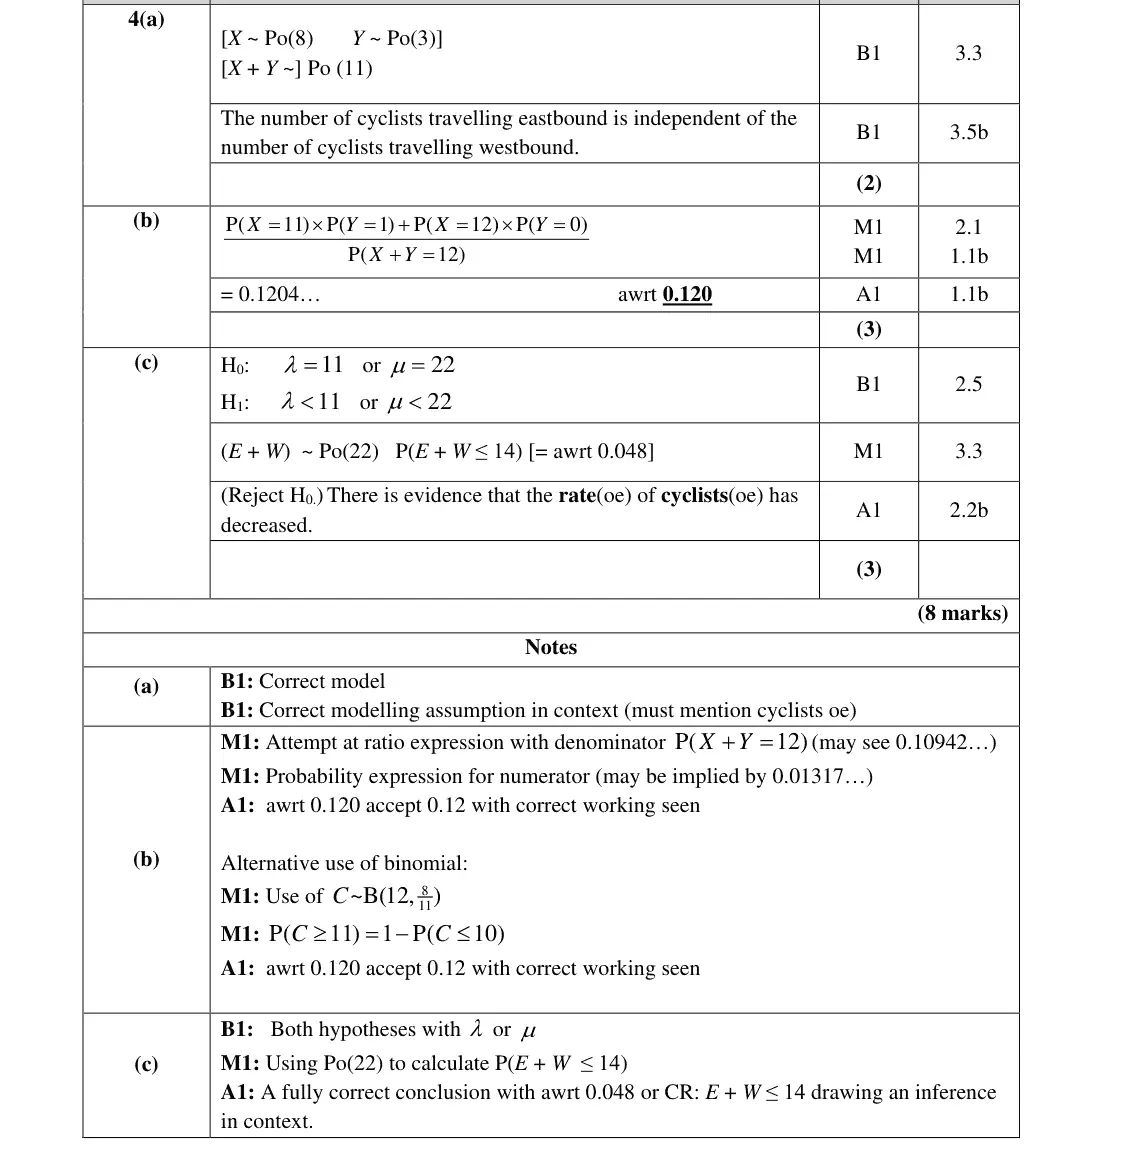
additive property: total ~ Po(11)
assumption in context: numbers of eastbound and westbound cyclists are independent
stock answers without context lost the mark
Oct 2020 · AS Paper 2 (Further Statistics 1) · Q4(b)3 marks
Mark scheme (whole question; this part is marked with the orange bar)
Examiner's comment
Part (b) was one of the most discriminating parts of the paper and a fully correct response using conditional probabilities and the Poisson distribution were rarely seen. The most common successful method was to use and to calculateP( ~B(12, ) C 11) C >= 8 11 . A number of fully correct hypothesis tests were seen in part (c) with most conclusions
Key points from the mark scheme and examiner's report
conditional probability [P(X = 11)P(Y = 1) + P(X = 12)P(Y = 0)] / P(X + Y = 12) = 0.120, or C ~ B(12, 8/11), P(C ≥ 11)
one of the most discriminating parts
Oct 2020 · Paper 3B (Further Statistics 1) · Q1(a)(i)2 marks
Mark scheme (whole question; this part is marked with the orange bar)
Examiner's comment
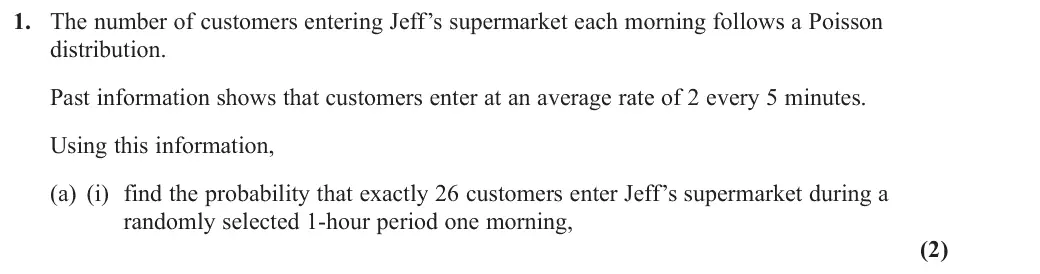
Part (a) was generally accessible with many scoring well. For part (i) most used the calculator function but some did write out the full calculation of the probability required. A small number of candidates gave an answer with less than the required 3 significant figure accuracy.
Key points from the mark scheme and examiner's report
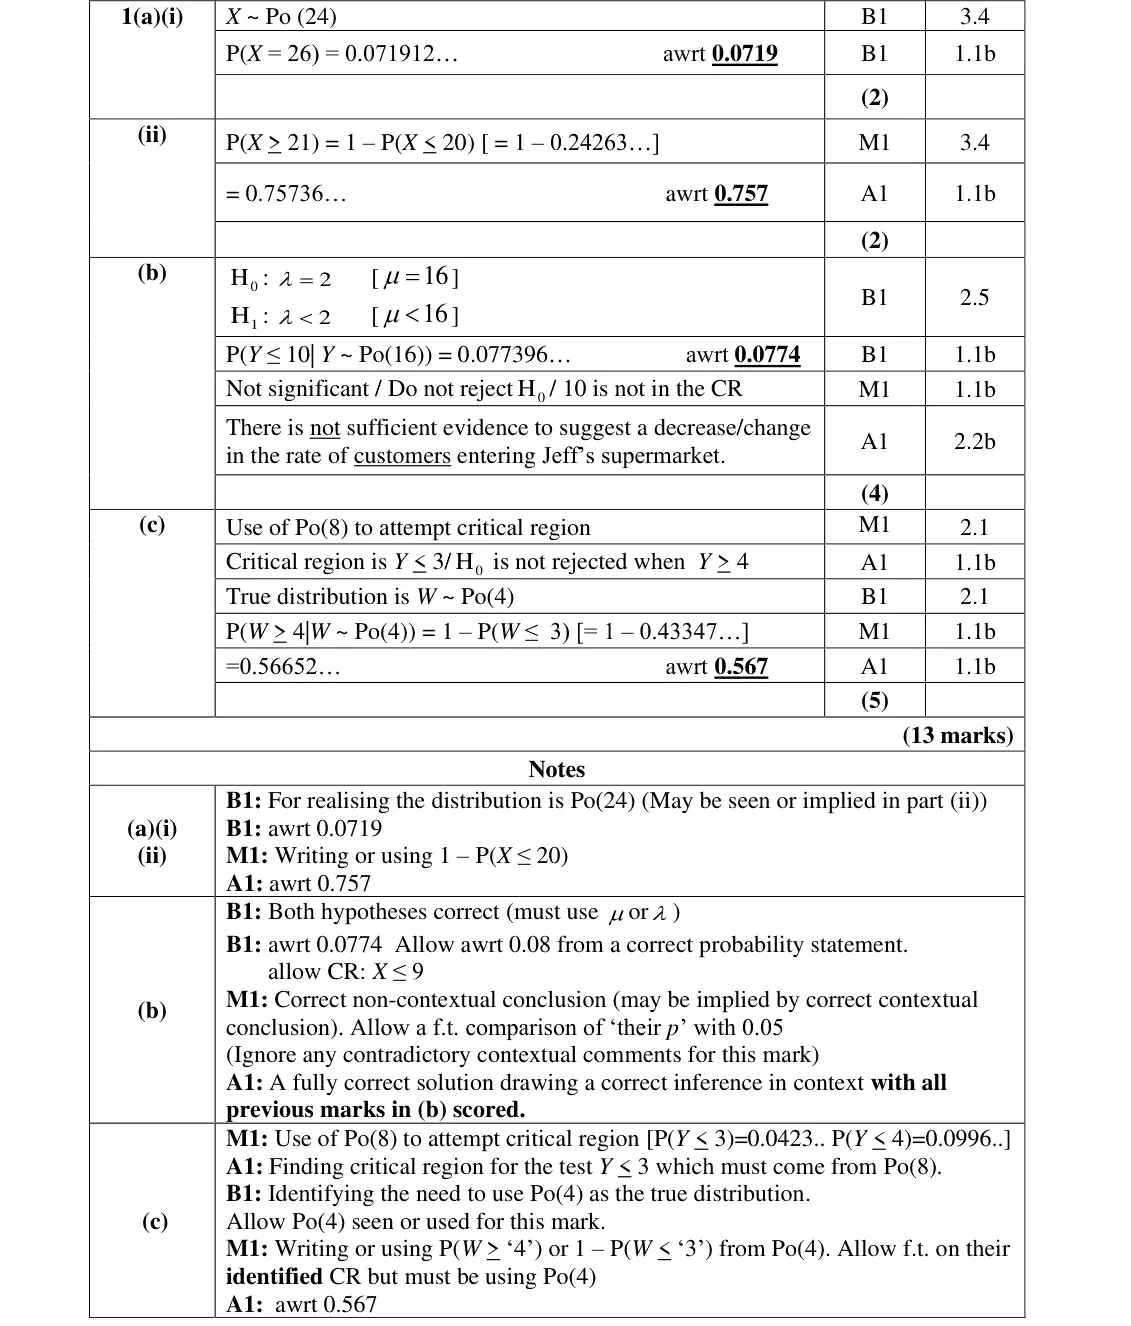
scale the rate: Po(24) per hour
P(X = 26) = 0.0719
give 3 s.f.
Oct 2020 · Paper 3B (Further Statistics 1) · Q1(a)(ii)2 marks
Mark scheme (whole question; this part is marked with the orange bar)
Examiner's comment
Part (a) was generally accessible with many scoring well. For part (i) most used the calculator function but some did write out the full calculation of the probability required. A small number of candidates gave an answer with less than the required 3 significant figure accuracy. In part (b) the majority of candidates were successful, but on some occasions some did not form appropriate hypotheses in terms of a parameter. A common error was the minority finding P(X=10) instead of the tail probability. Most took the easier route of finding the probability to compare with 5%, rather than finding the critical region. The interpretation of the found probability was generally correct and in context but there were a few who thought a ‘value’ higher than 0.05 was significant. Part (c) was far more challenging for many. Most gained some access by understanding the need to use Po(4) as the true distribution but often they used this distribution to try and identify the critical region. Many looked for a right-hand critical region not realising that 1 in five minutes is a lower rate than 2 in five minutes. Many did not make their method clear. If they had more explicitly identified what they thought was the critical region, then further credit may have been gained. A few blank responses were seen here.
Key points from the mark scheme and examiner's report
P(X ≥ 21) = 1 − P(X ≤ 20) = 0.757
Oct 2020 · Paper 3B (Further Statistics 1) · Q1(b)4 marks
Mark scheme (whole question; this part is marked with the orange bar)
Examiner's comment
In part (b) the majority of candidates were successful, but on some occasions some did not form appropriate hypotheses in terms of a parameter. A common error was the minority finding P(X=10) instead of the tail probability. Most took the easier route of finding the probability to compare with 5%, rather than finding the critical region. The interpretation of the found probability was generally correct and in context but there were a few who thought a ‘value’ higher than 0.05 was significant.
Key points from the mark scheme and examiner's report
H0: λ = 2, H1: λ < 2 (per 5 min), so Po(16) for 40 minutes
P(Y ≤ 10) = 0.0774 > 0.05, not significant, no evidence of a decrease
some found P(Y = 10) instead of the tail
hypotheses must use a parameter
Oct 2020 · Paper 3B (Further Statistics 1) · Q2(b)1 mark
Mark scheme (whole question; this part is marked with the orange bar)
Examiner's comment
Many candidates earned the mark in part (b) for mention of independence although for some it seemed more they were listing conditions for events to be Poisson modelled, rather than conditions for combining variables. Common comments that did not score suggested X and Y had to be over the same interval. Whilst many correctly found the variance of W, often they did not then go on to use it with the Po(7) model to answer the question. Some poor understanding was demonstrated with statements such as P(7 < 2.4) or P(Po(7) < 2.4)
Key points from the mark scheme and examiner's report
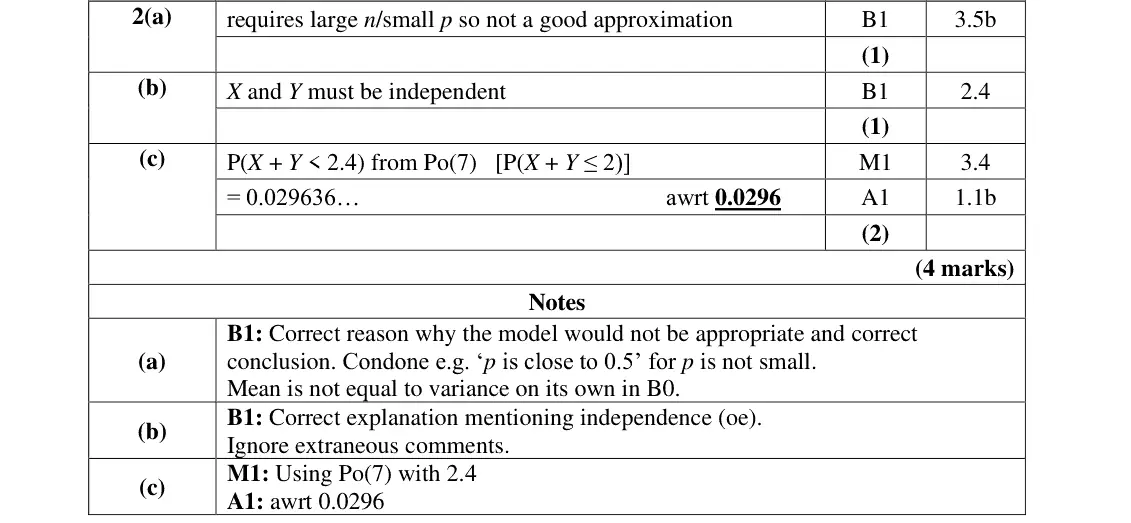
X and Y must be independent
"same interval" did not score
Oct 2020 · Paper 3B (Further Statistics 1) · Q2(c)2 marks
Mark scheme (whole question; this part is marked with the orange bar)
Examiner's comment
In part (a) many recognised this as a poor approximation due to p not being small and/or n not being large. Those not scoring thought 10 was large for n, or more commonly simply compared mean with variance. Some thought it was indeed a good approximation since 10 x 0.4 = 4. Many candidates earned the mark in part (b) for mention of independence although for some it seemed more they were listing conditions for events to be Poisson modelled, rather than conditions for combining variables. Common comments that did not score suggested X and Y had to be over the same interval. Whilst many correctly found the variance of W, often they did not then go on to use it with the Po(7) model to answer the question. Some poor understanding was demonstrated with statements such as P(7 < 2.4) or P(Po(7) < 2.4)
Key points from the mark scheme and examiner's report
Var(W) = 10 × 0.4 × 0.6 = 2.4
P(X + Y ≤ 2) from Po(7) = 0.0296
many found Var(W) but did not go on
June 2019 · AS Paper 2 (Further Statistics 1) · Q3(a)2 marks
Mark scheme (whole question; this part is marked with the orange bar)
Examiner's comment
Only few candidates did not realise the significance of the terms “random” and “average rate” and used binomial rather than Poisson models throughout the question but for most candidates this question provided a good source of marks. In part (a) the most frequent error was a mis-interpretation of the phrase “fewer than 2” with many simply finding the probability of less than or equal to 2. Responses to part (b) were often better and most found the new Poisson distribution and used it correctly. Part (c)
Key points from the mark scheme and examiner's report
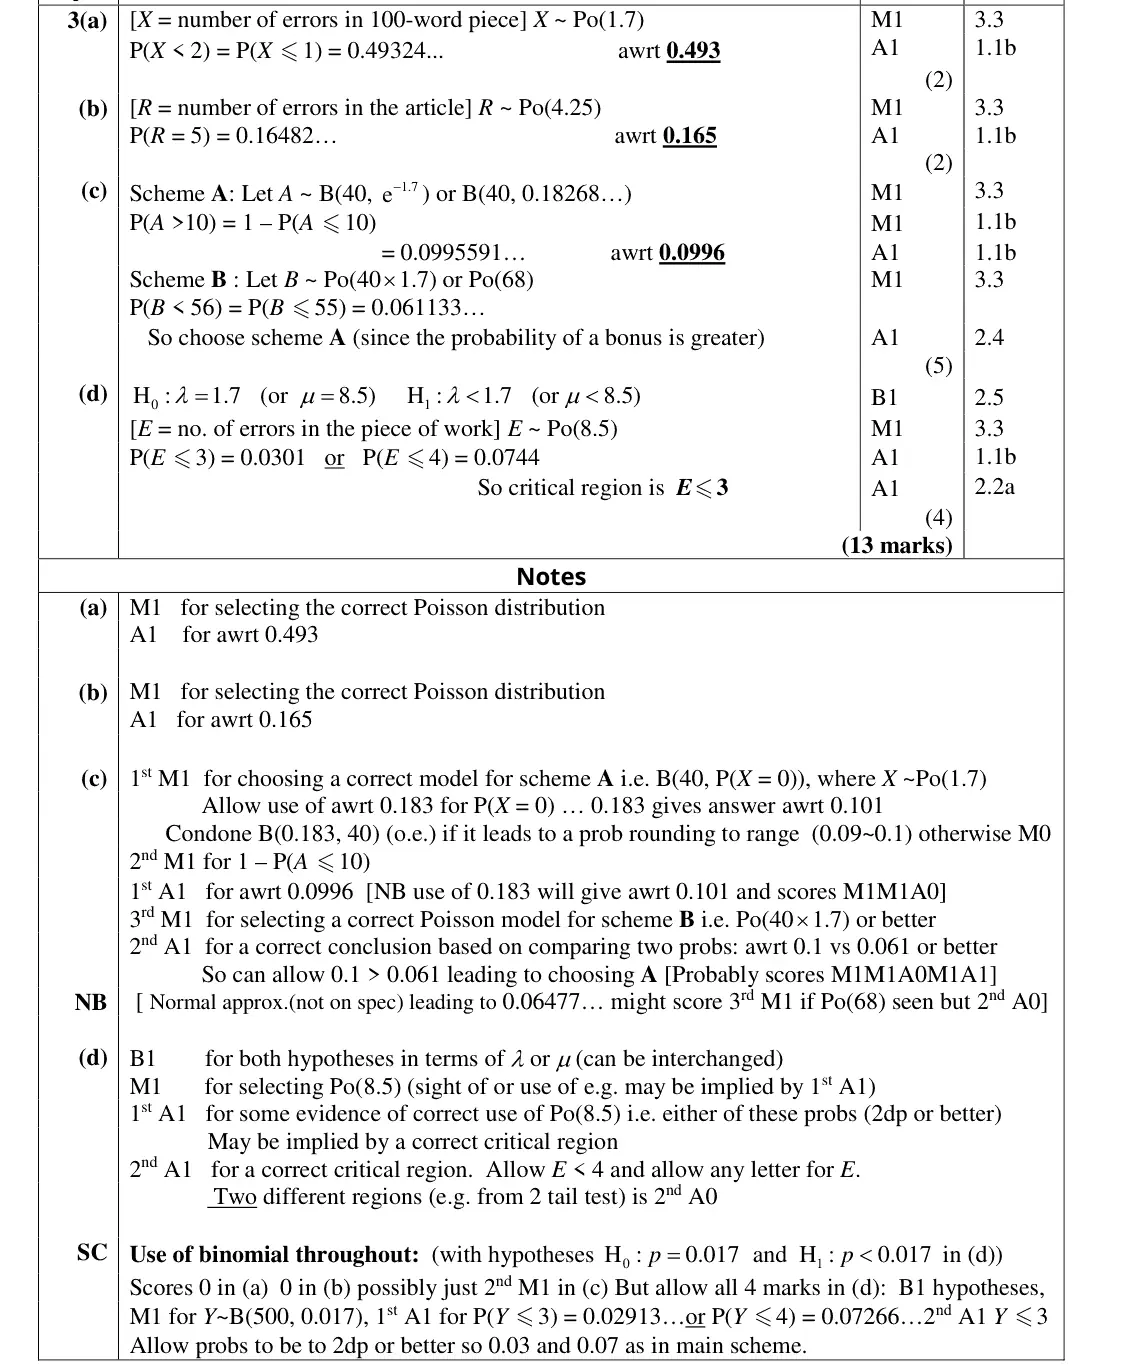
X ~ Po(1.7)
P(X < 2) = P(X ≤ 1) = 0.493
common error finding P(X ≤ 2)
some wrongly used a binomial model throughout
June 2019 · AS Paper 2 (Further Statistics 1) · Q3(b)2 marks
Mark scheme (whole question; this part is marked with the orange bar)
Examiner's comment
Only few candidates did not realise the significance of the terms “random” and “average rate” and used binomial rather than Poisson models throughout the question but for most candidates this question to part (b) were often better and most found the new Poisson distribution and used it correctly. Part (c) was the most challenging part of the question with many unable to work out the probability connected with scheme A. Most realised there was something to do with a Po(1.7) model but far fewer realising that finding P(X = 0), where X~Po(1.7), was giving them a parameter in a binomial model. Those who realised this often failed to use sufficient accuracy to achieve their final probability correct to 3 significant figures and Y~ B(40, 0.183) was commonly used. The next problem was interpreting “more than 10” correctly and many failed to use 1 – P(Y 10). There was often more success with the probability associated with scheme B and those who had correct probabilities were usually able to correctly recommend scheme A. There were many correct answers to part (d) with hypotheses usually
Key points from the mark scheme and examiner's report
rescale the rate: R ~ Po(4.25) for 250 words
P(R = 5) = 0.165
June 2019 · AS Paper 2 (Further Statistics 1) · Q3(c)5 marks
Mark scheme (whole question; this part is marked with the orange bar)
Examiner's comment
Only few candidates did not realise the significance of the terms “random” and “average rate” and used binomial rather than Poisson models throughout the question but for most candidates this question to part (b) were often better and most found the new Poisson distribution and used it correctly. Part (c) was the most challenging part of the question with many unable to work out the probability connected with scheme A. Most realised there was something to do with a Po(1.7) model but far fewer realising that finding P(X = 0), where X~Po(1.7), was giving them a parameter in a binomial model. Those who realised this often failed to use sufficient accuracy to achieve their final probability correct to 3 significant figures and Y~ B(40, 0.183) was commonly used. The next problem was interpreting “more than 10” correctly and many failed to use 1 – P(Y 10). There was often more success with the probability associated with scheme B and those who had correct probabilities were usually able to correctly recommend scheme A. There were many correct answers to part (d) with hypotheses usually
Key points from the mark scheme and examiner's report
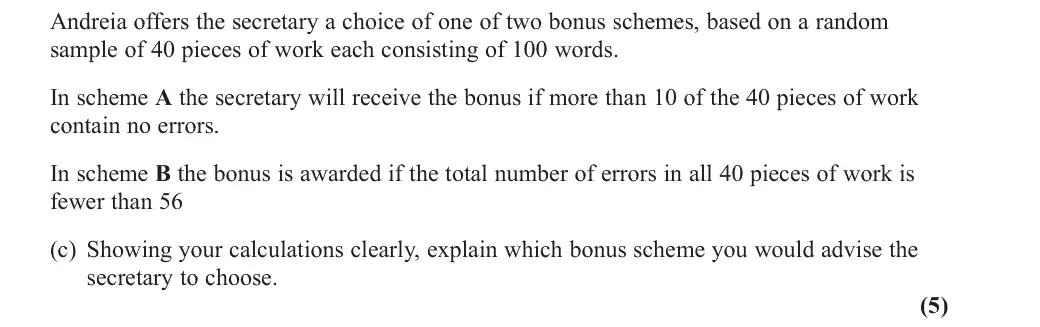
scheme A: B(40, e^(−1.7) = 0.18268), P(A > 10) = 1 − P(A ≤ 10) = 0.0996 (rounding p to 0.183 gives 0.101 and loses accuracy)
scheme B: Po(68), P(B ≤ 55) = 0.0611
choose A
many did not see that P(X = 0) gives the binomial parameter
June 2019 · Paper 3B (Further Statistics 1) · Q2(a)3 marksEasy
Mark scheme (whole question; this part is marked with the orange bar)
Examiner's comment
This was another well answered question with over 50% of the candidates scoring full marks. Most identified the Poisson distribution as a suitable model here and usually they had the correct mean too. A number lost marks here over the interpretation of “more than 4 calls” and statements such as
Key points from the mark scheme and examiner's report
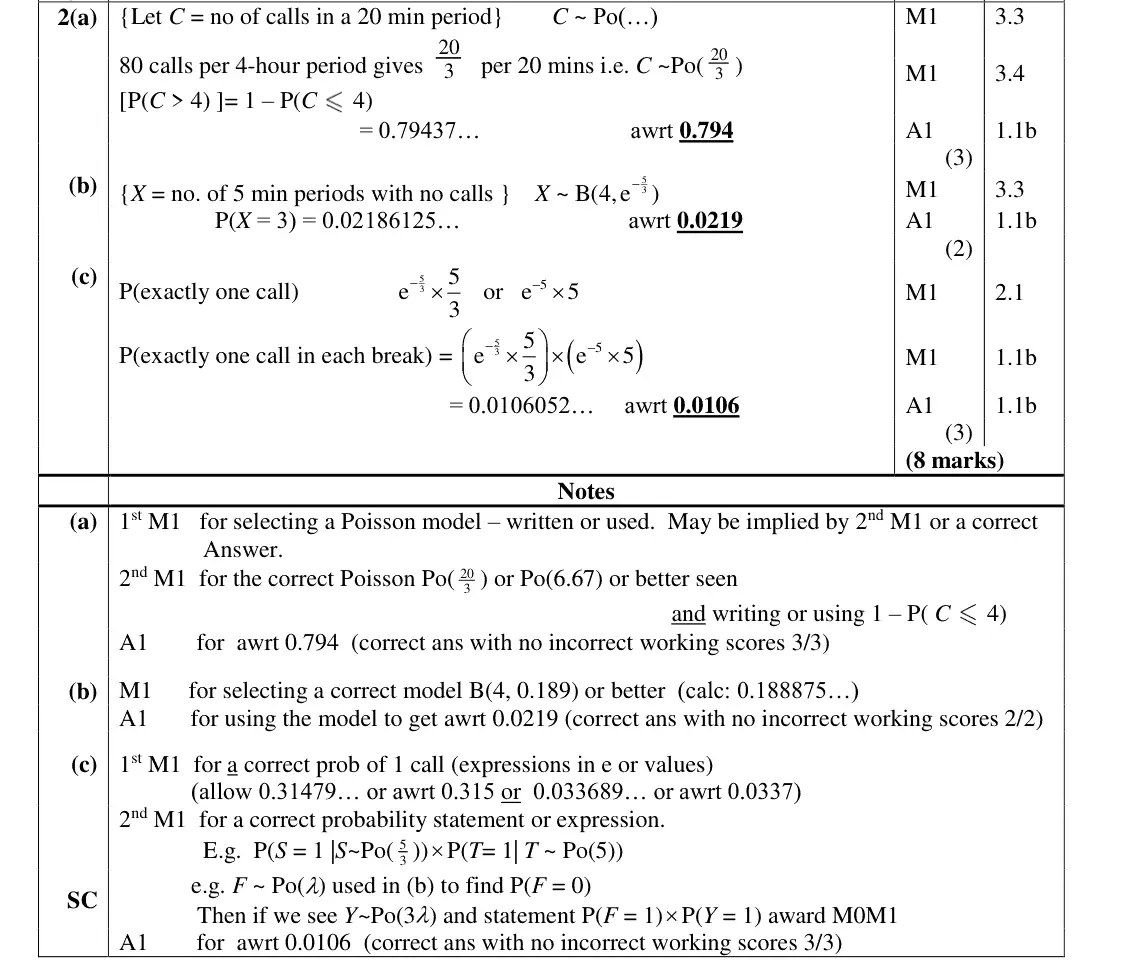
scale the rate: Po(20/3) per 20 minutes
P(C > 4) = 1 − P(C ≤ 4) = 0.794
using 1 − P(C ≤ 3) was a common slip
June 2019 · Paper 3B (Further Statistics 1) · Q2(b)2 marks
Mark scheme (whole question; this part is marked with the orange bar)
Examiner's comment
P(C > 4) = 1 – P(C 3) were fairly common. Part (b) was a little more demanding and whilst a number were able to use a Poisson distribution to obtain the probability of 0.189 they often did not realise that 3 0.189 (1 0.189) this was the parameter of a binomial distribution and answers of without the appropriate binomial coefficient were often seen. A few candidates rounded to 3 decimal places rather than 3 significant figures and, without sight of their full answer from their calculator, the examiners could not award the final mark. Whilst most identified two correct Poisson distributions e.g. X~Po( 5 3 ) and Y ~ Po(5) there were 3 common errors: some added the required probabilities instead of multiplying and some used a Po( 5 them together; others calculated P( 1) P( 0) P( 0) P( 1) X Y X Y 3 +5) distribution.
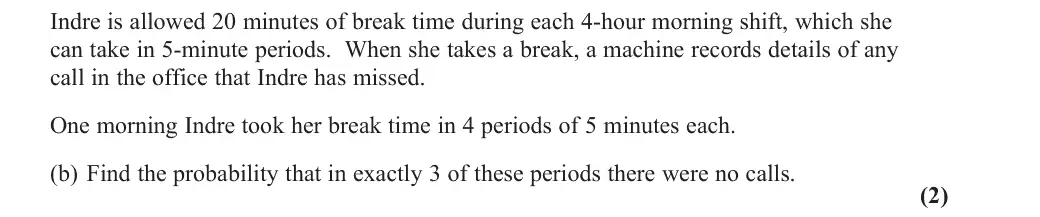
Key points from the mark scheme and examiner's report
P(no calls in 5 min) = e^(−5/3) = 0.189 is the binomial parameter: B(4, 0.189), P(X = 3) = 0.0219
binomial coefficient often omitted
June 2019 · Paper 3B (Further Statistics 1) · Q2(c)3 marksEasy
Mark scheme (whole question; this part is marked with the orange bar)
Examiner's comment
This was another well answered question with over 50% of the candidates scoring full marks. Most identified the Poisson distribution as a suitable model here and usually they had the correct mean too. A number lost marks here over the interpretation of “more than 4 calls” and statements such as
Key points from the mark scheme and examiner's report
Po(5/3) and Po(5) separately, multiply P(1) × P(1) = 0.0106
errors: adding the probabilities or using Po(5/3 + 5)
June 2019 · Paper 3B (Further Statistics 1) · Q4(c)4 marks
Mark scheme (whole question; this part is marked with the orange bar)
Examiner's comment
subsequent acceptance of the binomial model. Part (c) though was answered very well with most candidates scoring full marks here. There was some impressive, but totally unnecessary, work here to establish the value of used by Simone; a number used the given expected frequencies for 2 and 4 oak trees and solved the resulting equations instead of simply using the mean value from the given data.
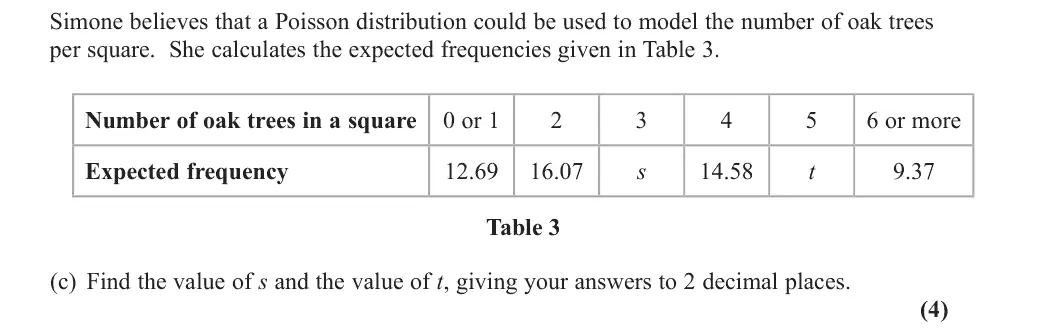
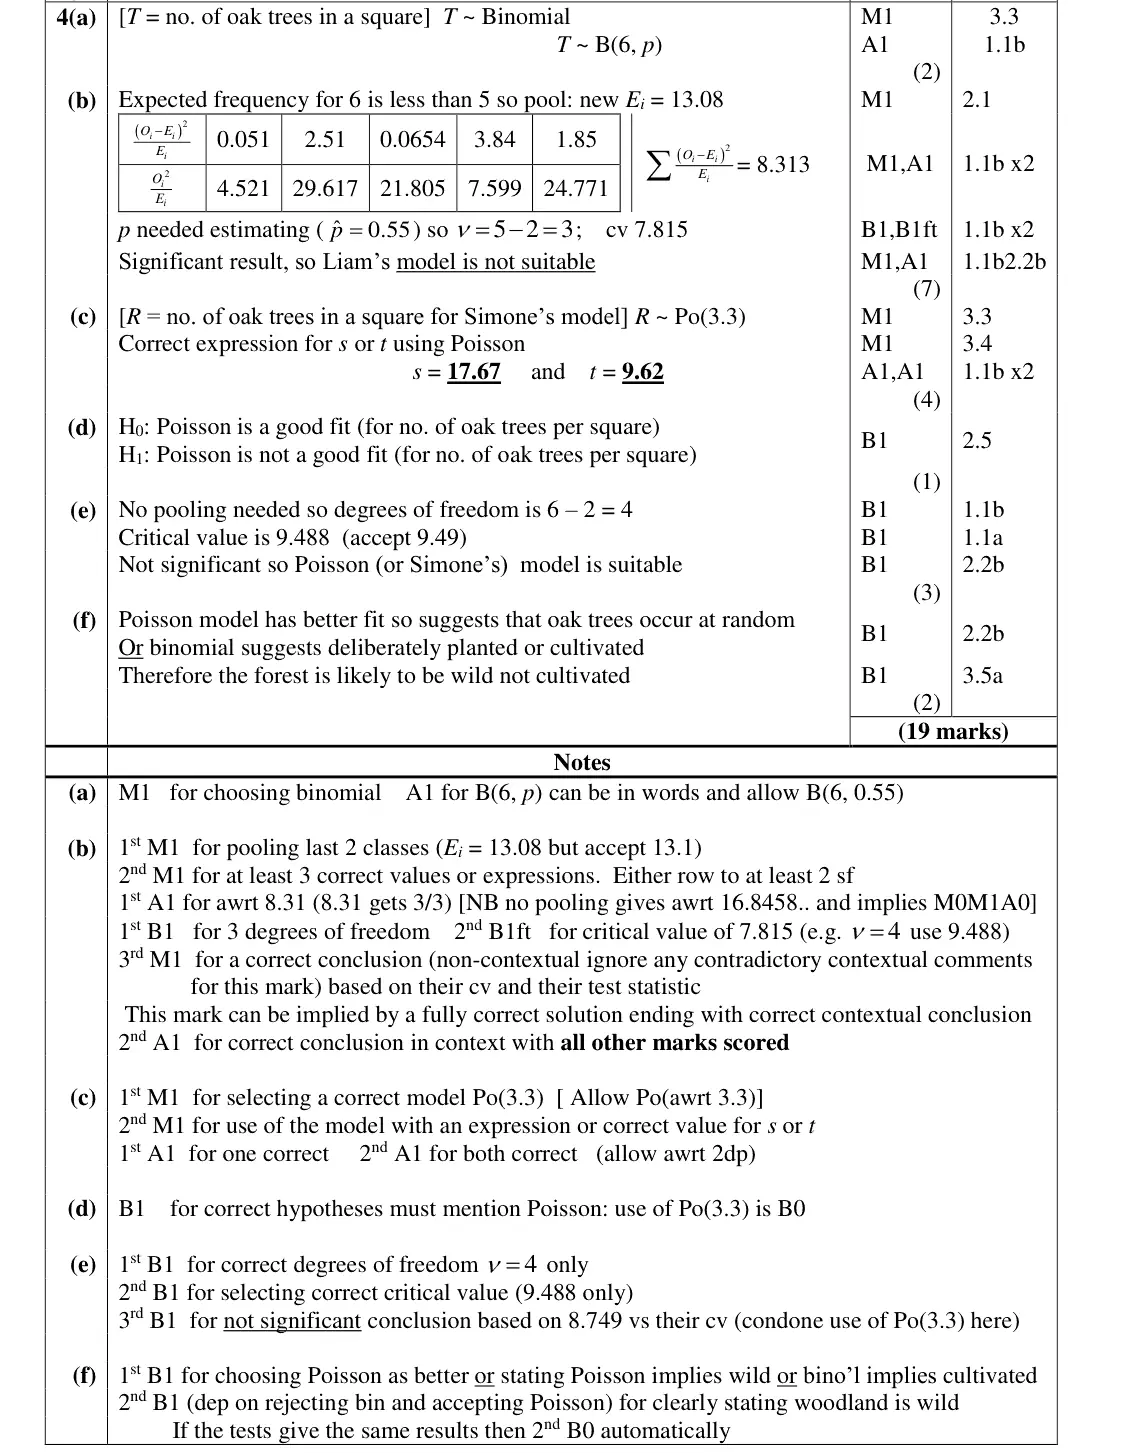
Key points from the mark scheme and examiner's report
λ = sample mean 3.3
s = 80P(X = 3) = 17.67, t = 80P(X = 5) = 9.62
no need to solve for λ from the table
June 2018 · AS Paper 2 (Further Statistics 1) · Q1(a)1 mark
Mark scheme (whole question; this part is marked with the orange bar)
Examiner's comment
Part (a) was generally well answered. The most common error was to calculate X rather than do 150 minus the sum of other expected frequencies. P( 5) 150
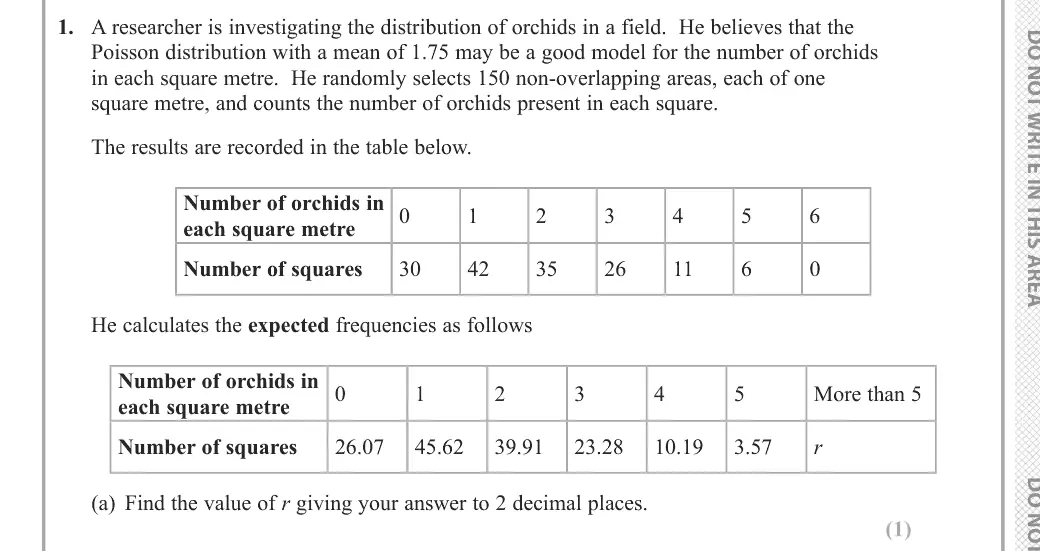
Key points from the mark scheme and examiner's report
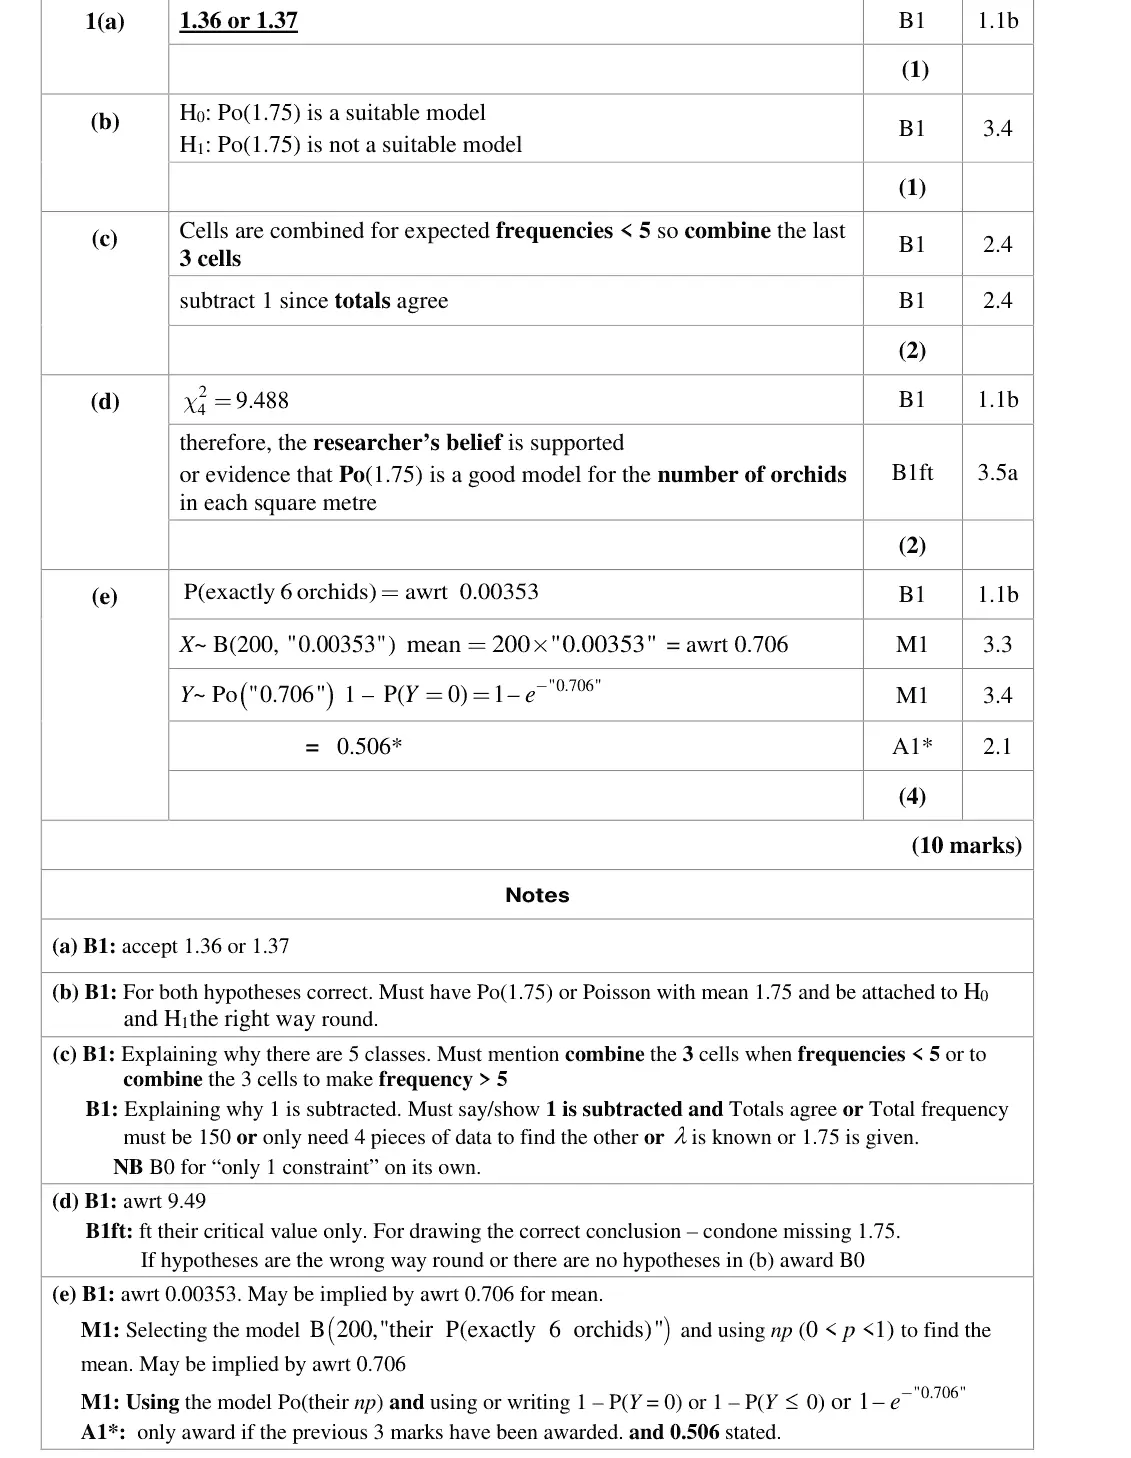
r = 150 minus the sum of the other expected frequencies = 1.36 or 1.37
common error was finding 150 × P(X > 5) instead
June 2018 · AS Paper 2 (Further Statistics 1) · Q1(e)4 marks
Mark scheme (whole question; this part is marked with the orange bar)
Examiner's comment
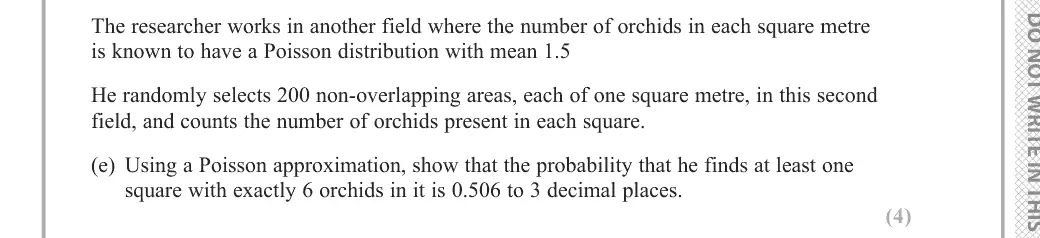
Part (e) is a “show that” question and many students did not make their method clear. The working should include the distributions being used as well as the methods. Many students clearly used the binomial distribution, even though the question asked them to use an approximation. Others got 0.706 and then just went straight to the given answer with no indication that Poisson (0.706) was the distribution being used.
Key points from the mark scheme and examiner's report
P(exactly 6) = 0.00353 from Po(1.5)
number of such squares B(200, 0.00353) ≈ Po(0.706)
1 − e^(−0.706) = 0.506
many used the binomial directly or did not state the Poisson distribution
June 2018 · AS Paper 2 (Further Statistics 1) · Q2(a)1 mark
Mark scheme (whole question; this part is marked with the orange bar)
Examiner's comment
This question proved to be very accessible to all students. Parts (a), (b) and (c) were generally well answered. The most common error in part (b) was to not include the distribution used to
Key points from the mark scheme and examiner's report
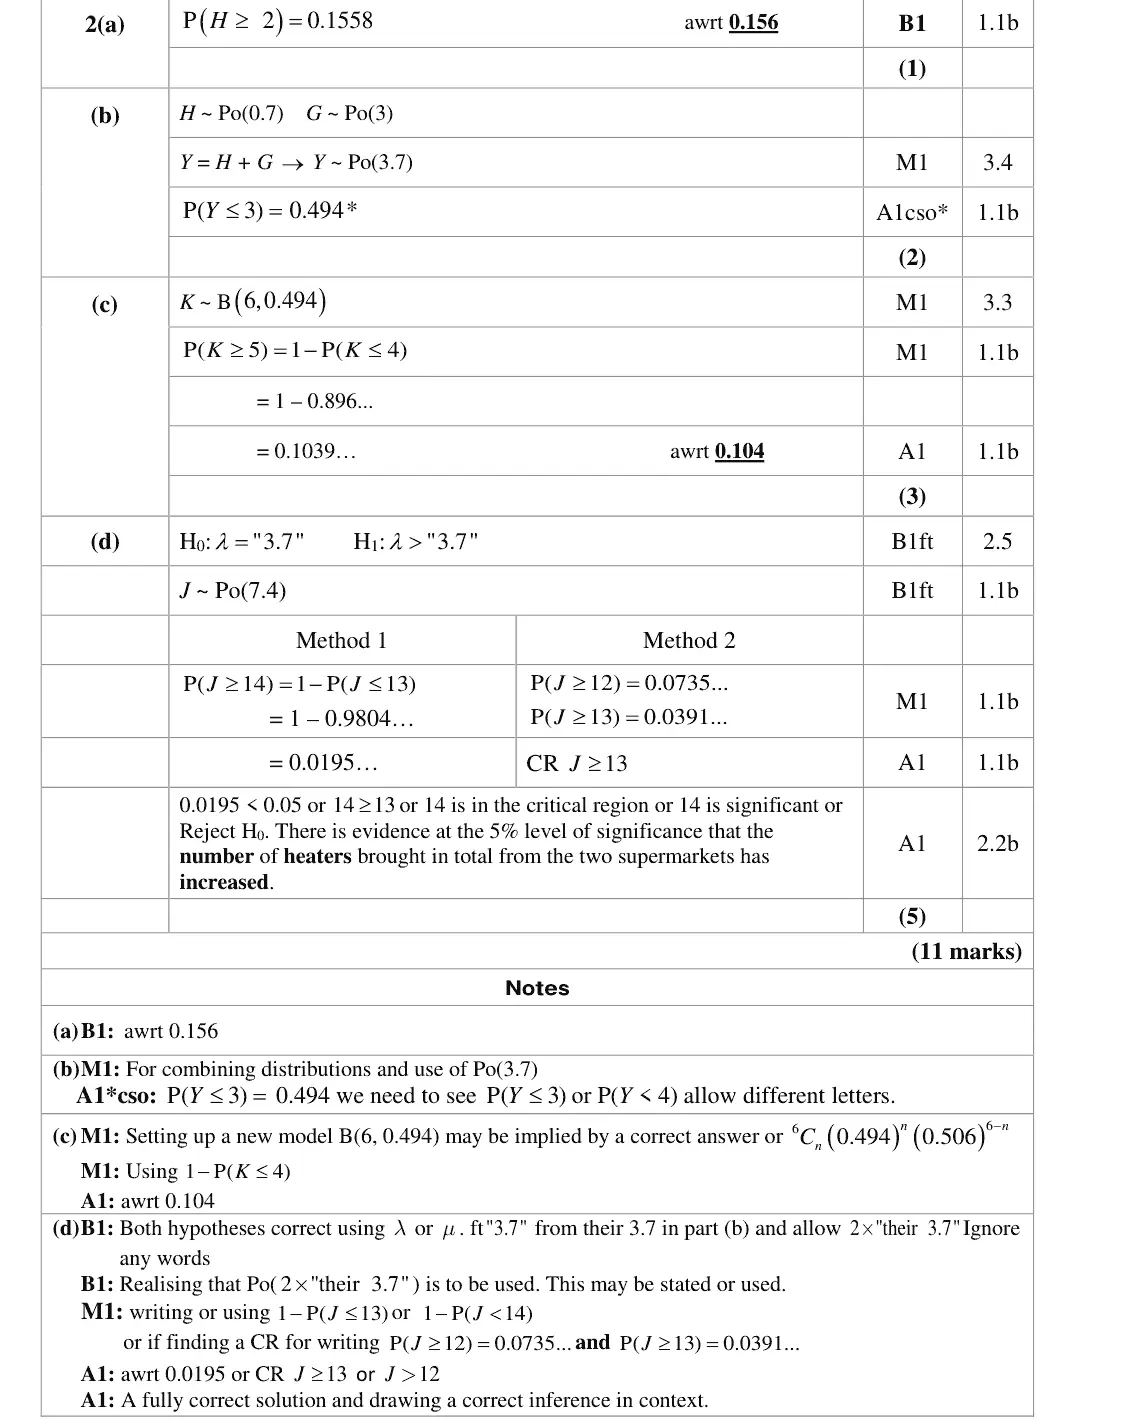
P(H ≥ 2) = 1 − P(H ≤ 1) = 0.156
June 2018 · AS Paper 2 (Further Statistics 1) · Q2(b)2 marks
Mark scheme (whole question; this part is marked with the orange bar)
Examiner's comment
This question proved to be very accessible to all students. Parts (a), (b) and (c) were generally well answered. The most common error in part (b) was to not include the distribution used to obtain the final answer and in part (c) to use the Poisson distribution rather than the binomial
Key points from the mark scheme and examiner's report
additive property: H + G ~ Po(3.7)
P(Y ≤ 3) = 0.494
common error was not stating the distribution used
June 2018 · AS Paper 2 (Further Statistics 1) · Q2(c)3 marks
Mark scheme (whole question; this part is marked with the orange bar)
Examiner's comment
This question proved to be very accessible to all students. Parts (a), (b) and (c) were generally well answered. The most common error in part (b) was to not include the distribution used to obtain the final answer and in part (c) to use the Poisson distribution rather than the binomial distribution.
Key points from the mark scheme and examiner's report
new model K ~ B(6, 0.494)
P(K ≥ 5) = 1 − P(K ≤ 4) = 0.104
common error was using a Poisson instead of the binomial
June 2018 · AS Paper 2 (Further Statistics 1) · Q2(d)5 marks
Mark scheme (whole question; this part is marked with the orange bar)
Examiner's comment
In part (d) the hypotheses were generally stated with the correct parameter although a minority of students tried to write them in words. The most common errors appeared in the X calculation where a common error was to use the mean of 3.7 or to calculate the P( . 14) Pleasingly conclusions were generally given in context for this question.
Key points from the mark scheme and examiner's report
H₀: λ = 3.7, H₁: λ > 3.7 (or 7.4 for two days)
J ~ Po(7.4)
P(J ≥ 14) = 0.0195 < 0.05 or CR J ≥ 13, reject H₀: the mean number of heaters has increased
common errors were using mean 3.7 or P(J > 14)
Find an Edexcel Further Maths tutor
Stuck on this? Book a trial lesson with our Further Maths tutor.