June 2019: A level Paper 3B: Further Statistics 1

75 marks · 23 question parts · Question paper, mark scheme and examiner's report on Pearson's site

Question by question

QTopicMarksDifficulty
1(a) Poisson and binomial distributions 2 —
1(b) Geometric and negative binomial distributions 3 —
1(c) Geometric and negative binomial distributions 1 —
2(a) Poisson and binomial distributions 3 Easy
2(b) Poisson and binomial distributions 2 —
2(c) Poisson and binomial distributions 3 Easy
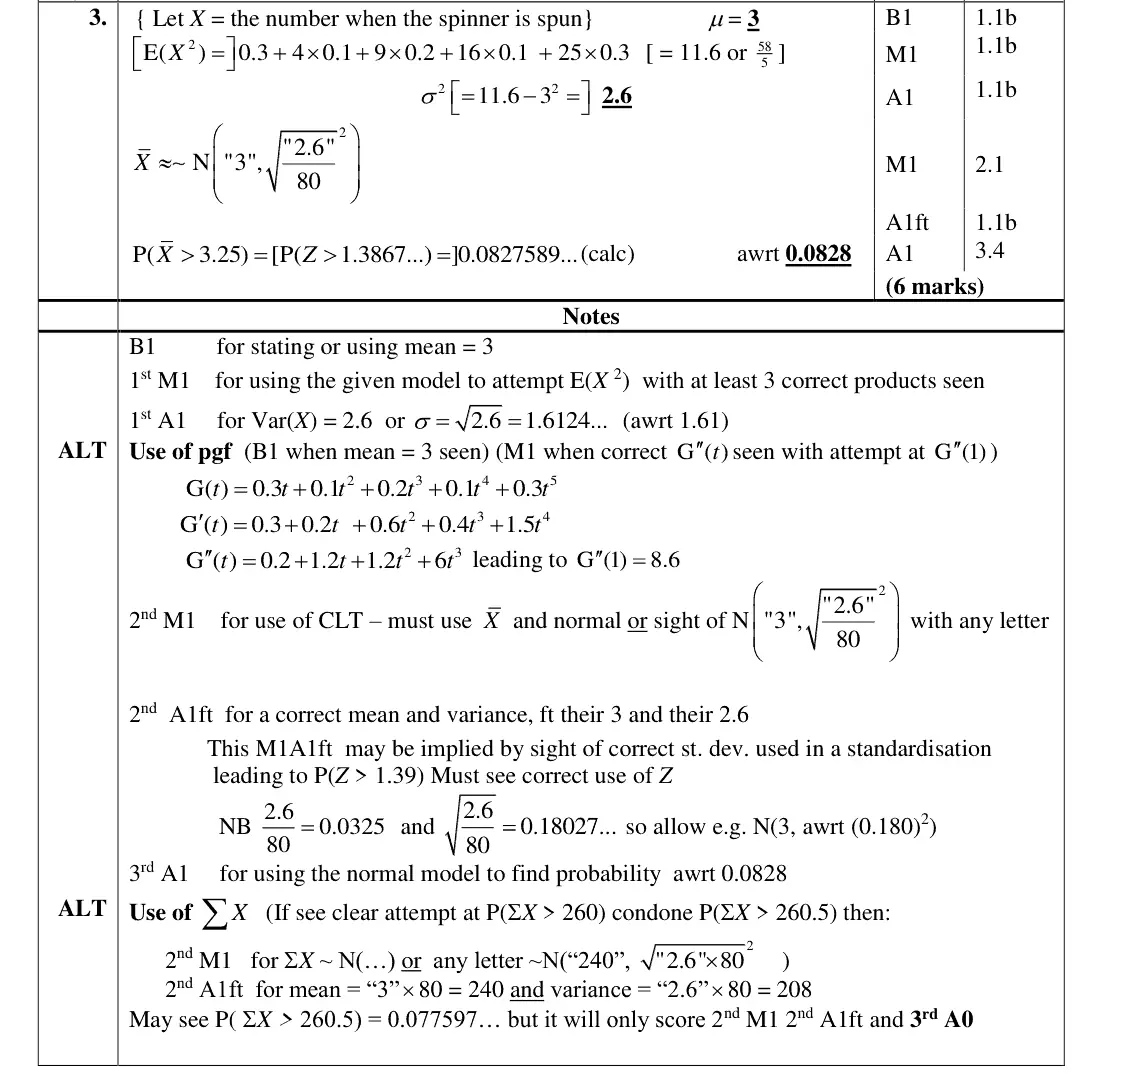
3 Central limit theorem, Discrete random variables: mean and variance 6 Easy
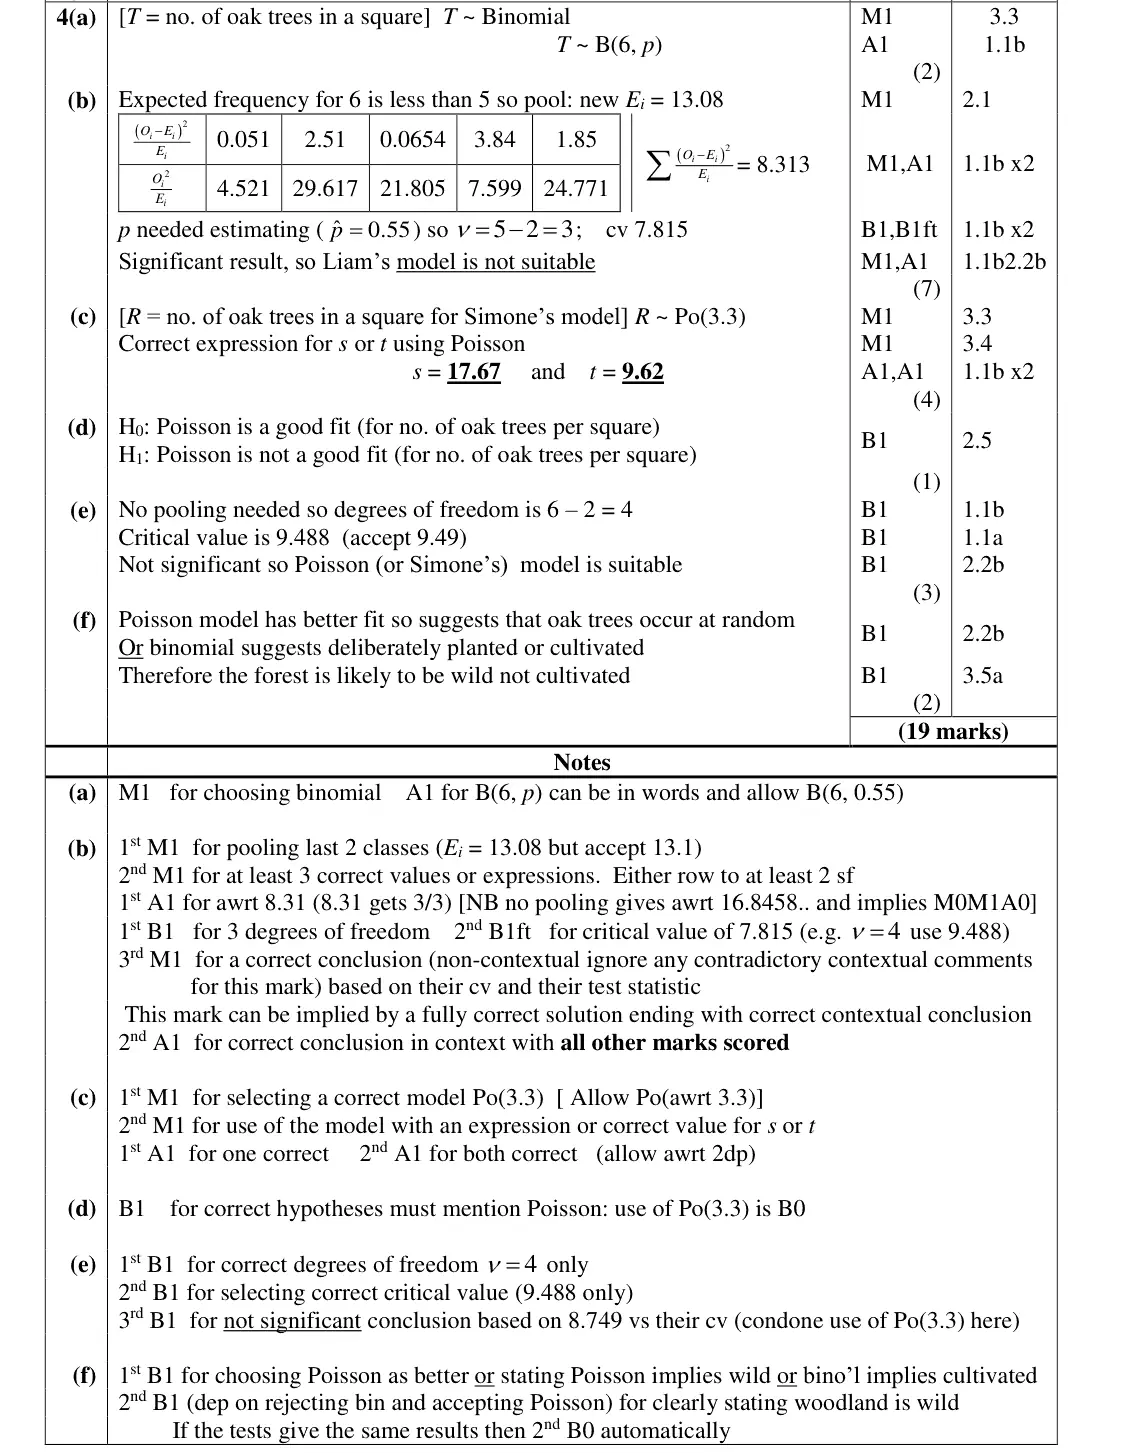
4(a) Chi-squared tests: goodness of fit and contingency tables 2 —
4(b) Chi-squared tests: goodness of fit and contingency tables 7 —
4(c) Poisson and binomial distributions 4 —
4(d) Chi-squared tests: goodness of fit and contingency tables 1 —
4(e) Chi-squared tests: goodness of fit and contingency tables 3 —
4(f) Chi-squared tests: goodness of fit and contingency tables 2 —
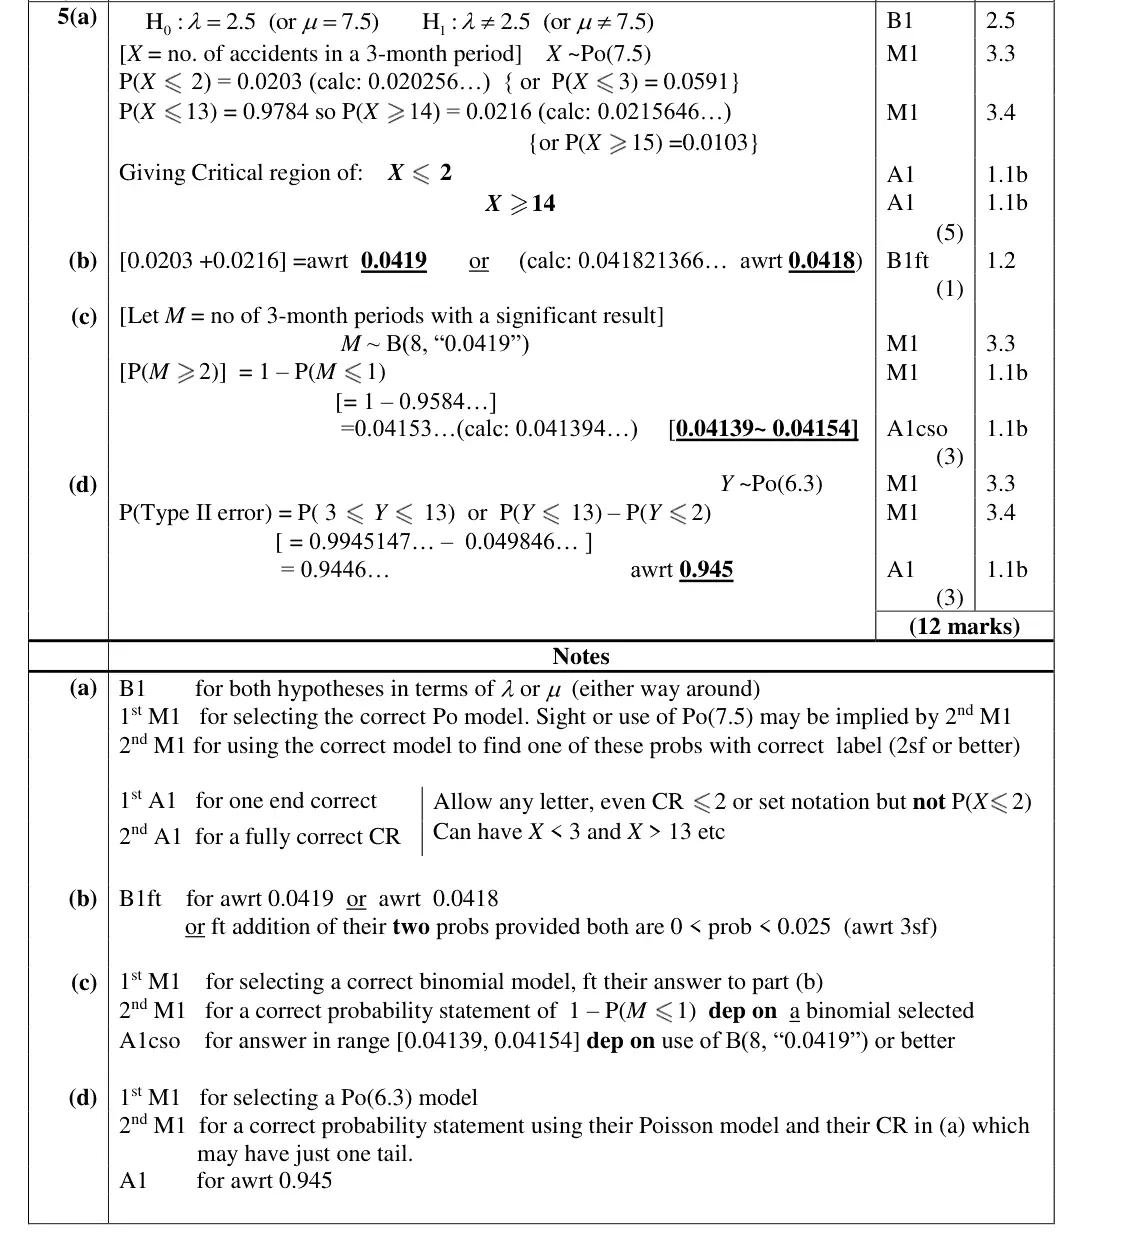
5(a) Hypothesis tests: Poisson, binomial and geometric 5 —
5(b) Quality of tests: Type I and Type II errors, size and power 1 —
5(c) Quality of tests: Type I and Type II errors, size and power 3 —
5(d) Quality of tests: Type I and Type II errors, size and power 3 —
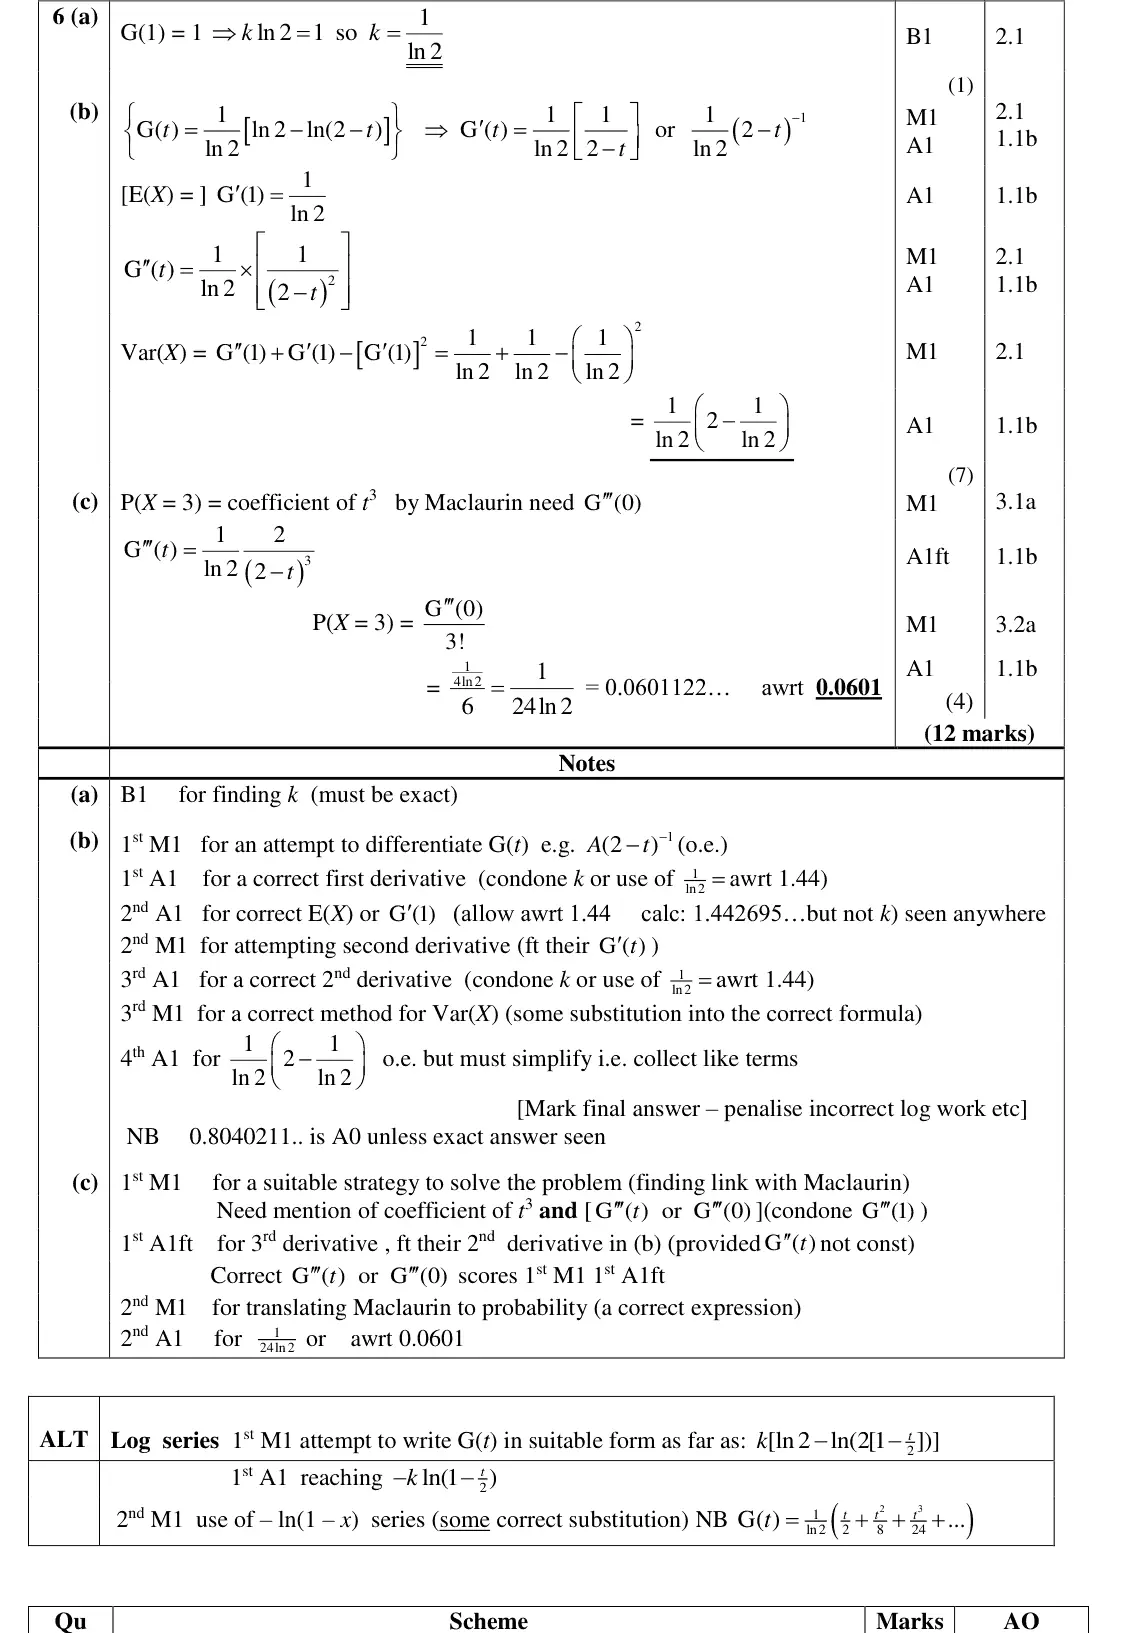
6(a) Probability generating functions 1 —
6(b) Probability generating functions 7 —
6(c) Probability generating functions 4 —
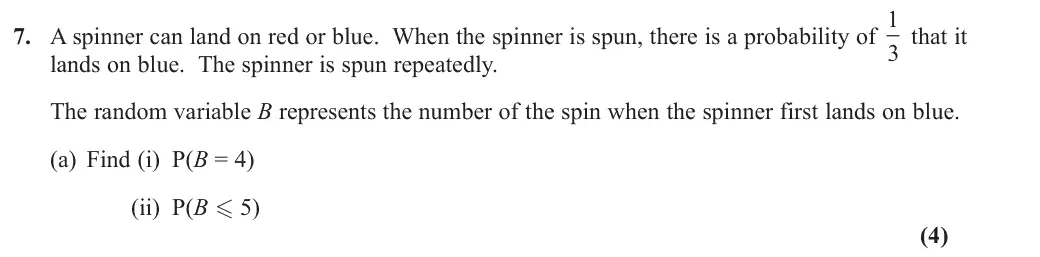
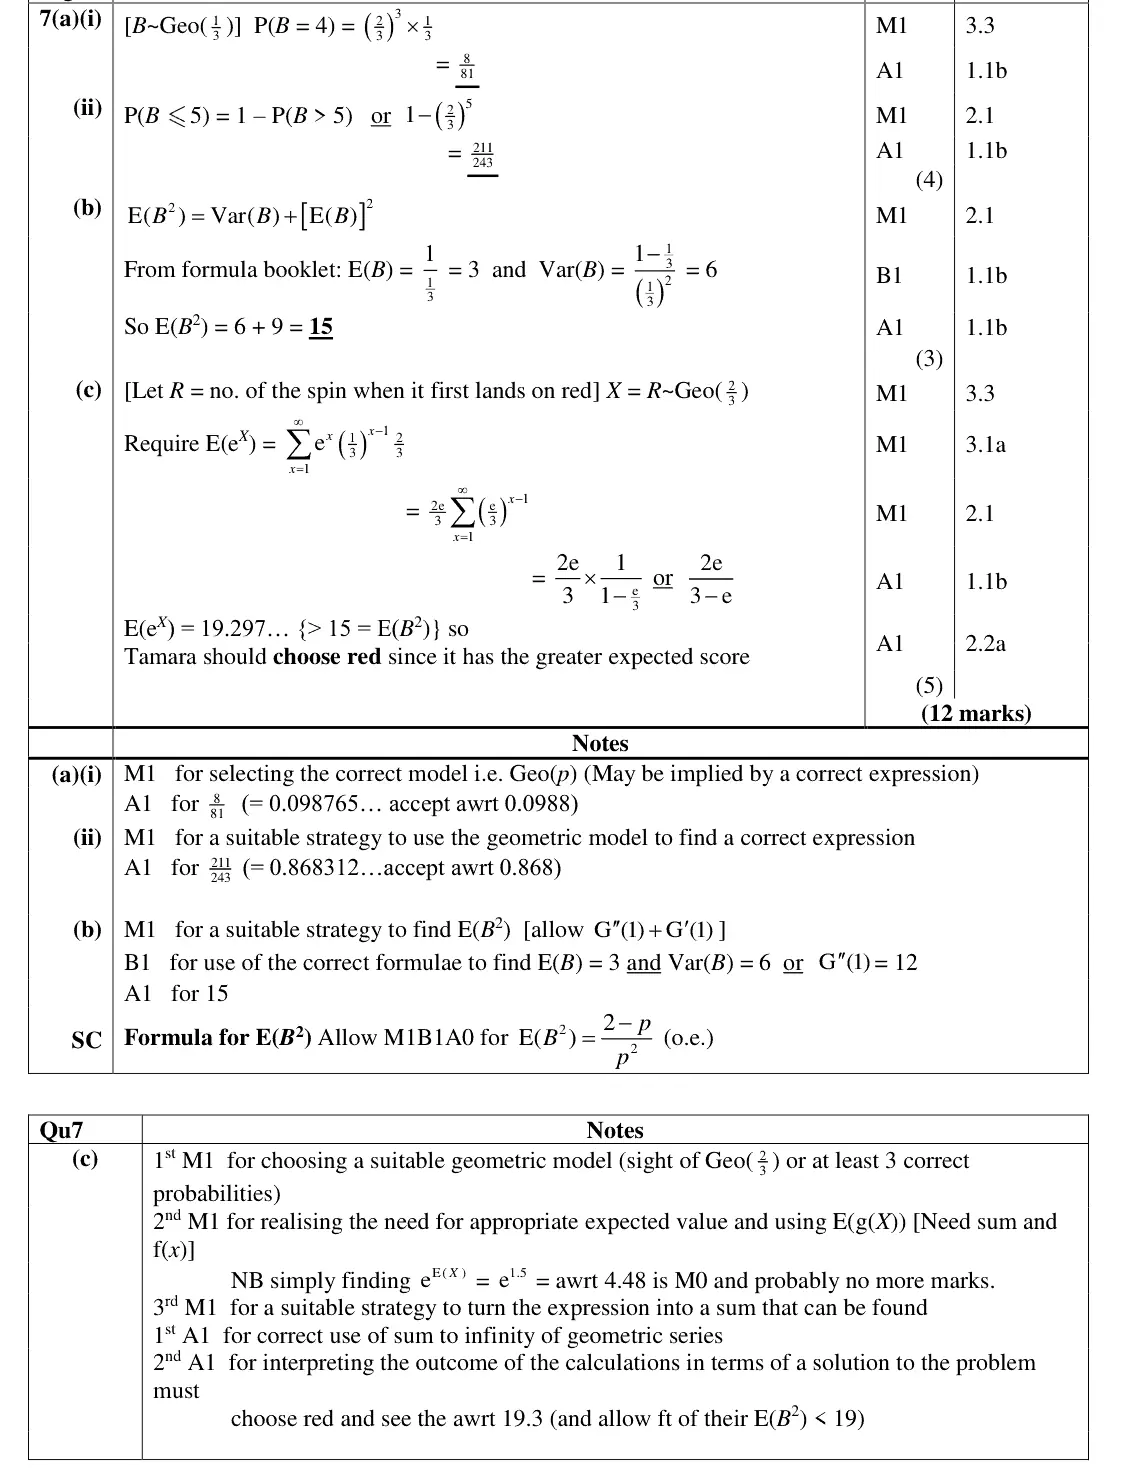
7(a) Geometric and negative binomial distributions 4 —
7(b) Geometric and negative binomial distributions 3 —
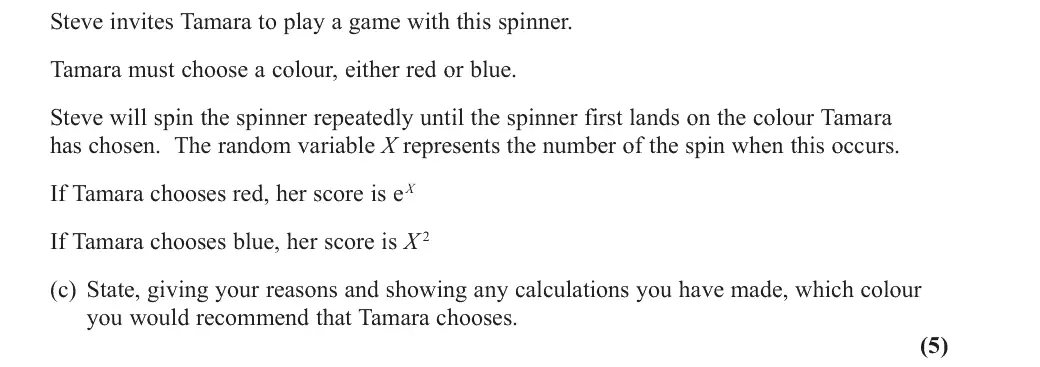
7(c) Discrete random variables: mean and variance, Geometric and negative binomial distributions 5 Medium

The questions

1(a)1(b)1(c)2(a)2(b)2(c)34(a)4(b)4(c)4(d)4(e)4(f)5(a)5(b)5(c)5(d)6(a)6(b)6(c)7(a)7(b)7(c)
June 2019 · Paper 3B (Further Statistics 1) · Q1(a) 2 marks poisson distribution
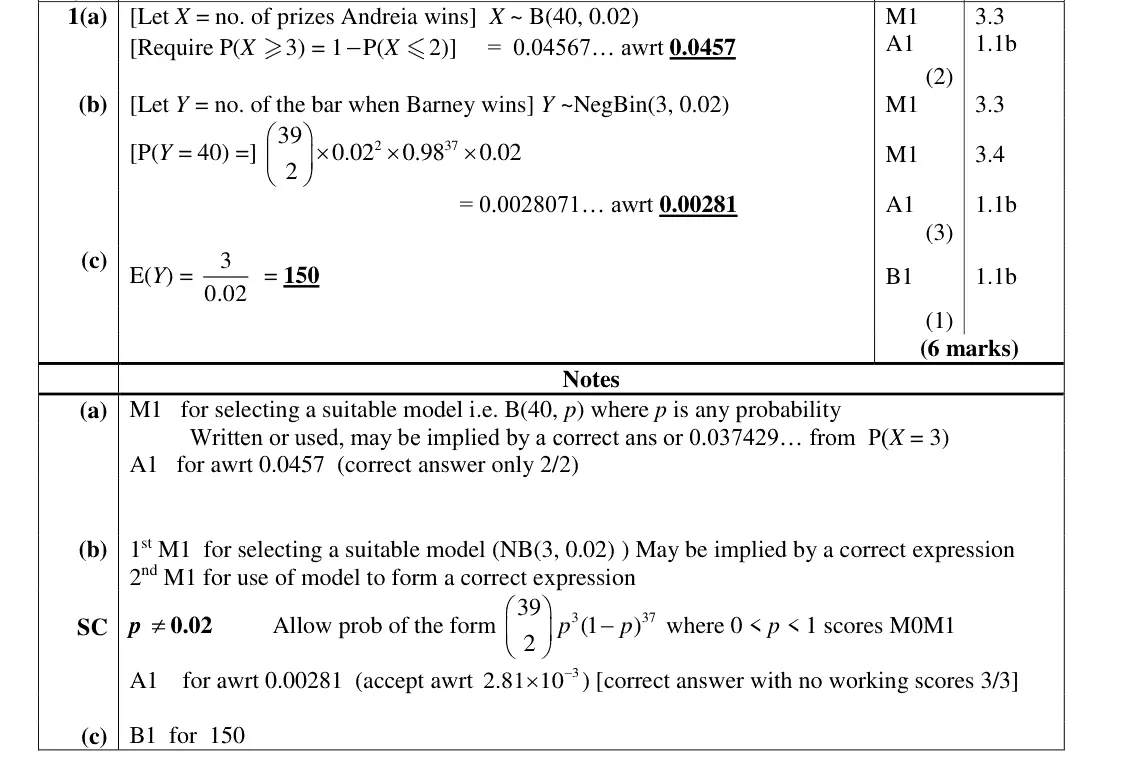
1. A chocolate manufacturer places special tokens in 2% of the bars it produces so that each bar contains at most one token. Anyone who collects 3 of these tokens can claim a prize. Andreia buys a box of 40 bars of the chocolate. (a) Find the probability that Andreia can claim a prize. (2)
June 2019 · Paper 3B (Further Statistics 1) · Q1(b) 3 marks geometric and negative binomial
Barney intends to buy bars of the chocolate, one at a time, until he can claim a prize. (b) Find the probability that Barney can claim a prize when he buys his 40th bar of chocolate. (3)
June 2019 · Paper 3B (Further Statistics 1) · Q1(c) 1 mark geometric and negative binomial
(c) Find the expected number of bars that Barney must buy to claim a prize. (1)
June 2019 · Paper 3B (Further Statistics 1) · Q2(a) 3 marks Easy poisson distribution
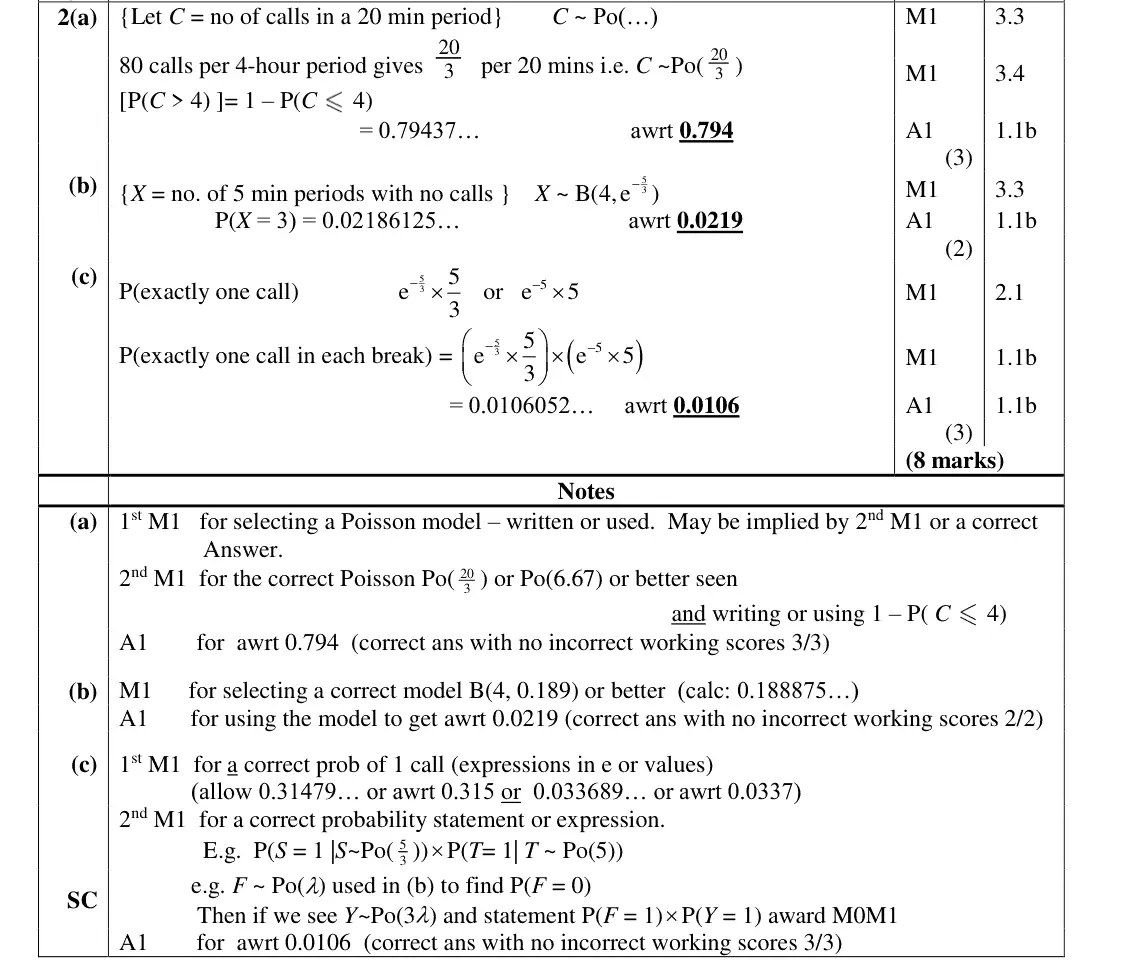
2. Indre works on reception in an office and deals with all the telephone calls that arrive. Calls arrive randomly and, in a 4-hour morning shift, there are on average 80 calls. (a) Using a suitable model, find the probability of more than 4 calls arriving in a particular 20-minute period one morning. (3)
June 2019 · Paper 3B (Further Statistics 1) · Q2(b) 2 marks poisson distribution
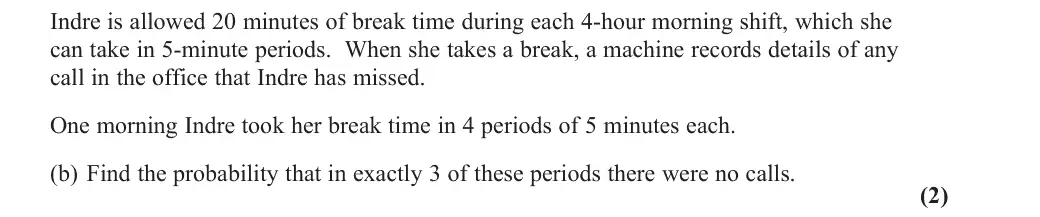
Indre is allowed 20 minutes of break time during each 4-hour morning shift, which she can take in 5-minute periods. When she takes a break, a machine records details of any call in the office that Indre has missed. One morning Indre took her break time in 4 periods of 5 minutes each. (b) Find the probability that in exactly 3 of these periods there were no calls. (2)
June 2019 · Paper 3B (Further Statistics 1) · Q2(c) 3 marks Easy poisson distribution
On another occasion Indre took 1 break of 5 minutes and 1 break of 15 minutes. (c) Find the probability that Indre missed exactly 1 call in each of these 2 breaks. (3)
June 2019 · Paper 3B (Further Statistics 1) · Q3 6 marks Easy central limit theoremdiscrete random variables
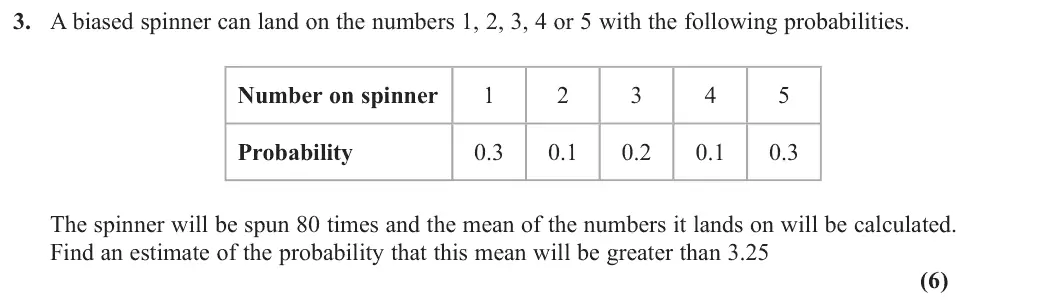
3. A biased spinner can land on the numbers 1, 2, 3, 4 or 5 with the following probabilities. Number on spinner Probability 0.3 0.1 0.2 0.1 0.3 The spinner will be spun 80 times and the mean of the numbers it lands on will be calculated. Find an estimate of the probability that this mean will be greater than 3.25 (6)
June 2019 · Paper 3B (Further Statistics 1) · Q4(a) 2 marks chi squared tests
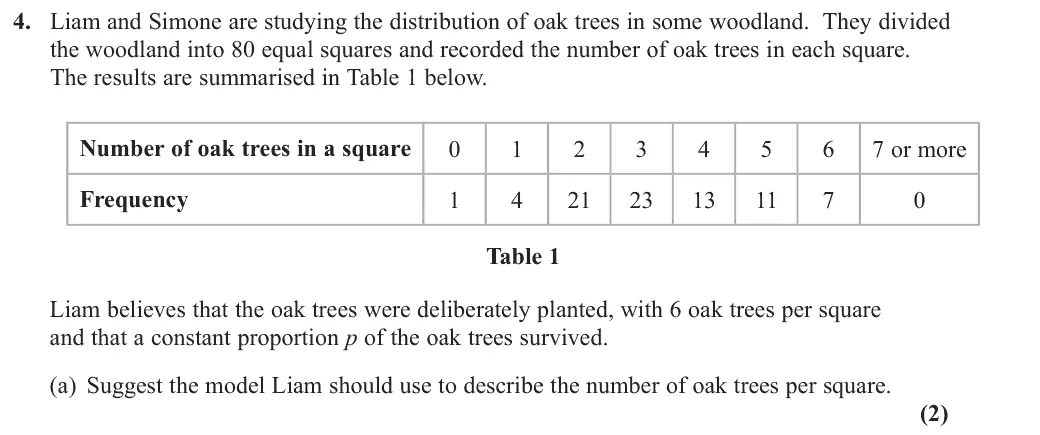
4. Liam and Simone are studying the distribution of oak trees in some woodland. They divided the woodland into 80 equal squares and recorded the number of oak trees in each square. The results are summarised in Table 1 below. Number of oak trees in a square 7 or more Frequency Table 1 Liam believes that the oak trees were deliberately planted, with 6 oak trees per square and that a constant proportion p of the oak trees survived. (a) Suggest the model Liam should use to describe the number of oak trees per square. (2)
June 2019 · Paper 3B (Further Statistics 1) · Q4(b) 7 marks chi squared tests
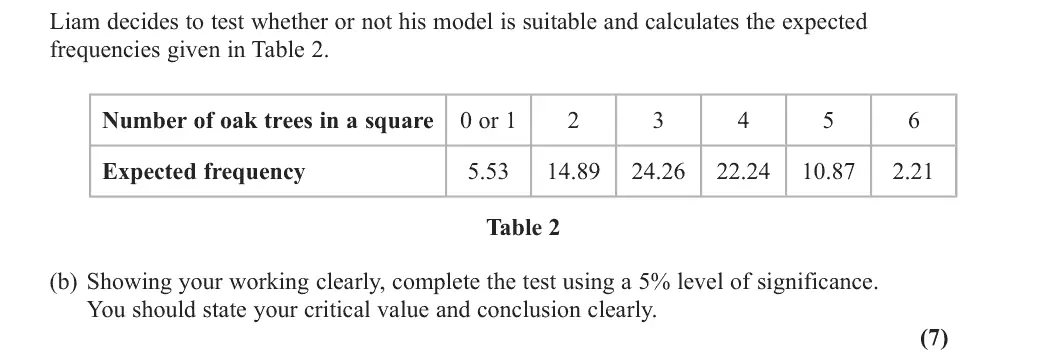
Liam decides to test whether or not his model is suitable and calculates the expected frequencies given in Table 2. Number of oak trees in a square 0 or 1 Expected frequency 5.53 14.89 24.26 22.24 10.87 2.21 Table 2 (b) Showing your working clearly, complete the test using a 5% level of significance. You should state your critical value and conclusion clearly. (7)
June 2019 · Paper 3B (Further Statistics 1) · Q4(c) 4 marks poisson distribution
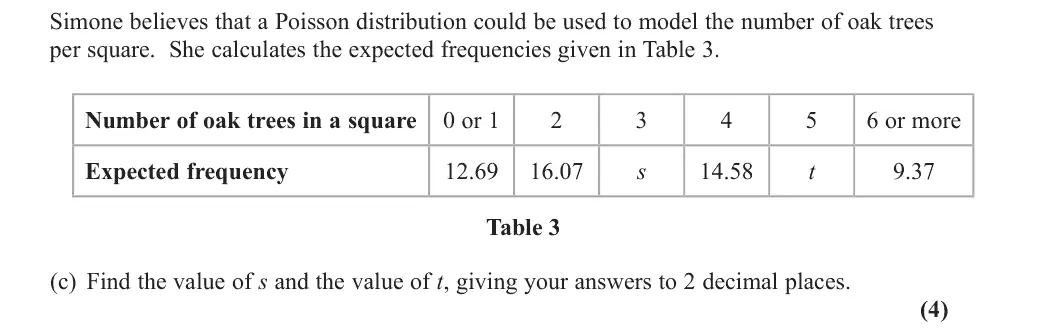
Simone believes that a Poisson distribution could be used to model the number of oak trees per square. She calculates the expected frequencies given in Table 3. Number of oak trees in a square 0 or 1 6 or more Expected frequency 12.69 16.07 s 14.58 t 9.37 Table 3 (c) Find the value of s and the value of t, giving your answers to 2 decimal places. (4)
June 2019 · Paper 3B (Further Statistics 1) · Q4(d) 1 mark chi squared tests
(d) Write down hypotheses to test the suitability of Simone’s model. (1)
June 2019 · Paper 3B (Further Statistics 1) · Q4(e) 3 marks chi squared tests
The test statistic for this test is 8.749 (e) Complete the test. Use a 5% level of significance and state your critical value and conclusion clearly. (3)
June 2019 · Paper 3B (Further Statistics 1) · Q4(f) 2 marks chi squared tests
(f) Using the results of these tests, explain whether the origin of this woodland is likely to be cultivated or wild. (2)
June 2019 · Paper 3B (Further Statistics 1) · Q5(a) 5 marks hypothesis tests fs1
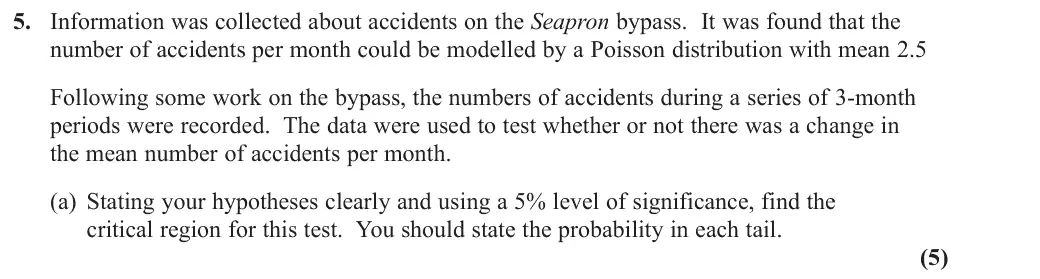
5. Information was collected about accidents on the Seapron bypass. It was found that the number of accidents per month could be modelled by a Poisson distribution with mean 2.5 Following some work on the bypass, the numbers of accidents during a series of 3-month periods were recorded. The data were used to test whether or not there was a change in the mean number of accidents per month. (a) Stating your hypotheses clearly and using a 5% level of significance, find the critical region for this test. You should state the probability in each tail. (5)
June 2019 · Paper 3B (Further Statistics 1) · Q5(b) 1 mark type i and type ii errors
(b) State P(Type I error) using this test. (1)
June 2019 · Paper 3B (Further Statistics 1) · Q5(c) 3 marks type i and type ii errors
Data from the series of 3-month periods are recorded for 2 years. (c) Find the probability that at least 2 of these 3-month periods give a significant result. (3)
June 2019 · Paper 3B (Further Statistics 1) · Q5(d) 3 marks type i and type ii errors
Given that the number of accidents per month on the bypass, after the work is completed, is actually 2.1 per month, (d) find P(Type II error) for the test in part (a) (3)
June 2019 · Paper 3B (Further Statistics 1) · Q6(a) 1 mark probability generating functions
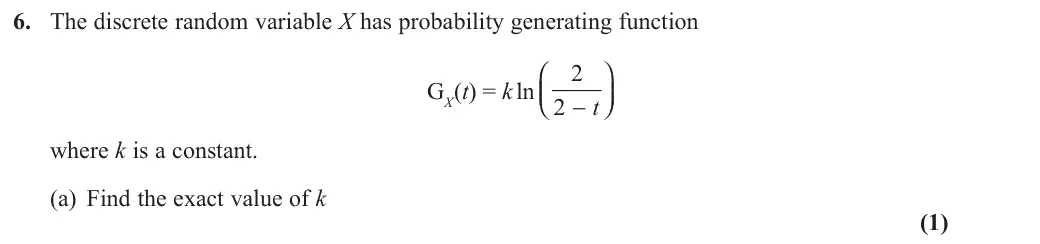
6. The discrete random variable X has probability generating function ⎛ ⎞ GX(t) = k ln ⎝⎜ ⎠⎟t 2 - where k is a constant. (a) Find the exact value of k (1)
June 2019 · Paper 3B (Further Statistics 1) · Q6(b) 7 marks probability generating functions
(b) Find the exact value of Var(X ) (7)
June 2019 · Paper 3B (Further Statistics 1) · Q6(c) 4 marks probability generating functions
(c) Find P(X = 3) (4)
June 2019 · Paper 3B (Further Statistics 1) · Q7(a) 4 marks geometric and negative binomial
7. A spinner can land on red or blue. When the spinner is spun, there is a probability of 1 3 that it lands on blue. The spinner is spun repeatedly. The random variable B represents the number of the spin when the spinner first lands on blue. (a) Find (i) P(B = 4) (ii) P(B - 5) (4)
June 2019 · Paper 3B (Further Statistics 1) · Q7(b) 3 marks geometric and negative binomial
(b) Find E(B2) (3)
June 2019 · Paper 3B (Further Statistics 1) · Q7(c) 5 marks Medium discrete random variablesgeometric and negative binomial
Steve invites Tamara to play a game with this spinner. Tamara must choose a colour, either red or blue. Steve will spin the spinner repeatedly until the spinner first lands on the colour Tamara has chosen. The random variable X represents the number of the spin when this occurs. If Tamara chooses red, her score is eX If Tamara chooses blue, her score is X 2 (c) State, giving your reasons and showing any calculations you have made, which colour you would recommend that Tamara chooses. (5)

Find an Edexcel Further Maths tutor

Want this paper marked and gone through with a Further Maths tutor? Message us.

Prefer email? Send an enquiry

If you are under 18, please include a parent's contact details. Enquiries go to enquiries@alevelfurthermathstutor.com and are deleted once handled.