June 2025: A level Paper 3B: Further Statistics 1

75 marks · 25 question parts · Question paper, mark scheme and examiner's report on Pearson's site

Question by question

QTopicMarksDifficulty
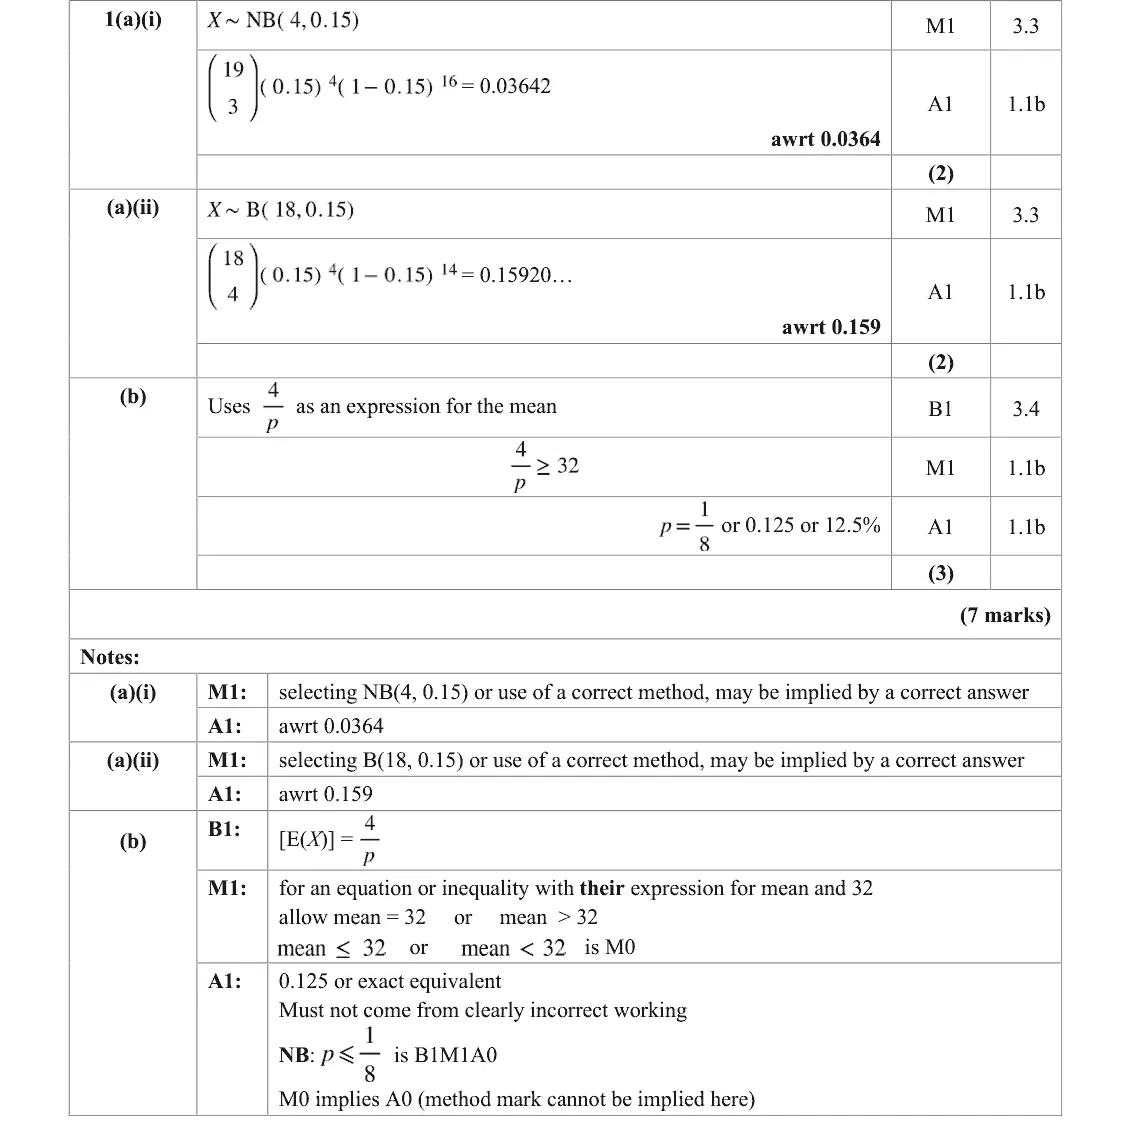
1(a)(i) Geometric and negative binomial distributions 2 —
1(a)(ii) Poisson and binomial distributions 2 —
1(b) Geometric and negative binomial distributions 3 —
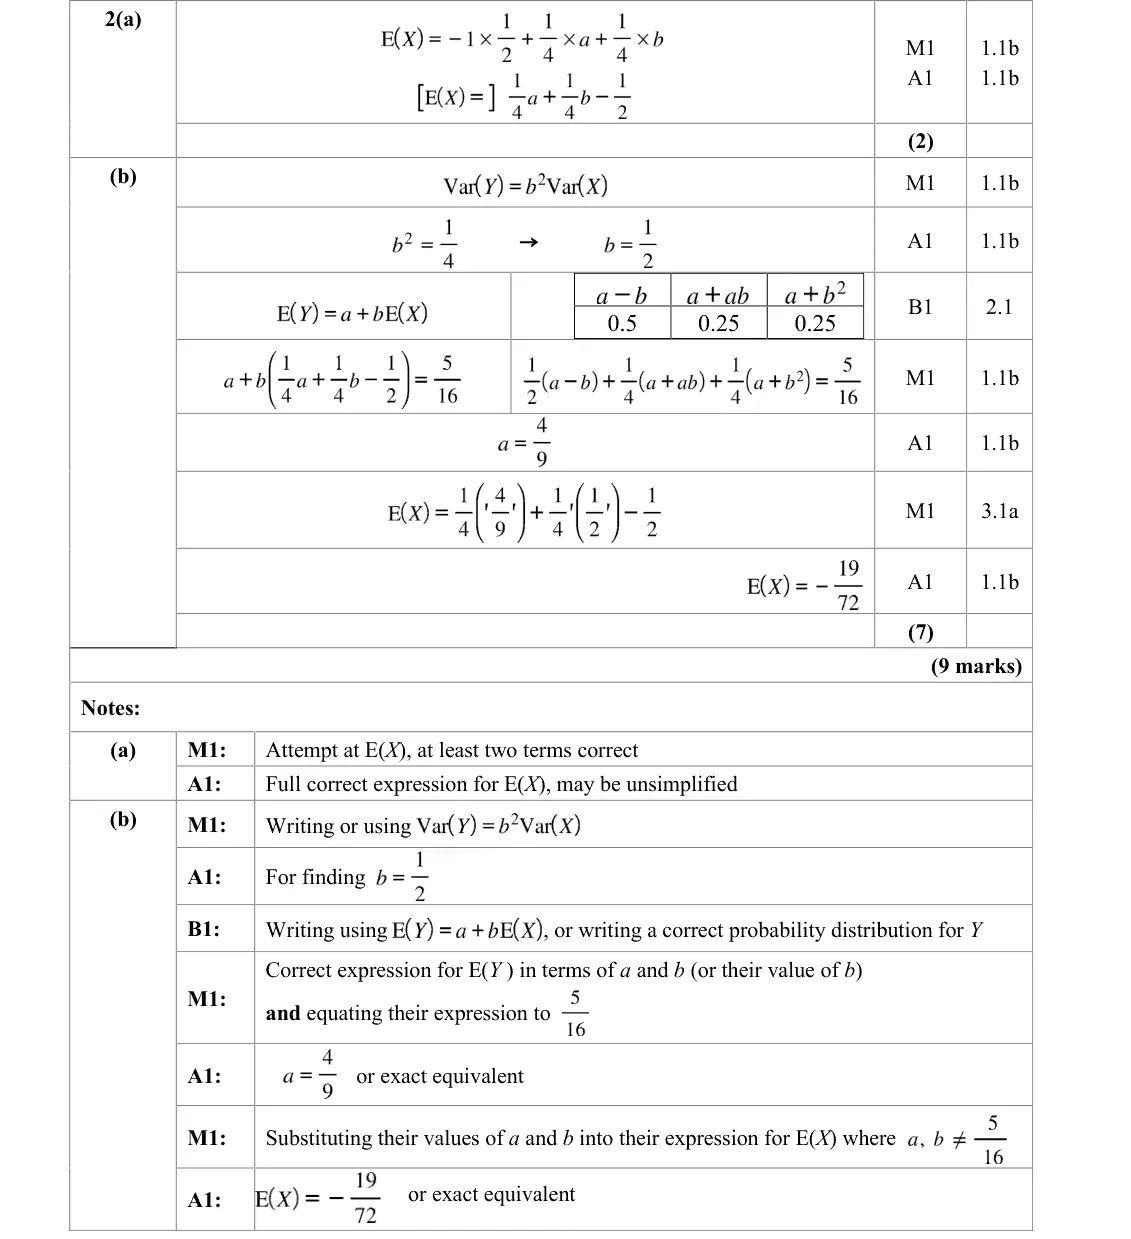
2(a) Discrete random variables: mean and variance 2 —
2(b) Discrete random variables: mean and variance 7 —
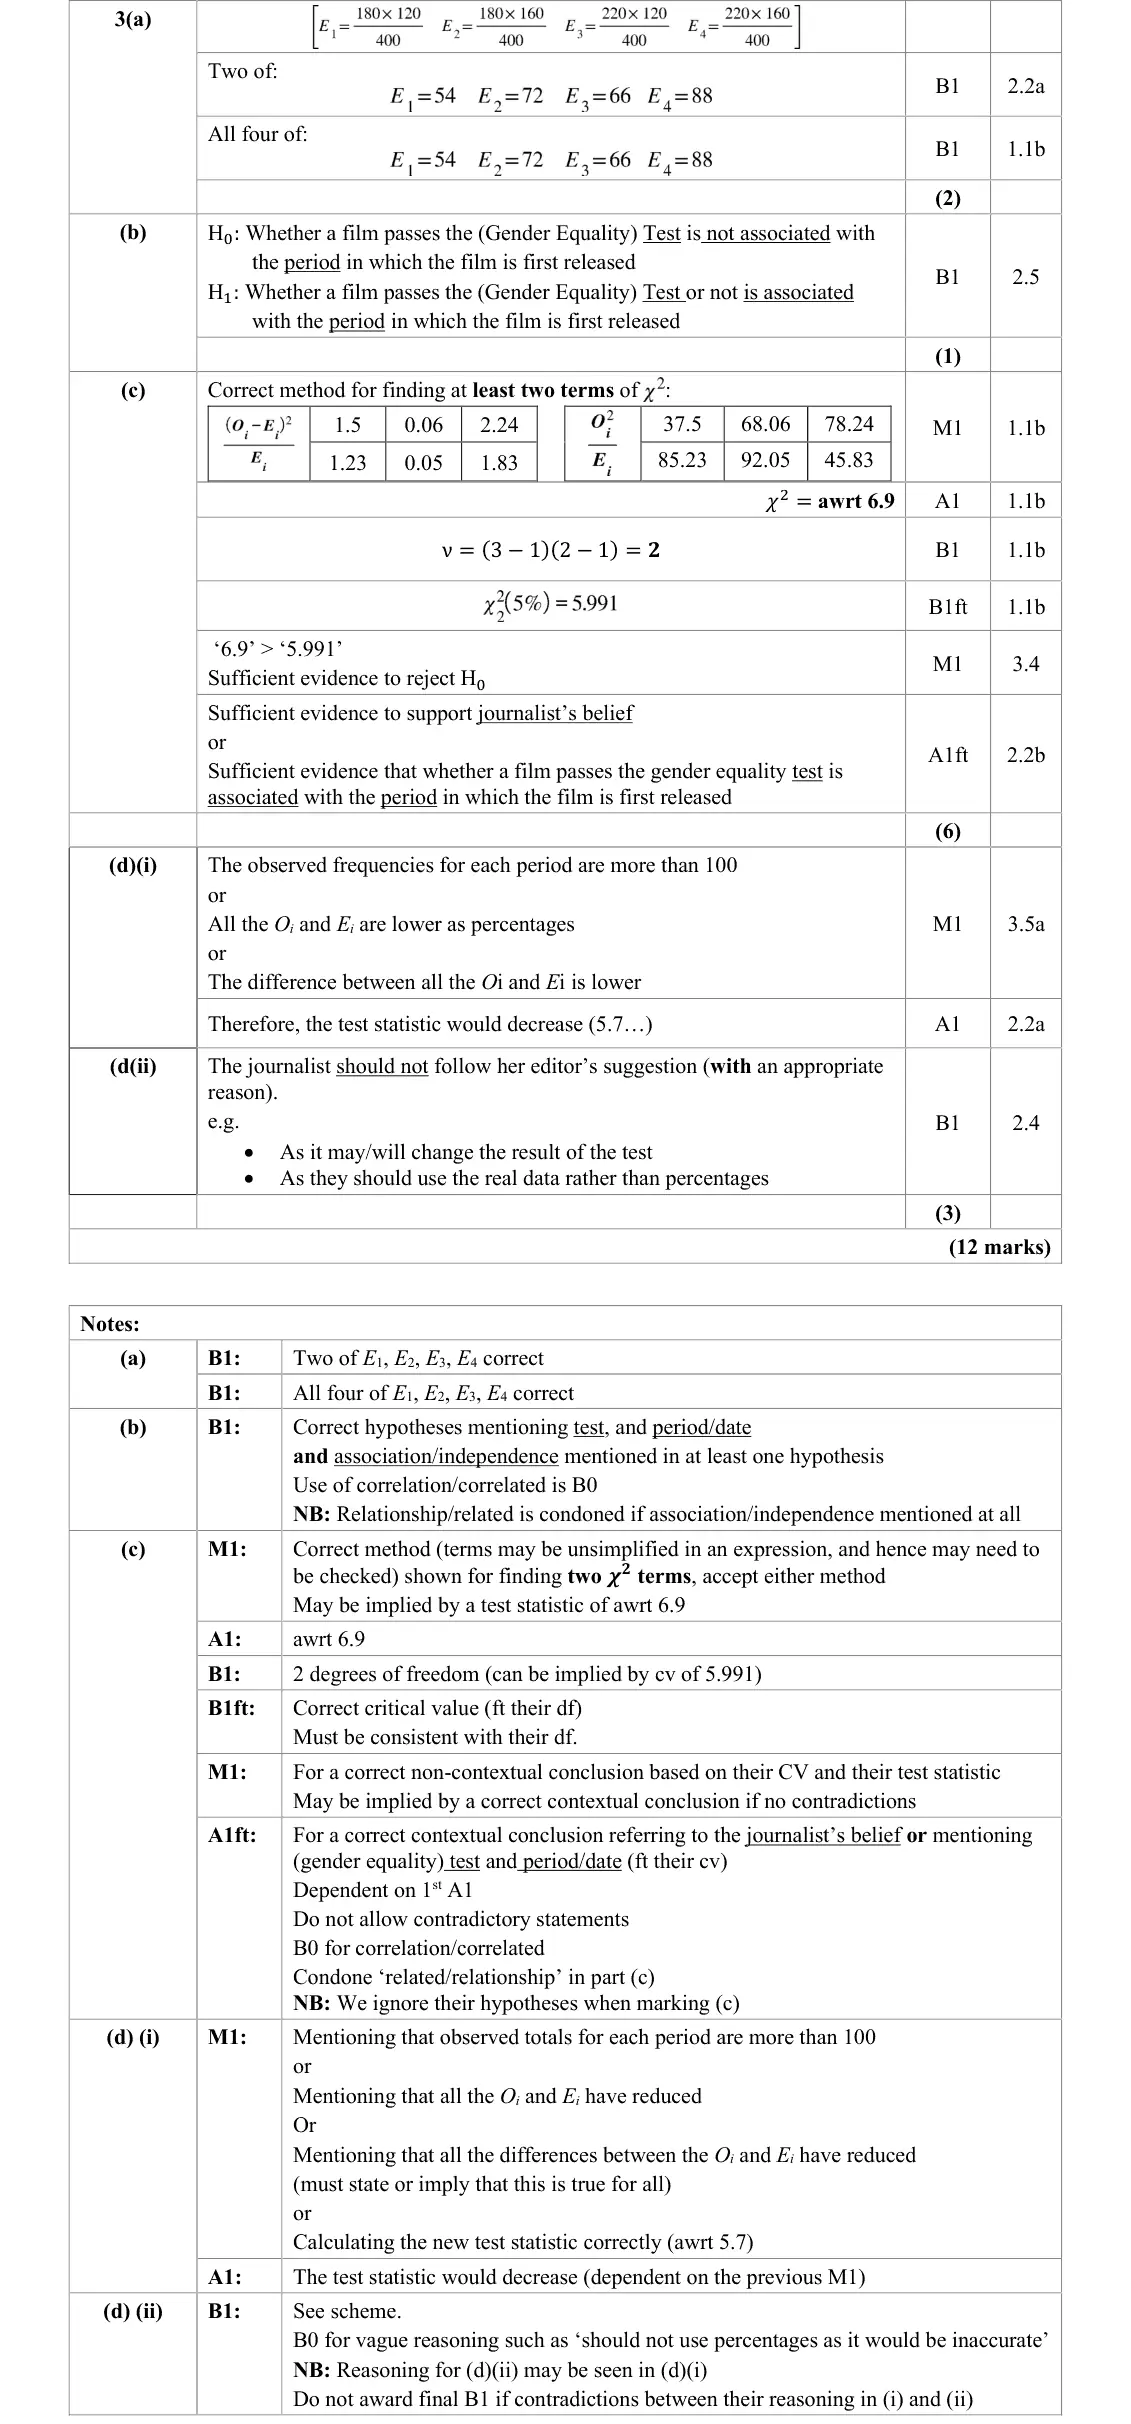
3(a) Chi-squared tests: goodness of fit and contingency tables 2 —
3(b) Chi-squared tests: goodness of fit and contingency tables 1 —
3(c) Chi-squared tests: goodness of fit and contingency tables 6 —
3(d) Chi-squared tests: goodness of fit and contingency tables 3 —
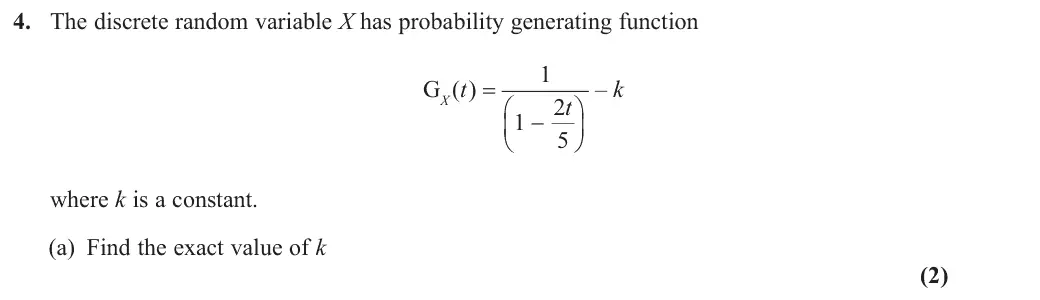
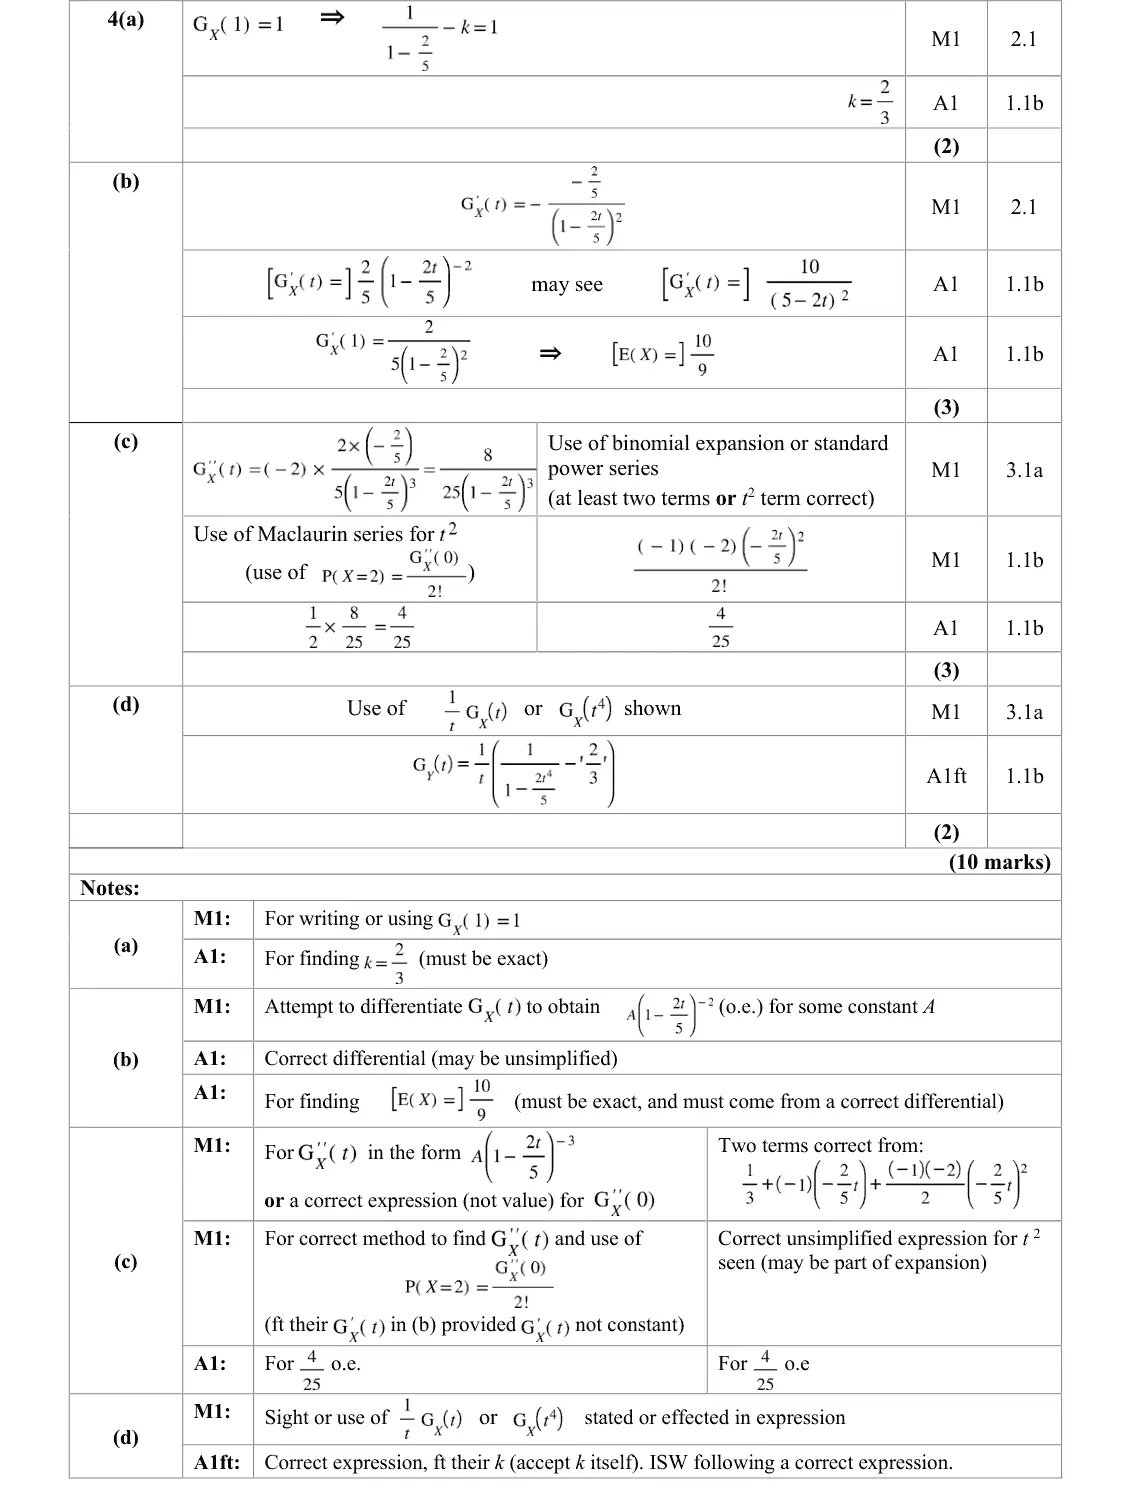
4(a) Probability generating functions 2 —
4(b) Probability generating functions 3 —
4(c) Probability generating functions 3 —
4(d) Probability generating functions 2 —
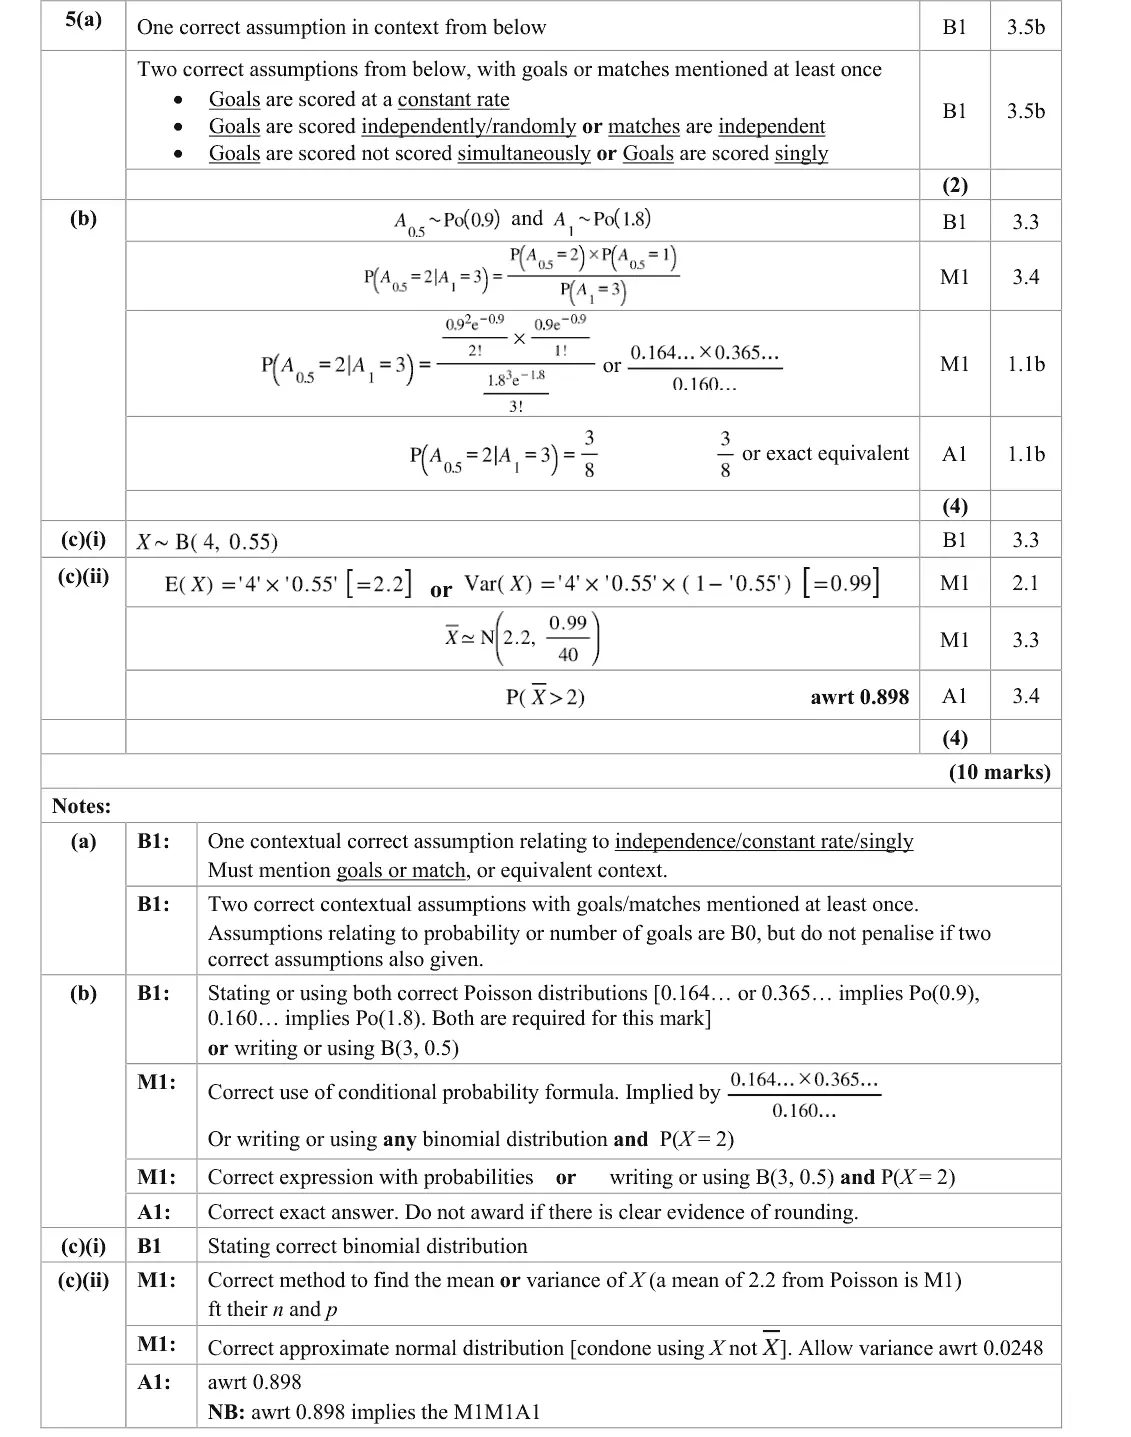
5(a) Poisson and binomial distributions 2 —
5(b) Poisson and binomial distributions 4 —
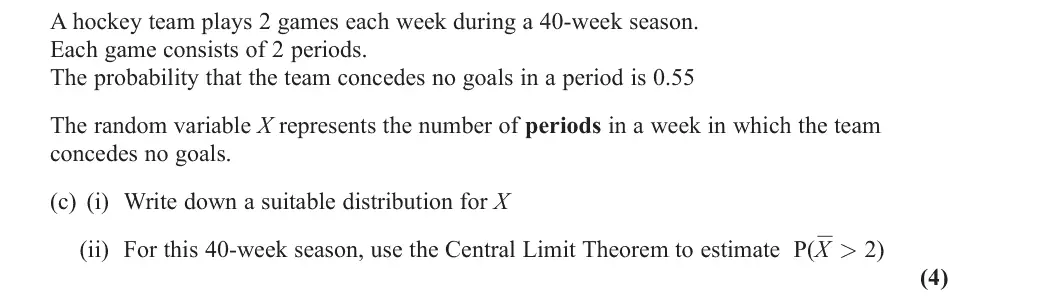
5(c) Central limit theorem, Poisson and binomial distributions 4 —
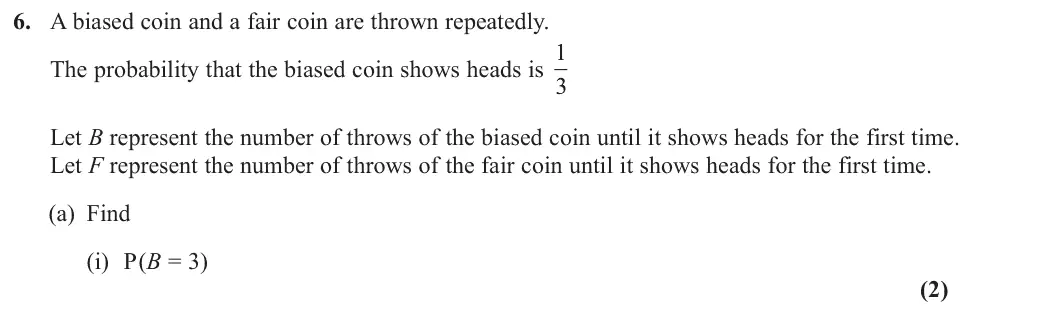
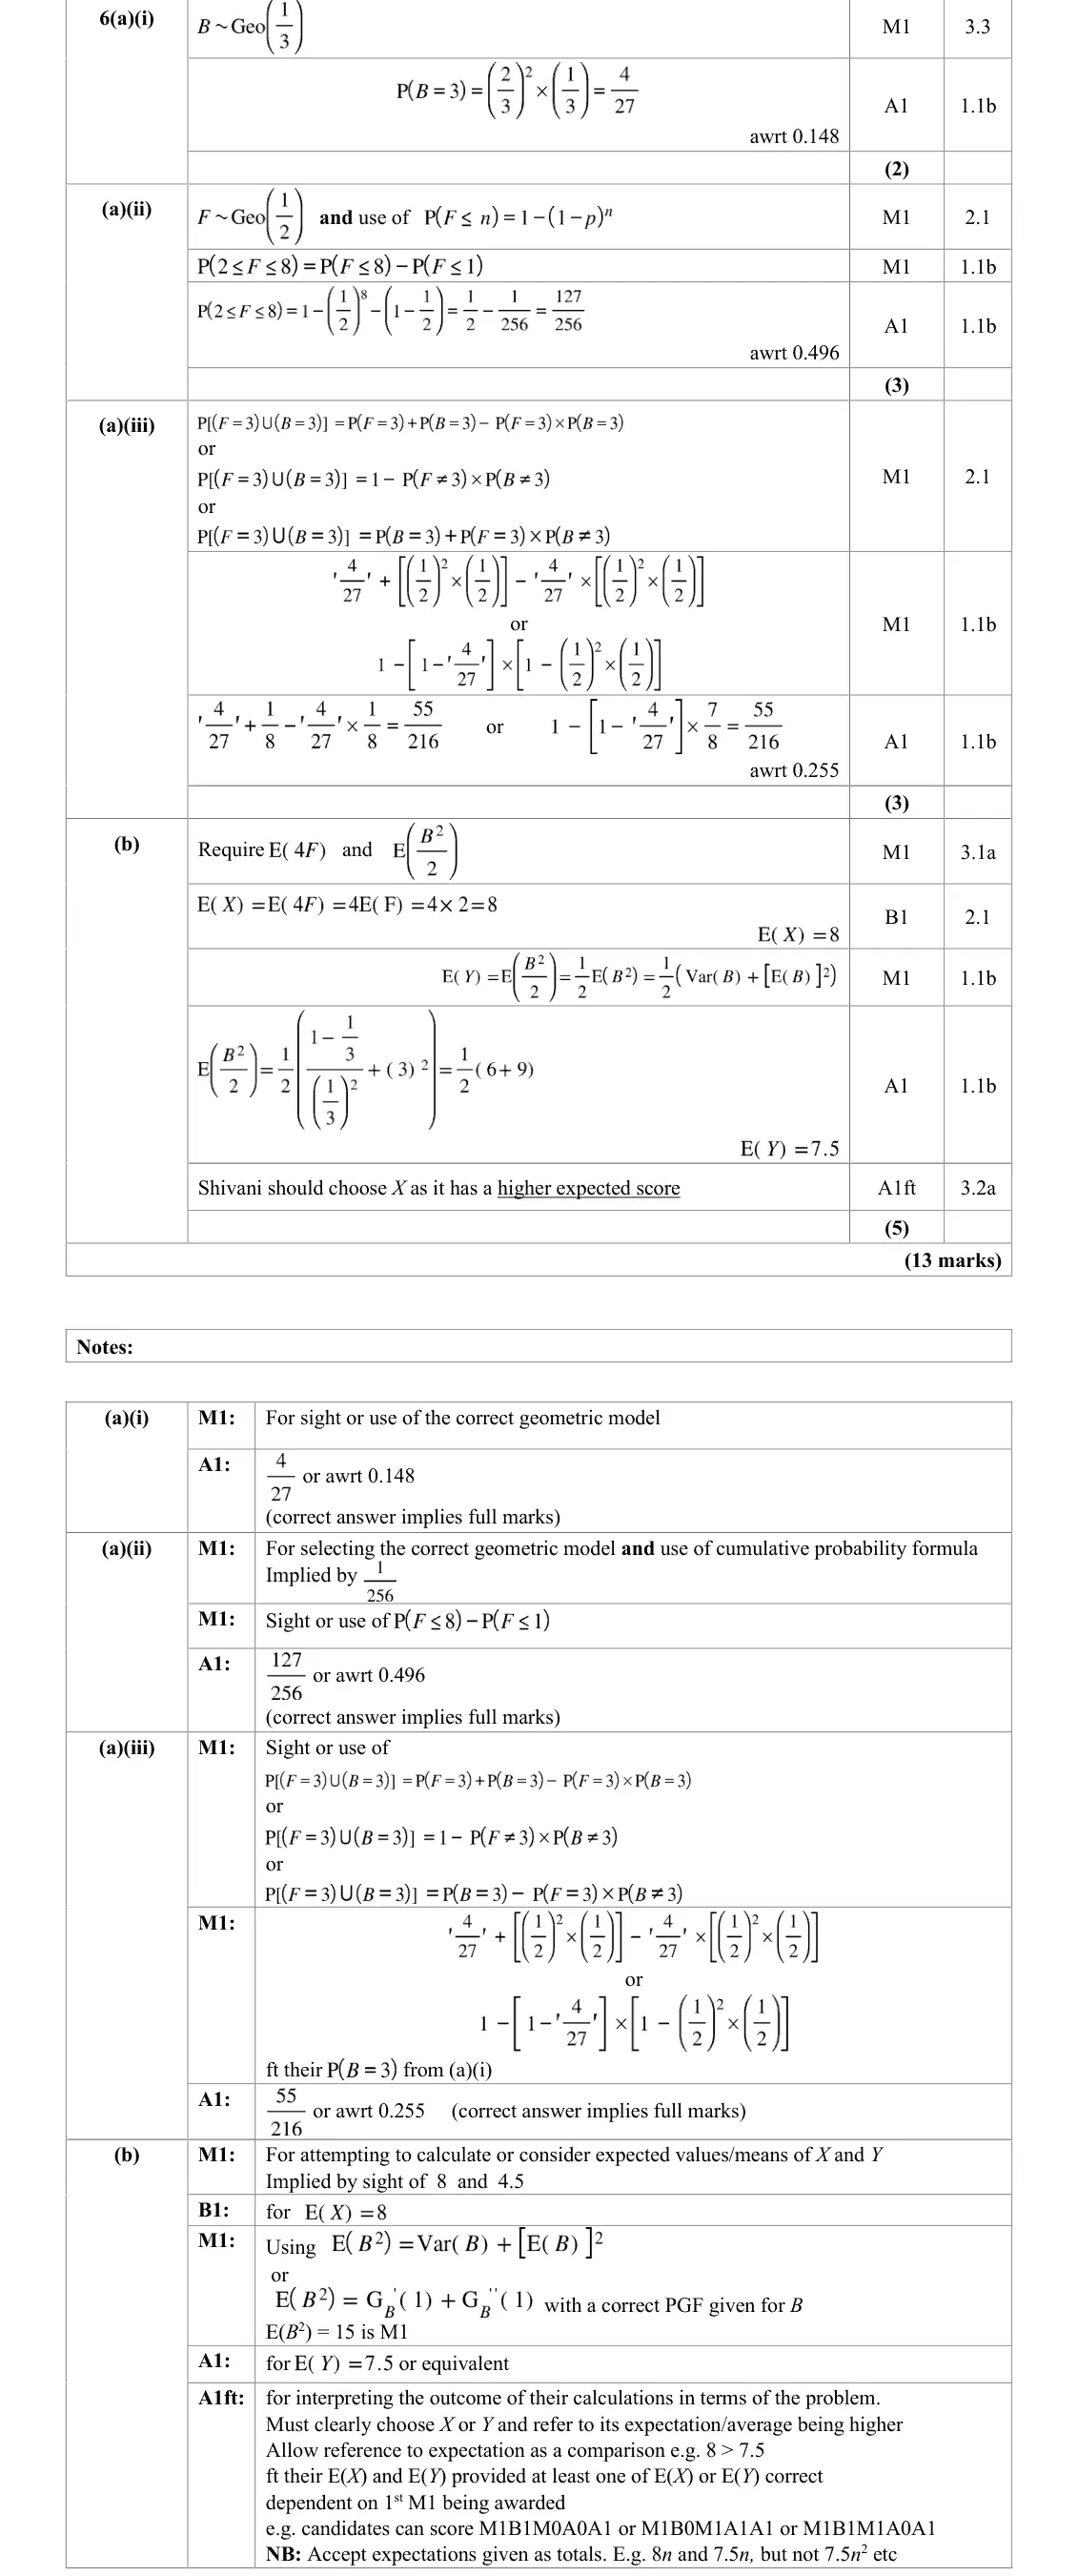
6(a)(i) Geometric and negative binomial distributions 2 —
6(a)(ii) Geometric and negative binomial distributions 3 —
6(a)(iii) Geometric and negative binomial distributions 3 —
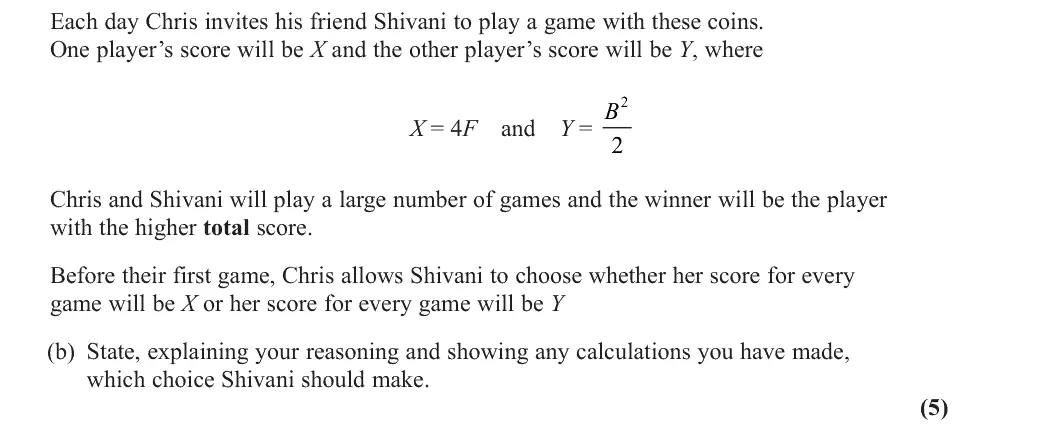
6(b) Geometric and negative binomial distributions, Discrete random variables: mean and variance 5 —
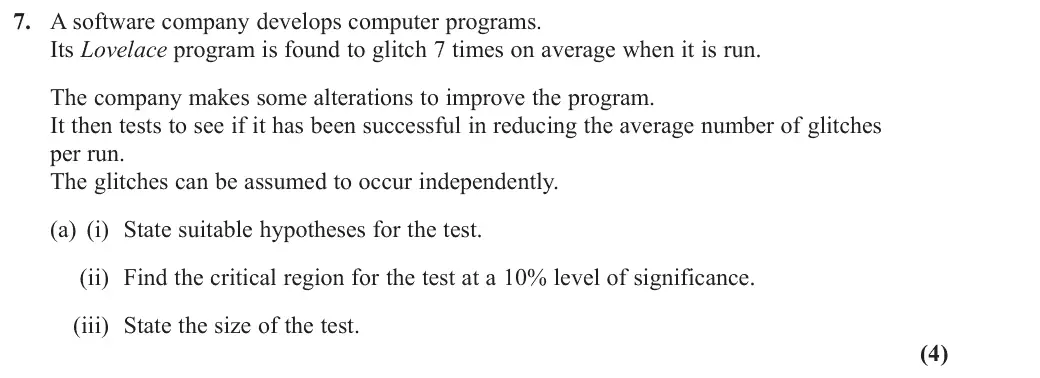
7(a) Hypothesis tests: Poisson, binomial and geometric, Quality of tests: Type I and Type II errors, size and power 4 —
7(b) Quality of tests: Type I and Type II errors, size and power 3 —
7(c) Geometric and negative binomial distributions 1 —
7(d) Quality of tests: Type I and Type II errors, size and power, Geometric and negative binomial distributions 2 —
7(e) Quality of tests: Type I and Type II errors, size and power 4 —

The questions

1(a)(i)1(a)(ii)1(b)2(a)2(b)3(a)3(b)3(c)3(d)4(a)4(b)4(c)4(d)5(a)5(b)5(c)6(a)(i)6(a)(ii)6(a)(iii)6(b)7(a)7(b)7(c)7(d)7(e)
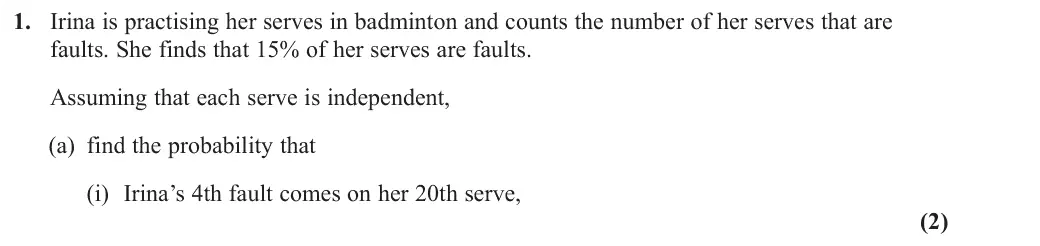
June 2025 · Paper 3B (Further Statistics 1) · Q1(a)(i) 2 marks geometric and negative binomial
1. Irina is practising her serves in badminton and counts the number of her serves that are faults. She finds that 15% of her serves are faults. Assuming that each serve is independent, (a) find the probability that (i) Irina’s 4th fault comes on her 20th serve, (2)
June 2025 · Paper 3B (Further Statistics 1) · Q1(a)(ii) 2 marks poisson distribution
(ii) in 18 serves, Irina has 4 faults. (2)
June 2025 · Paper 3B (Further Statistics 1) · Q1(b) 3 marks geometric and negative binomial
With practice, Irina reduces her proportion of faults, p, so that the mean number of serves until her 4th fault is at least 32 (b) Find the maximum value of p (3)
June 2025 · Paper 3B (Further Statistics 1) · Q2(a) 2 marks discrete random variables
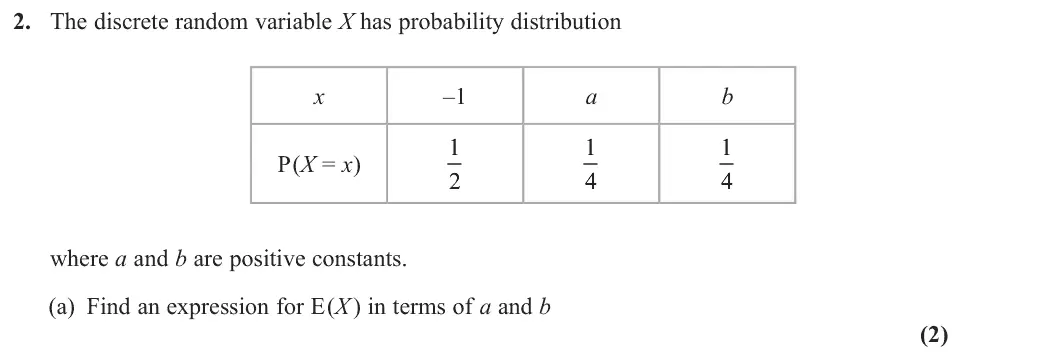
2. The discrete random variable X has probability distribution –1 x a b P(X = x) where a and b are positive constants. (a) Find an expression for E(X) in terms of a and b (2)
June 2025 · Paper 3B (Further Statistics 1) · Q2(b) 7 marks discrete random variables
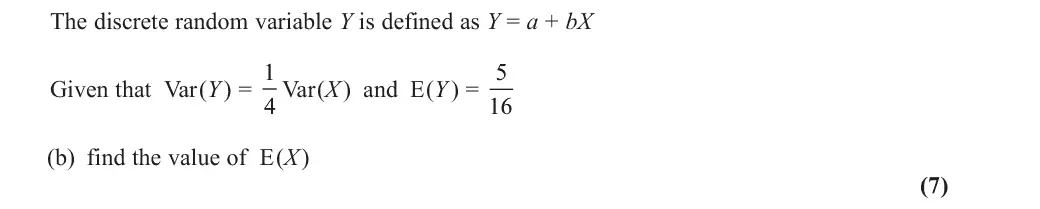
The discrete random variable Y is defined as Y = a + bX Given that Var(Y) = 1 4 Var(X) and E(Y) = 5 (b) find the value of E(X) (7)
June 2025 · Paper 3B (Further Statistics 1) · Q3(a) 2 marks chi squared tests
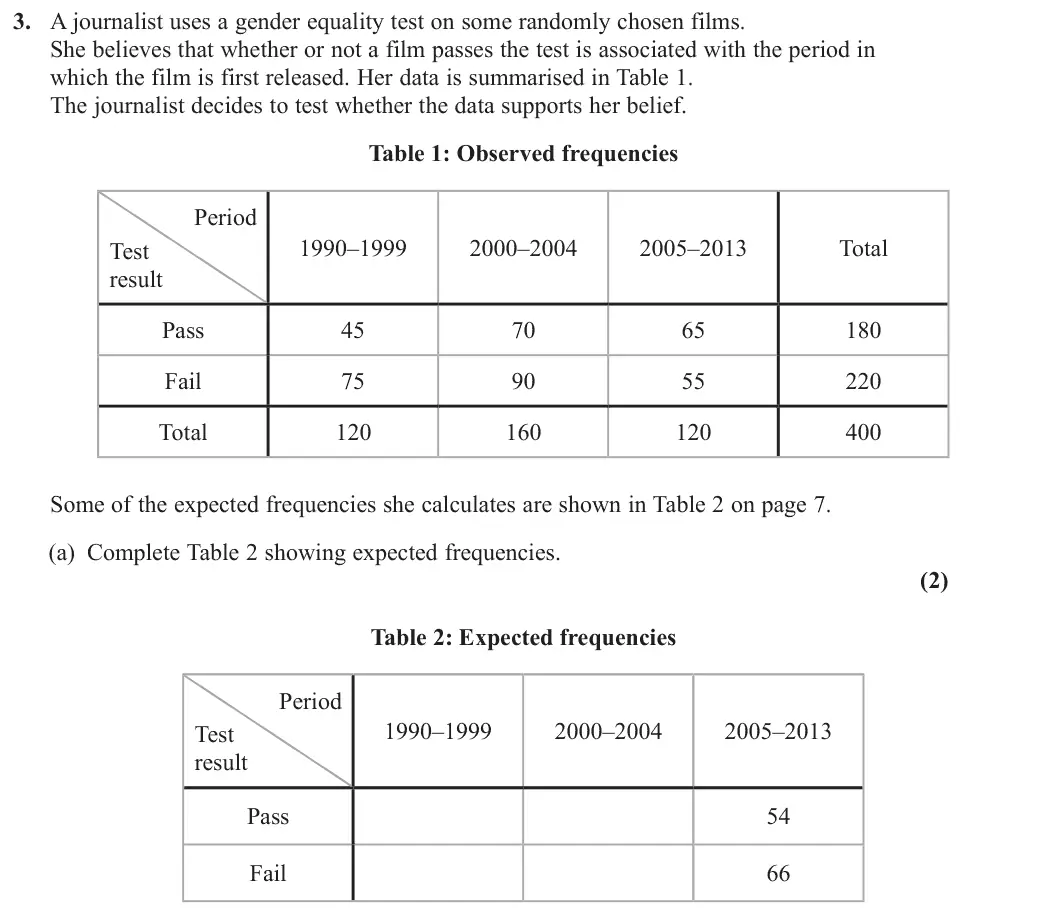
3. A journalist uses a gender equality test on some randomly chosen films. She believes that whether or not a film passes the test is associated with the period in which the film is first released. Her data is summarised in Table 1. The journalist decides to test whether the data supports her belief. Table 1: Observed frequencies Period 1990–1999 2000–2004 2005–2013 Total Test result Pass Fail Total Some of the expected frequencies she calculates are shown in Table 2 on page 7. (a) Complete Table 2 showing expected frequencies. (2)
June 2025 · Paper 3B (Further Statistics 1) · Q3(b) 1 mark chi squared tests
(b) Write down hypotheses for a suitable test to assess the journalist’s belief. (1)
June 2025 · Paper 3B (Further Statistics 1) · Q3(c) 6 marks chi squared tests
(c) Showing your working clearly, test the journalist’s belief using a 5% level of significance. You should state your critical value and conclusion clearly. (6)
June 2025 · Paper 3B (Further Statistics 1) · Q3(d) 3 marks chi squared tests
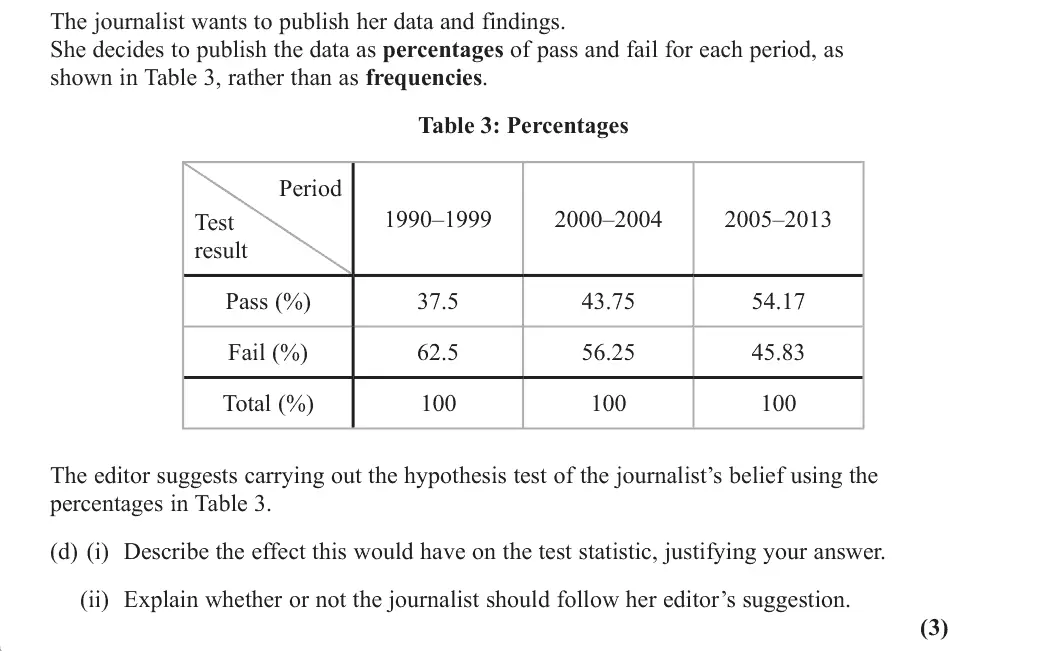
The journalist wants to publish her data and findings. She decides to publish the data as percentages of pass and fail for each period, as shown in Table 3, rather than as frequencies. Table 3: Percentages Period 1990–1999 2000–2004 2005–2013 Test result Pass (%) 37.5 43.75 54.17 Fail (%) 62.5 56.25 45.83 Total (%) The editor suggests carrying out the hypothesis test of the journalist’s belief using the percentages in Table 3. (d) (i) Describe the effect this would have on the test statistic, justifying your answer. (ii) Explain whether or not the journalist should follow her editor’s suggestion. (3)
June 2025 · Paper 3B (Further Statistics 1) · Q4(a) 2 marks probability generating functions
4. The discrete random variable X has probability generating function GX (t ) = – k t < ; where k is a constant. (a) Find the exact value of k (2)
June 2025 · Paper 3B (Further Statistics 1) · Q4(b) 3 marks probability generating functions
(b) Find the exact value of E(X) (3)
June 2025 · Paper 3B (Further Statistics 1) · Q4(c) 3 marks probability generating functions
(c) Find P(X = 2) (3)
June 2025 · Paper 3B (Further Statistics 1) · Q4(d) 2 marks probability generating functions
The random variable Y is defined as Y = 4X – 1 (d) Find the probability generating function of Y (2)
June 2025 · Paper 3B (Further Statistics 1) · Q5(a) 2 marks poisson distribution
5. A football team scores goals at an average rate of 1.8 goals per match. (a) Give two assumptions that would be necessary to use a Poisson distribution to model the number of goals scored in a match by the team. (2)
June 2025 · Paper 3B (Further Statistics 1) · Q5(b) 4 marks poisson distribution
Given that in their next match the team scores exactly 3 goals, (b) find the exact probability that 2 of these goals were scored in the first half of the match. (4)
June 2025 · Paper 3B (Further Statistics 1) · Q5(c) 4 marks central limit theorempoisson distribution
A hockey team plays 2 games each week during a 40-week season. Each game consists of 2 periods. The probability that the team concedes no goals in a period is 0.55 The random variable X represents the number of periods in a week in which the team concedes no goals. (c) (i) Write down a suitable distribution for X (ii) For this 40-week season, use the Central Limit Theorem to estimate P(X– > 2) (4)
June 2025 · Paper 3B (Further Statistics 1) · Q6(a)(i) 2 marks geometric and negative binomial
6. A biased coin and a fair coin are thrown repeatedly. The probability that the biased coin shows heads is 1 Let B represent the number of throws of the biased coin until it shows heads for the first time. Let F represent the number of throws of the fair coin until it shows heads for the first time. (a) Find (i) P(B = 3) (2)
June 2025 · Paper 3B (Further Statistics 1) · Q6(a)(ii) 3 marks geometric and negative binomial
(ii) P(2 F 8) (3)
June 2025 · Paper 3B (Further Statistics 1) · Q6(a)(iii) 3 marks geometric and negative binomial
(iii) P({B = 3} ∪ {F = 3}) (3)
June 2025 · Paper 3B (Further Statistics 1) · Q6(b) 5 marks geometric and negative binomialdiscrete random variables
Each day Chris invites his friend Shivani to play a game with these coins. One player’s score will be X and the other player’s score will be Y, where X = 4F and Y = B2 Chris and Shivani will play a large number of games and the winner will be the player with the higher total score. Before their first game, Chris allows Shivani to choose whether her score for every game will be X or her score for every game will be Y (b) State, explaining your reasoning and showing any calculations you have made, which choice Shivani should make. (5)
June 2025 · Paper 3B (Further Statistics 1) · Q7(a) 4 marks hypothesis tests fs1type i and type ii errors
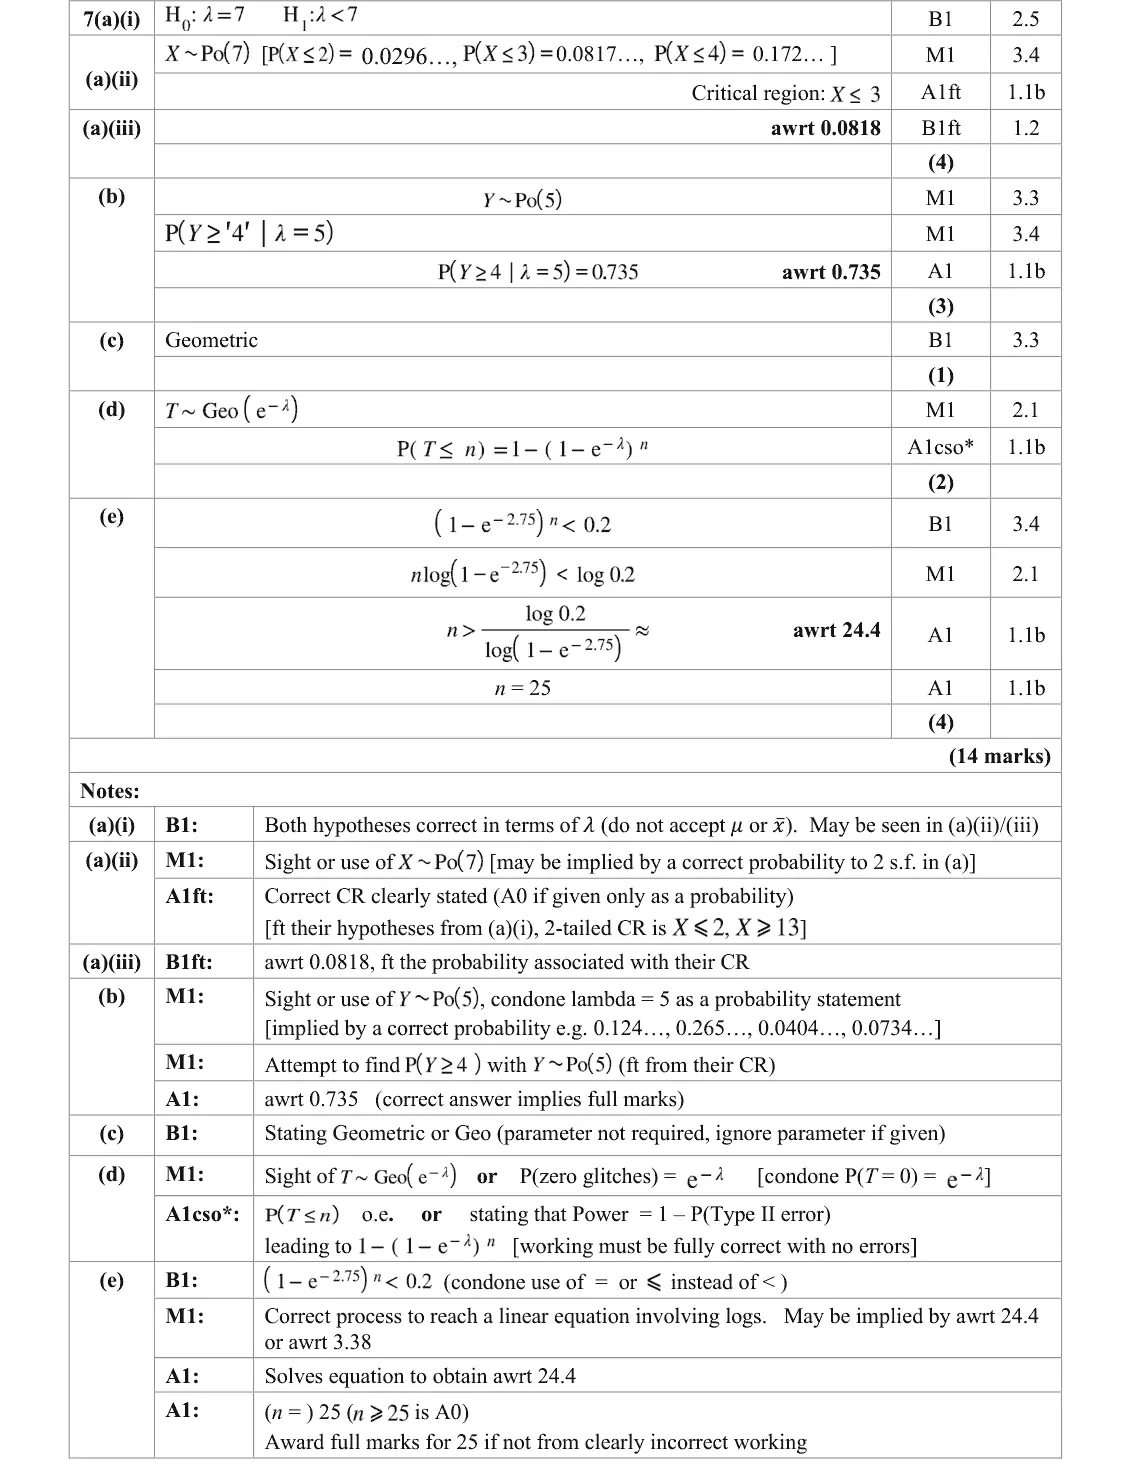
7. A software company develops computer programs. Its Lovelace program is found to glitch 7 times on average when it is run. The company makes some alterations to improve the program. It then tests to see if it has been successful in reducing the average number of glitches per run. The glitches can be assumed to occur independently. (a) (i) State suitable hypotheses for the test. (ii) Find the critical region for the test at a 10% level of significance. (iii) State the size of the test. (4)
June 2025 · Paper 3B (Further Statistics 1) · Q7(b) 3 marks type i and type ii errors
The altered program is actually found to glitch 5 times on average when run. (b) Find the probability of a Type II error for the company’s test. (3)
June 2025 · Paper 3B (Further Statistics 1) · Q7(c) 1 mark geometric and negative binomial
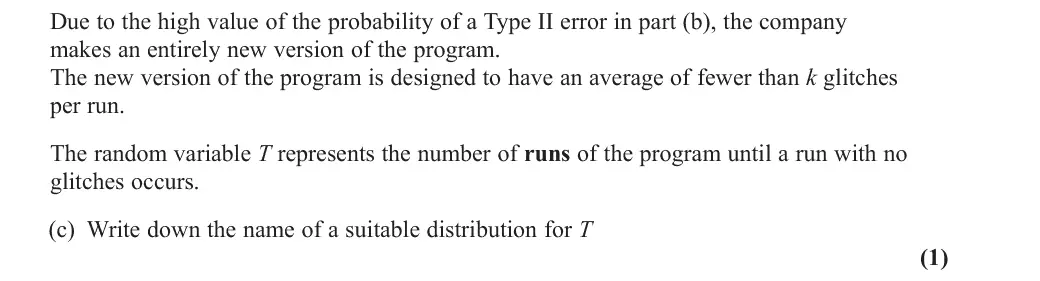
Due to the high value of the probability of a Type II error in part (b), the company makes an entirely new version of the program. The new version of the program is designed to have an average of fewer than k glitches per run. The random variable T represents the number of runs of the program until a run with no glitches occurs. (c) Write down the name of a suitable distribution for T (1)
June 2025 · Paper 3B (Further Statistics 1) · Q7(d) 2 marks type i and type ii errorsgeometric and negative binomial
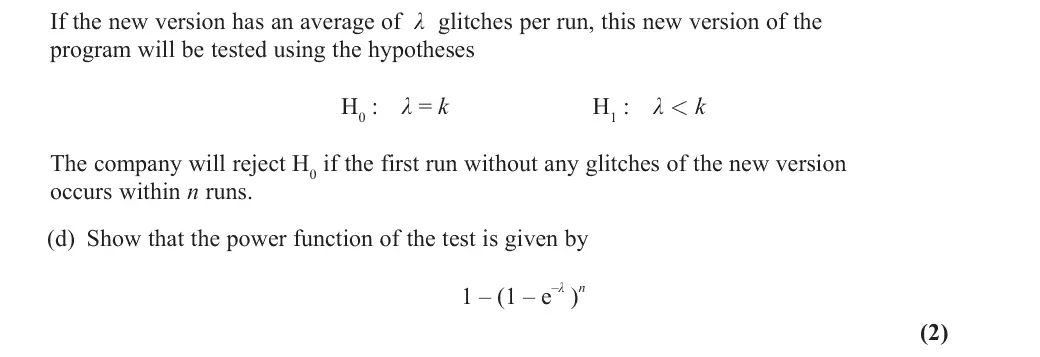
If the new version has an average of λ glitches per run, this new version of the program will be tested using the hypotheses H0 : λ = k H1 : λ < k The company will reject H0 if the first run without any glitches of the new version occurs within n runs. (d) Show that the power function of the test is given by 1 – (1 – e –λ ) n (2)
June 2025 · Paper 3B (Further Statistics 1) · Q7(e) 4 marks type i and type ii errors
The company requires P(Type II error) < 0.2 Assuming that the new version of the program has an average of 2.75 glitches per run, (e) find the minimum value of n (4)

Find an Edexcel Further Maths tutor

Want this paper marked and gone through with a Further Maths tutor? Message us.

Prefer email? Send an enquiry

If you are under 18, please include a parent's contact details. Enquiries go to enquiries@alevelfurthermathstutor.com and are deleted once handled.